Free to save and share

Frameworks and cheat sheets for customer research

Every framework, checklist and comparison from our guides, as an image you can download, drop into a deck or share with your team.
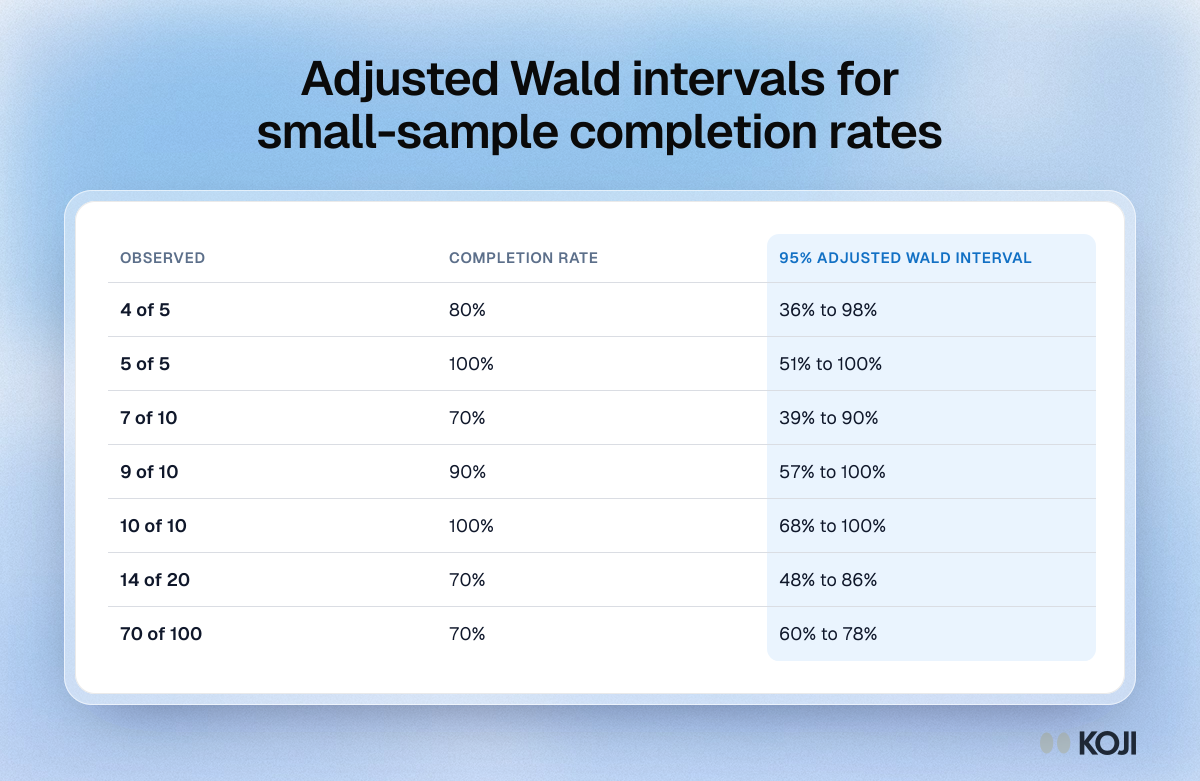
Table of 95% adjusted Wald confidence intervals for usability completion rates, showing that 5 of 5 successes fits a true rate as low as 51%.

Reference table

Adjusted Wald intervals for small-sample completion rates
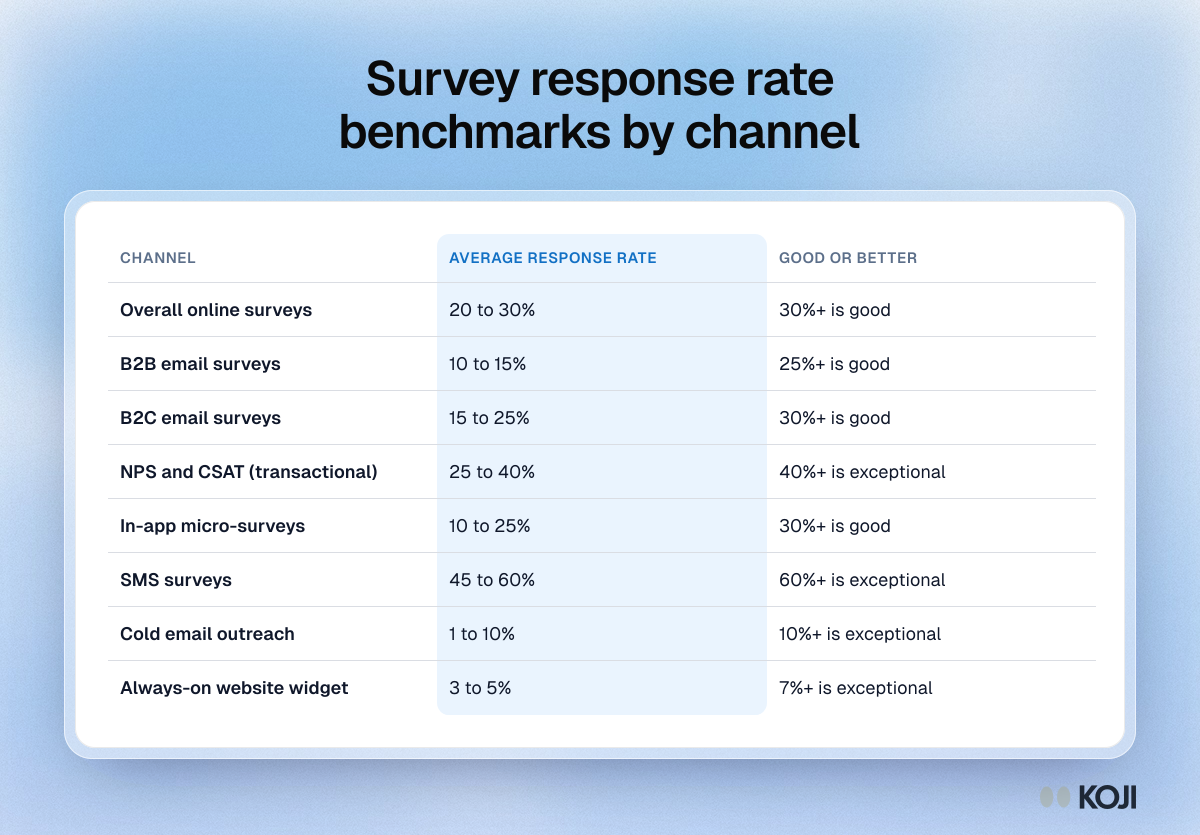
Table of survey response rate benchmarks by channel, from SMS surveys at 45 to 60% down to always-on website widgets at 3 to 5%.

Reference table

Survey response rate benchmarks by channel
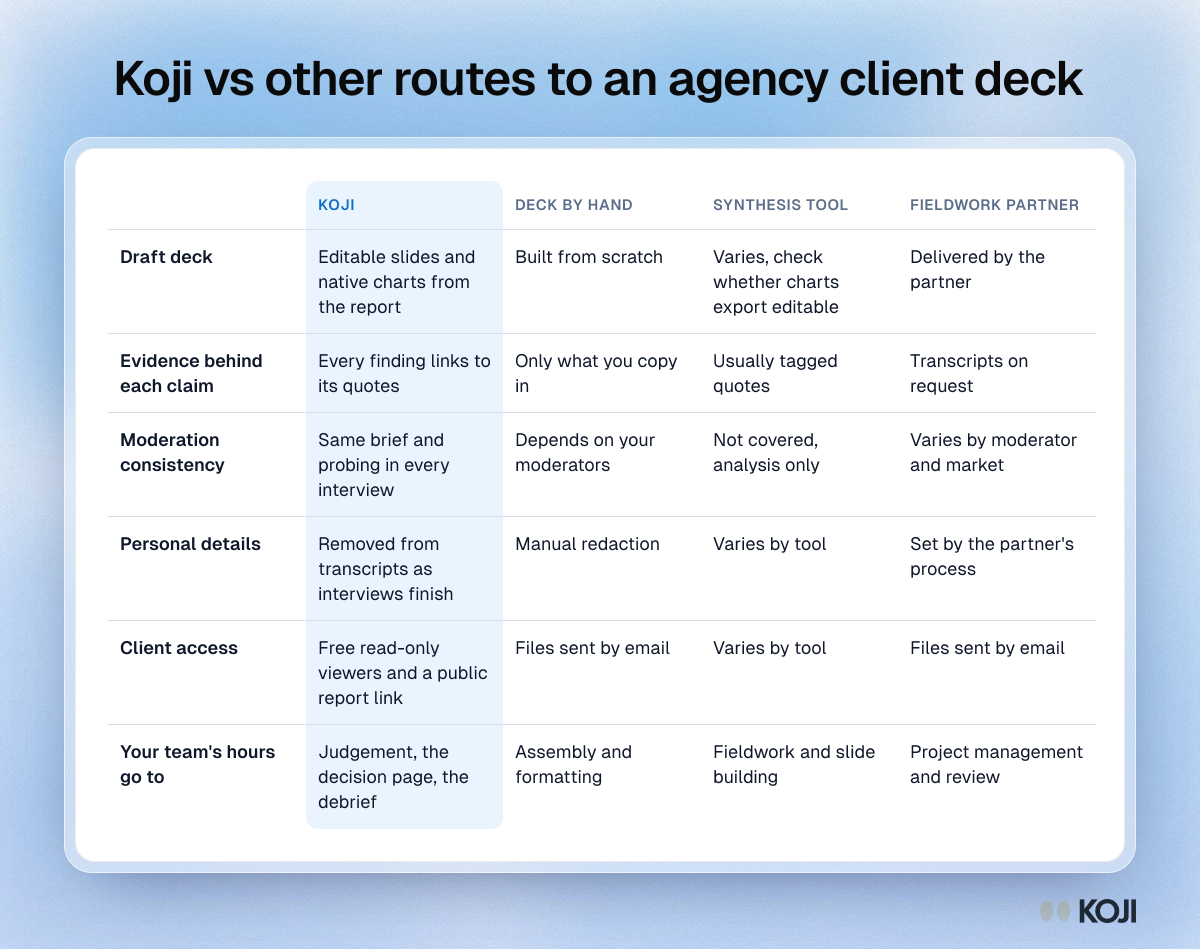
Comparison table of Koji against building the deck by hand, a transcription and synthesis tool, and a moderated fieldwork partner.

Reference table

Koji vs other routes to an agency client deck
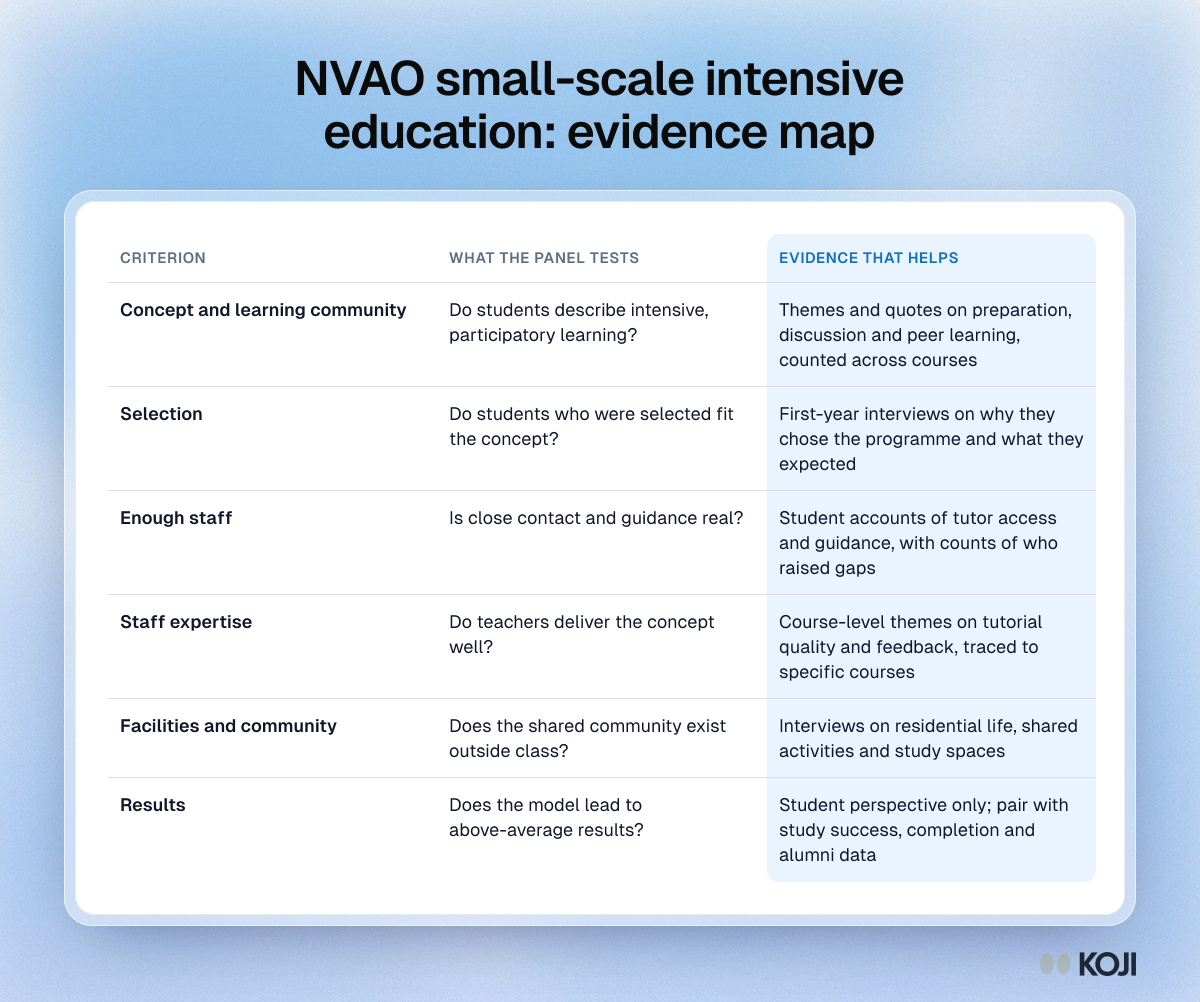
Table mapping NVAO small-scale and intensive education criteria to the student evaluation evidence that supports each one.

Reference table

NVAO small-scale intensive education: evidence map
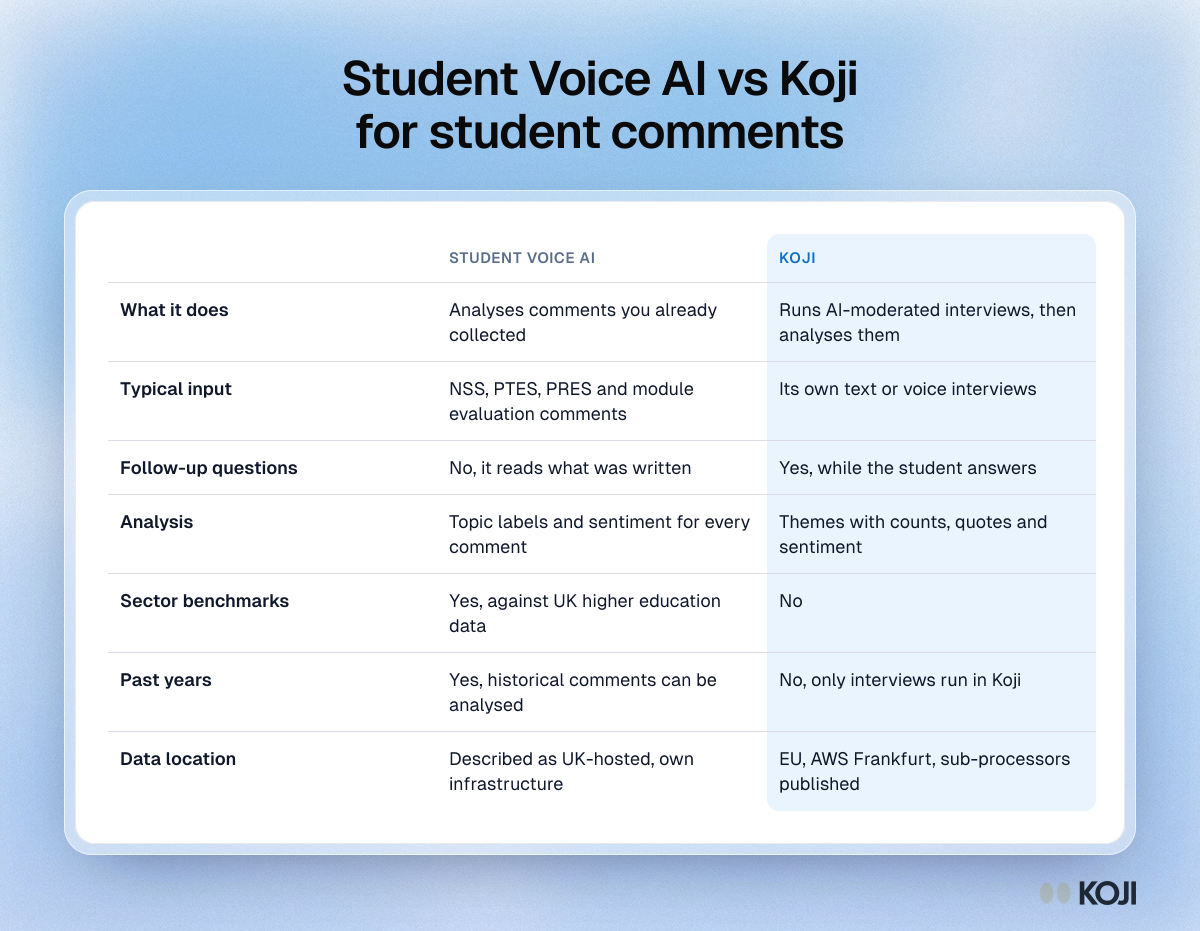
Table comparing Student Voice AI and Koji: what each does, inputs, follow-up questions, analysis, benchmarks, past data and data location.

Reference table

Student Voice AI vs Koji for student comments
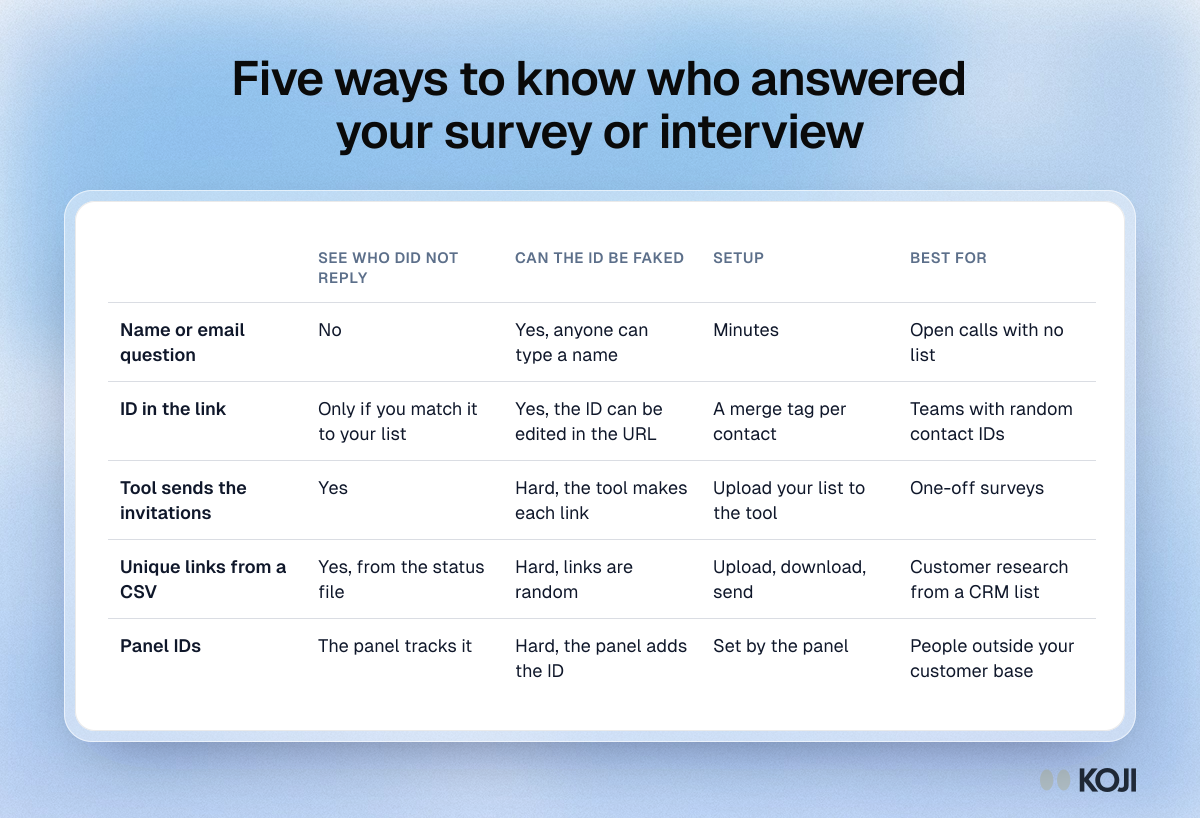
Table comparing five ways to tie survey or interview answers to people, by whether you see non-responders, whether IDs can be faked, setup and best use.

Reference table

Five ways to know who answered your survey or interview
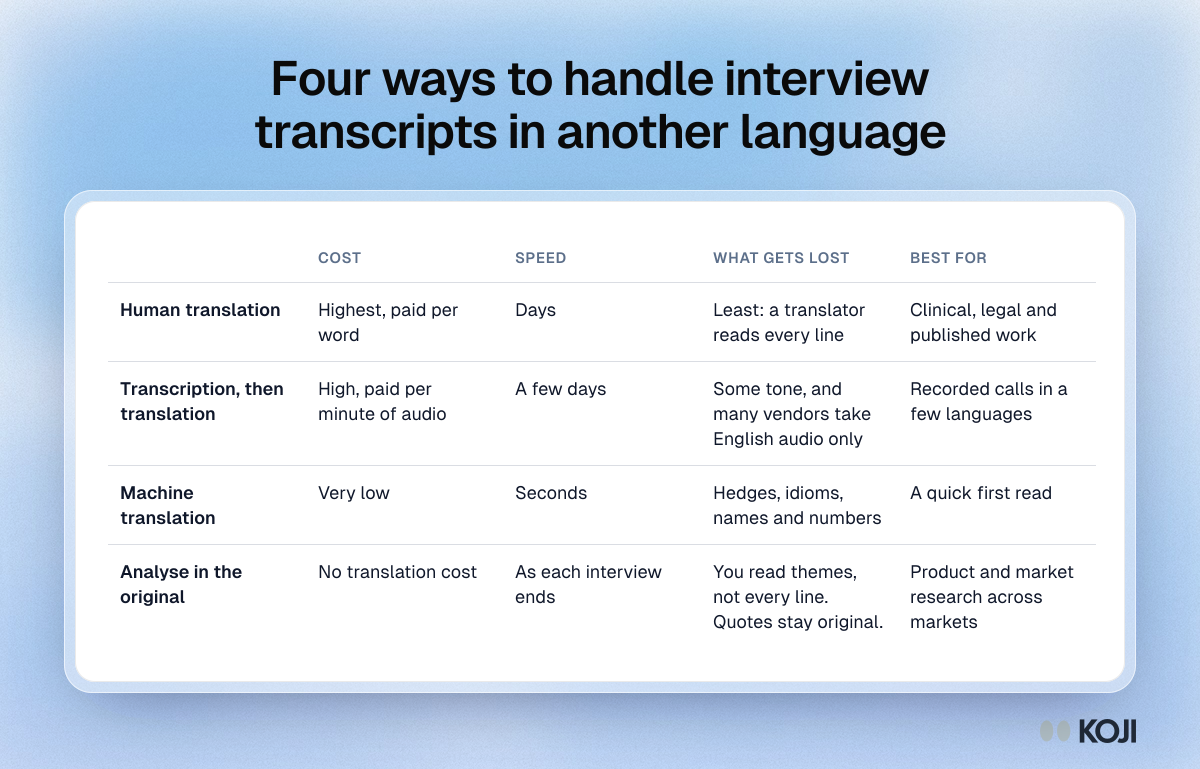
Table comparing four ways to handle interview transcripts in another language by cost, speed, what gets lost and who each suits.
Reference table

Four ways to handle interview transcripts in another language

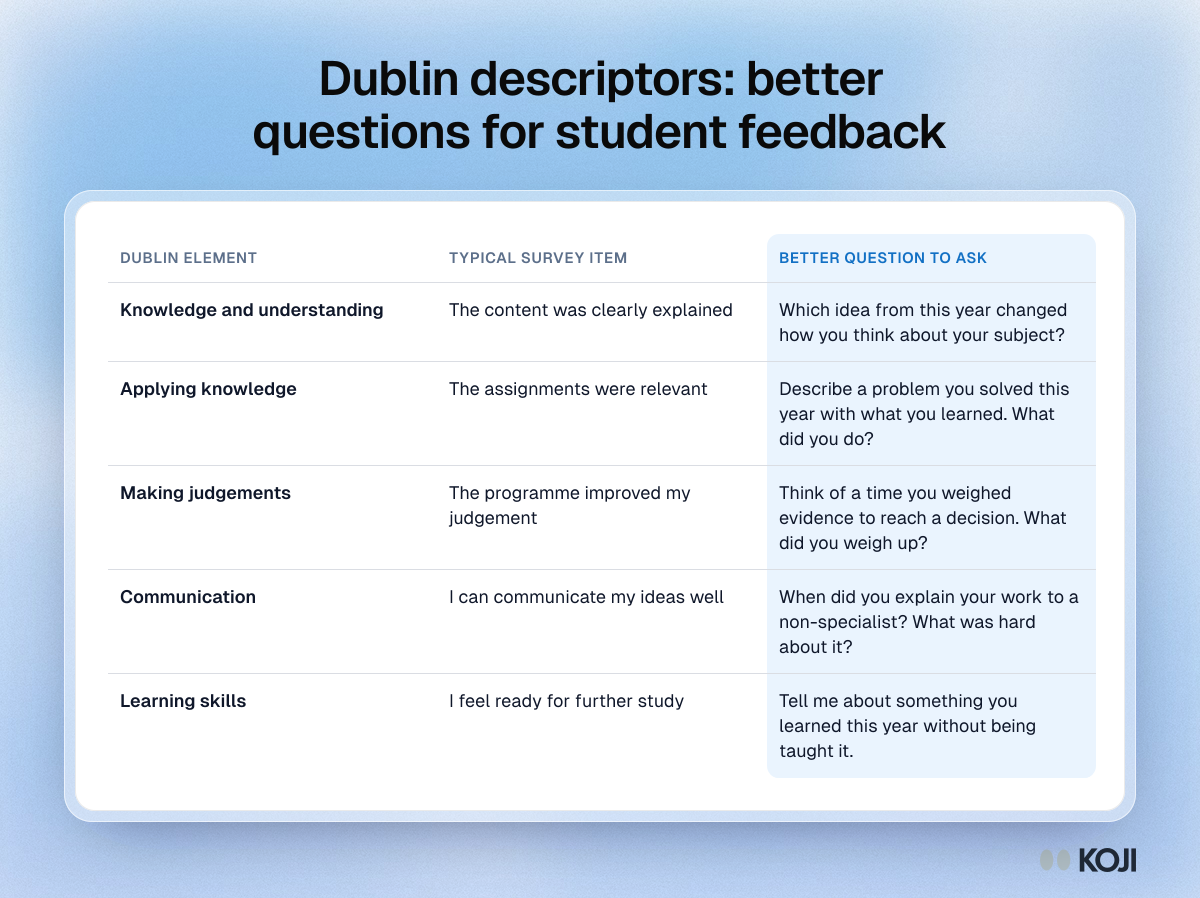
Table mapping the five Dublin descriptor elements to a typical course evaluation item and a better question that asks students for a concrete episode.

Reference table

Dublin descriptors: better questions for student feedback
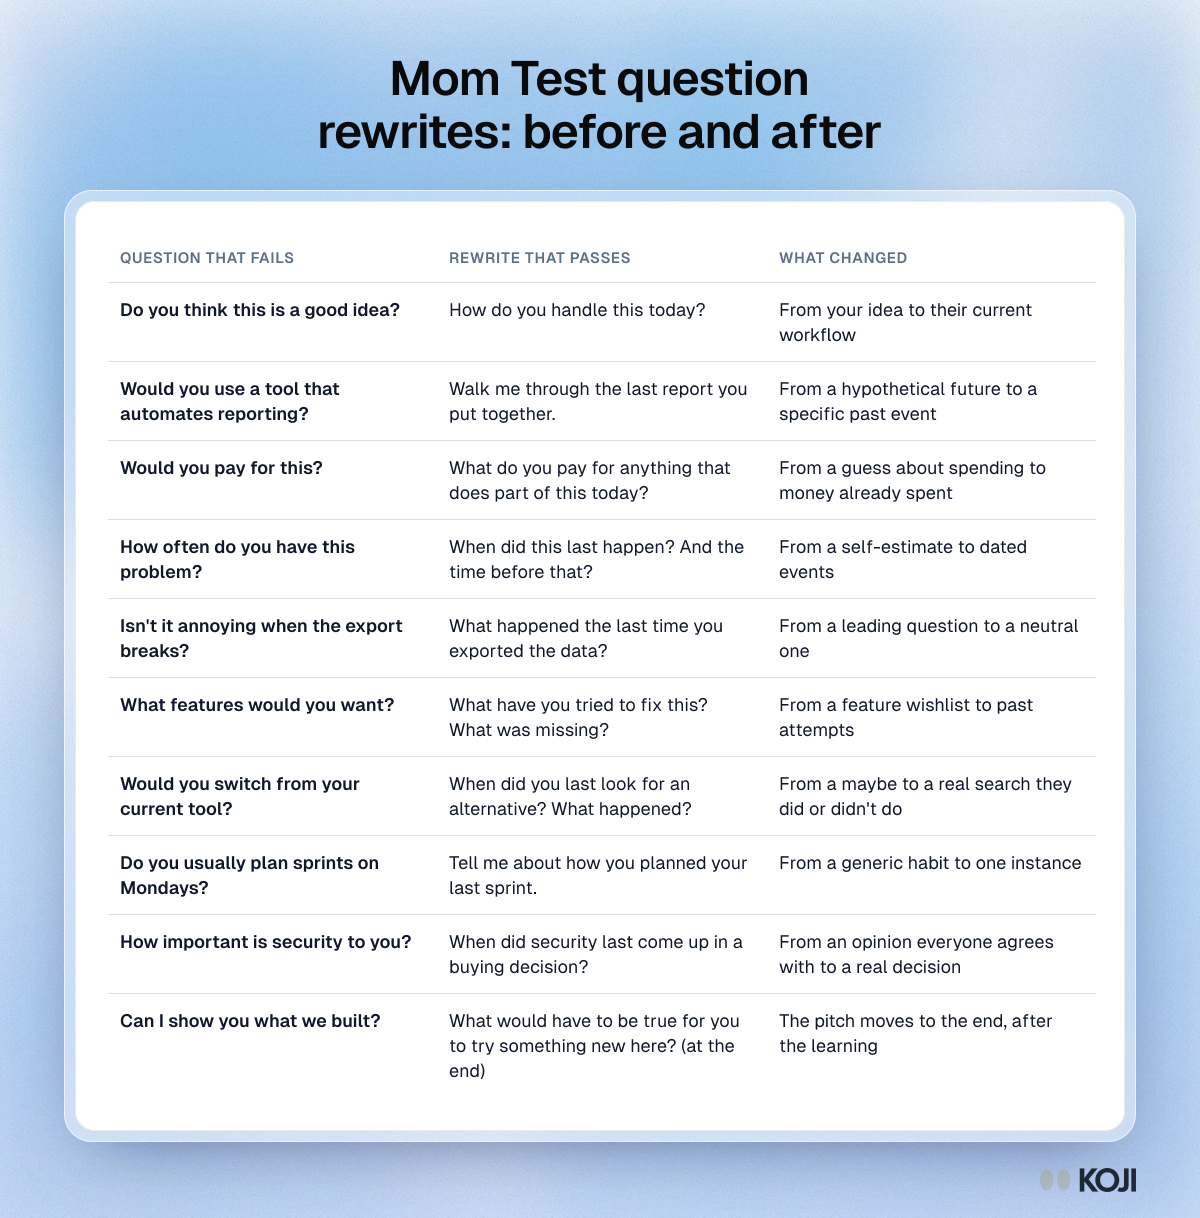
Table of ten customer interview questions that fail the Mom Test, each with a rewrite that asks about a specific past event instead.

Reference table

Mom Test question rewrites: before and after
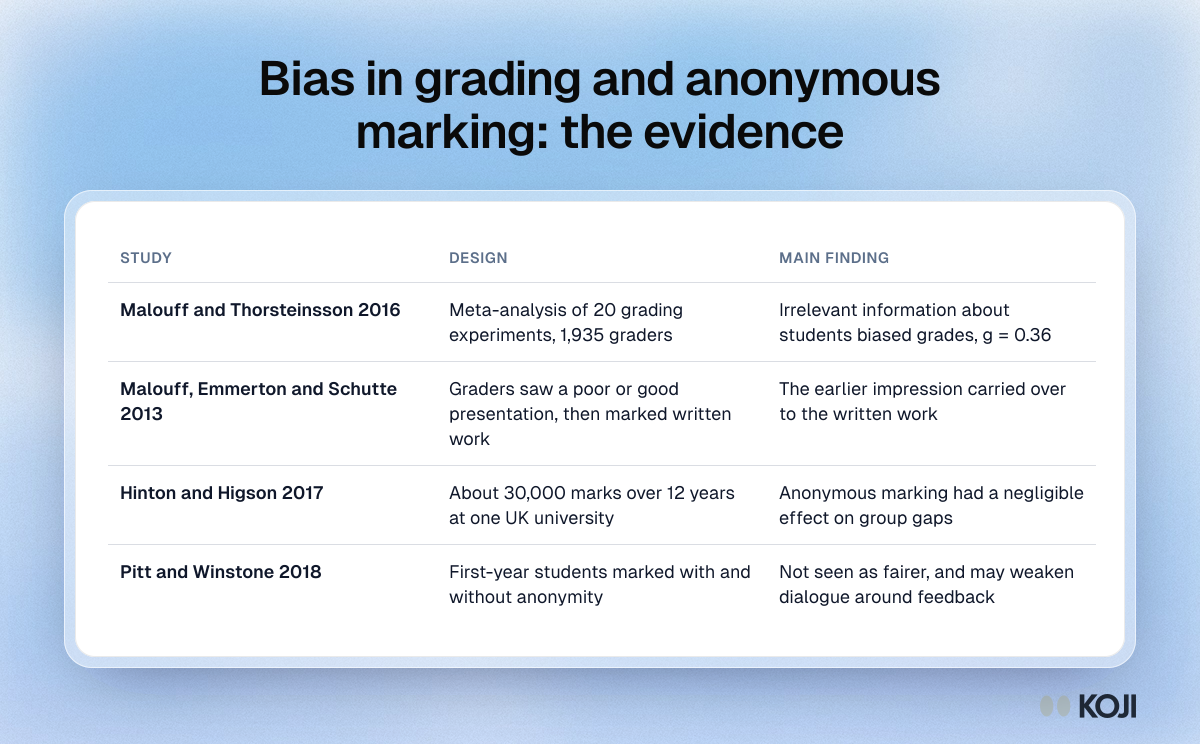
Table of four studies on bias in grading and anonymous marking, with each study's design and main finding.

Reference table

Bias in grading and anonymous marking: the evidence
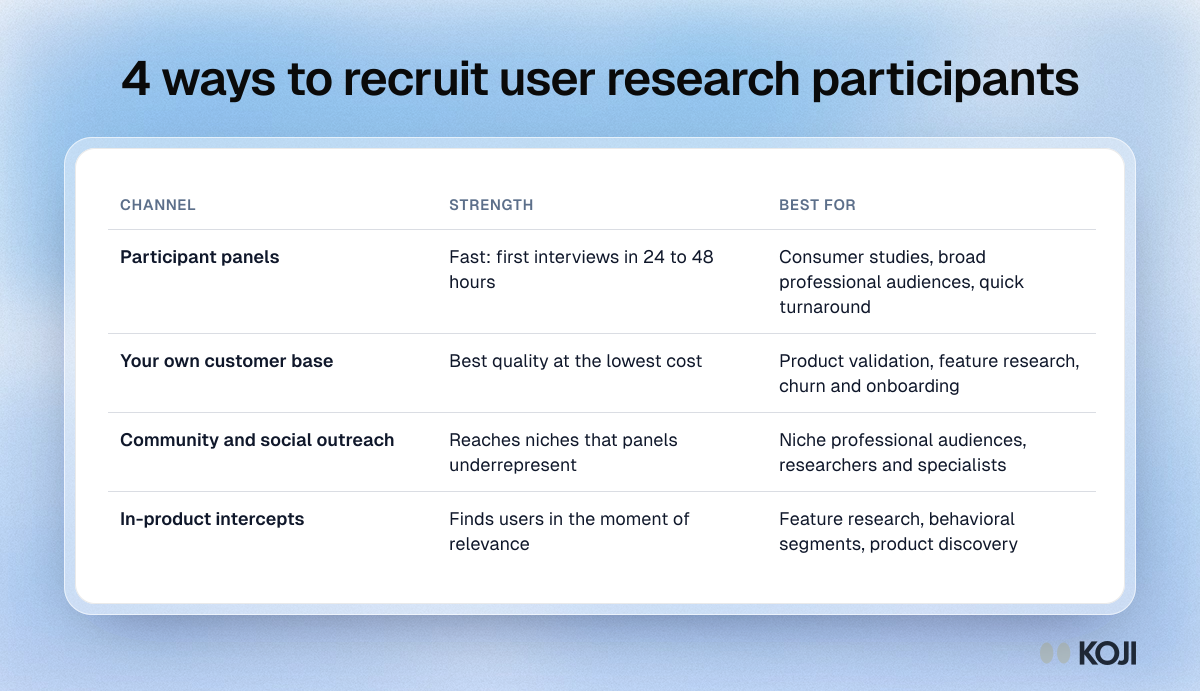
Table comparing four user research recruitment channels: participant panels, your customer base, community outreach and in-product intercepts.

Reference table

4 ways to recruit user research participants
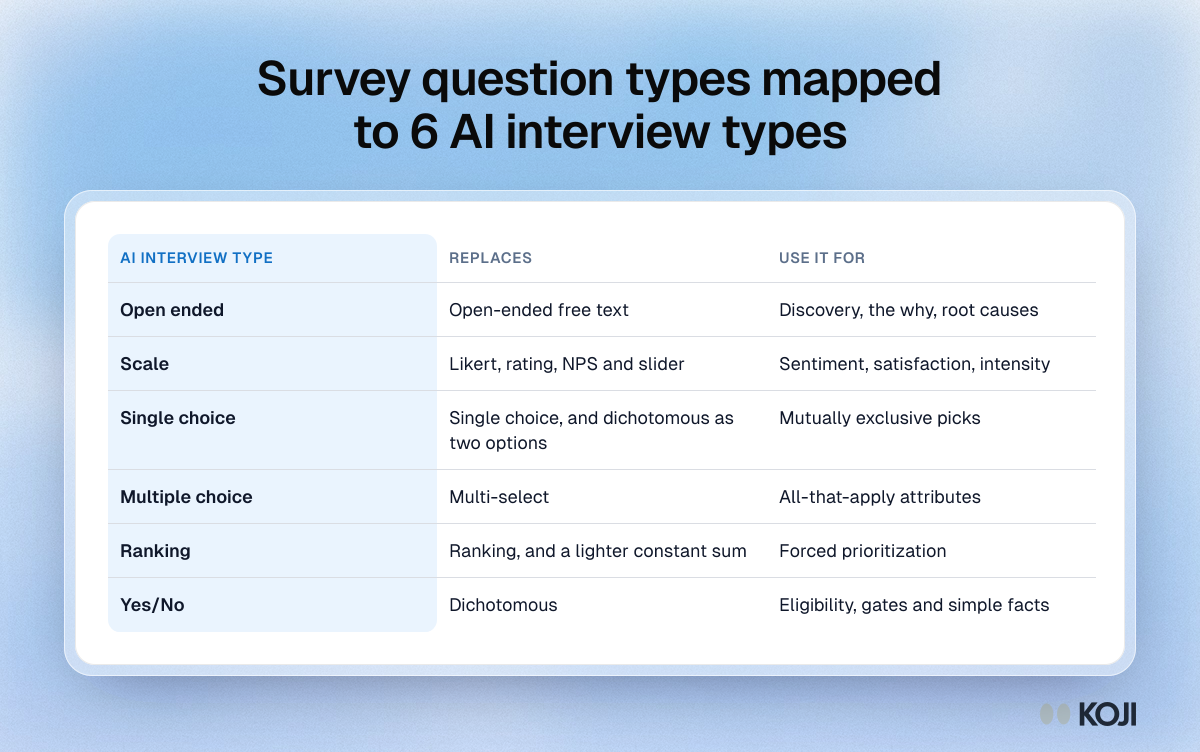
Table mapping classic survey question types to six AI interview types: open ended, scale, single choice, multiple choice, ranking and yes or no.

Reference table

Survey question types mapped to 6 AI interview types
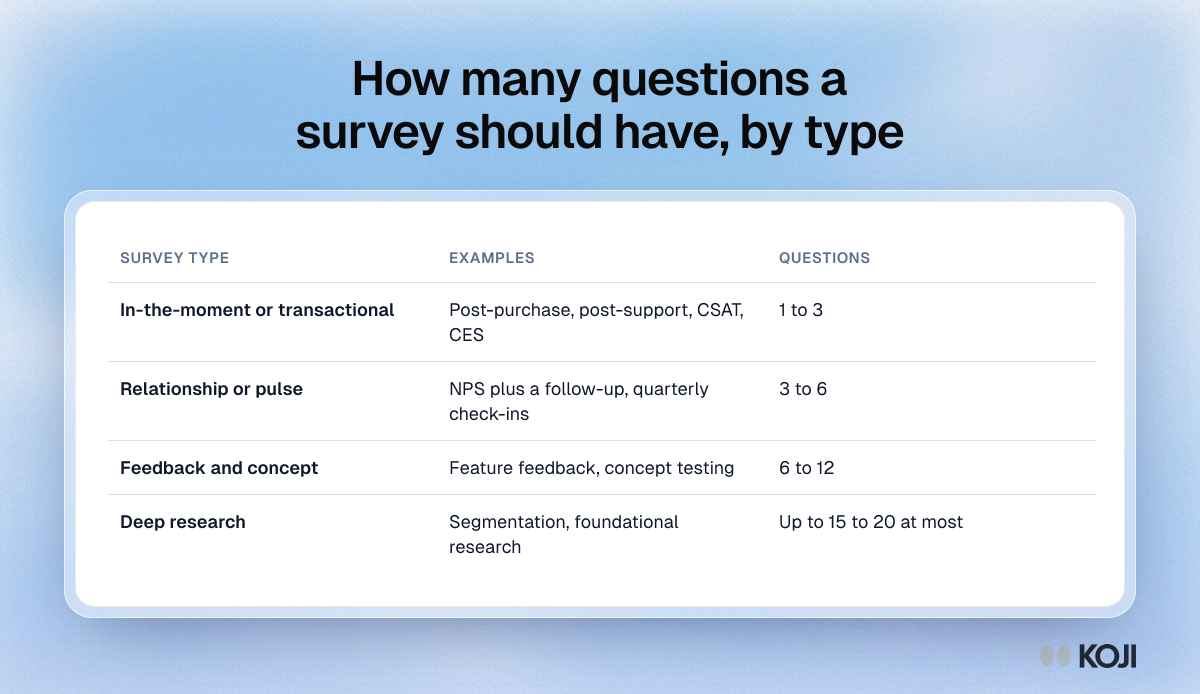
Table of survey length by type: 1 to 3 questions for transactional, 3 to 6 for pulse, 6 to 12 for concept and up to 15 to 20 for deep research.

Reference table

How many questions a survey should have, by type
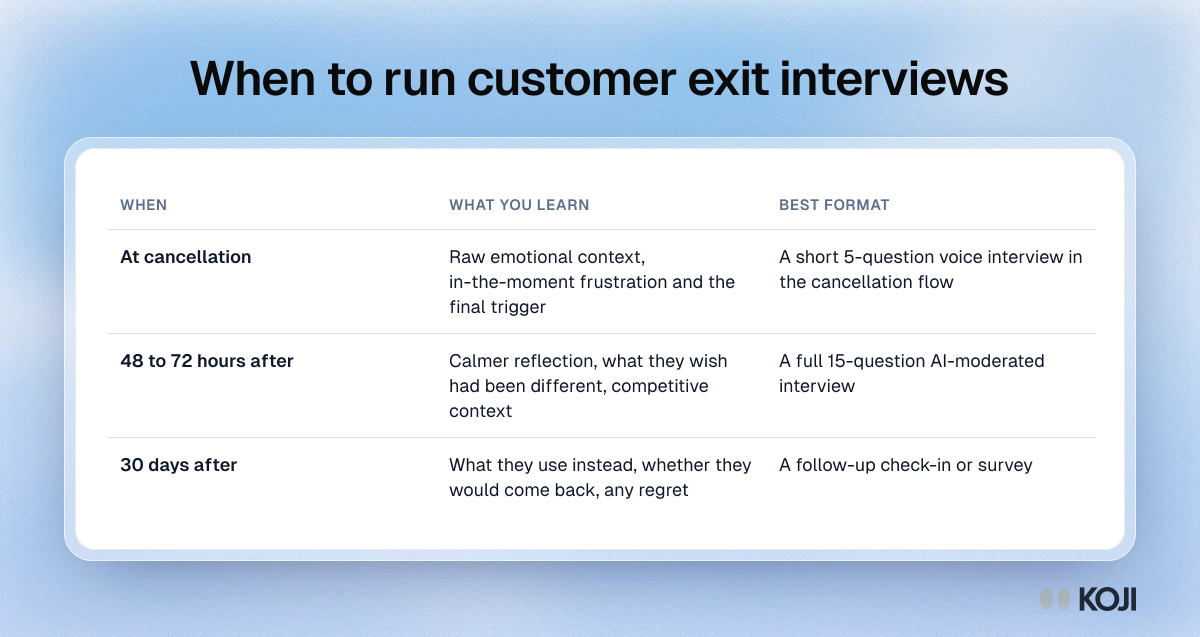
Table of three times to run a customer exit interview: at cancellation, 48 to 72 hours after and 30 days after, with what each teaches and its format.

Reference table

When to run customer exit interviews
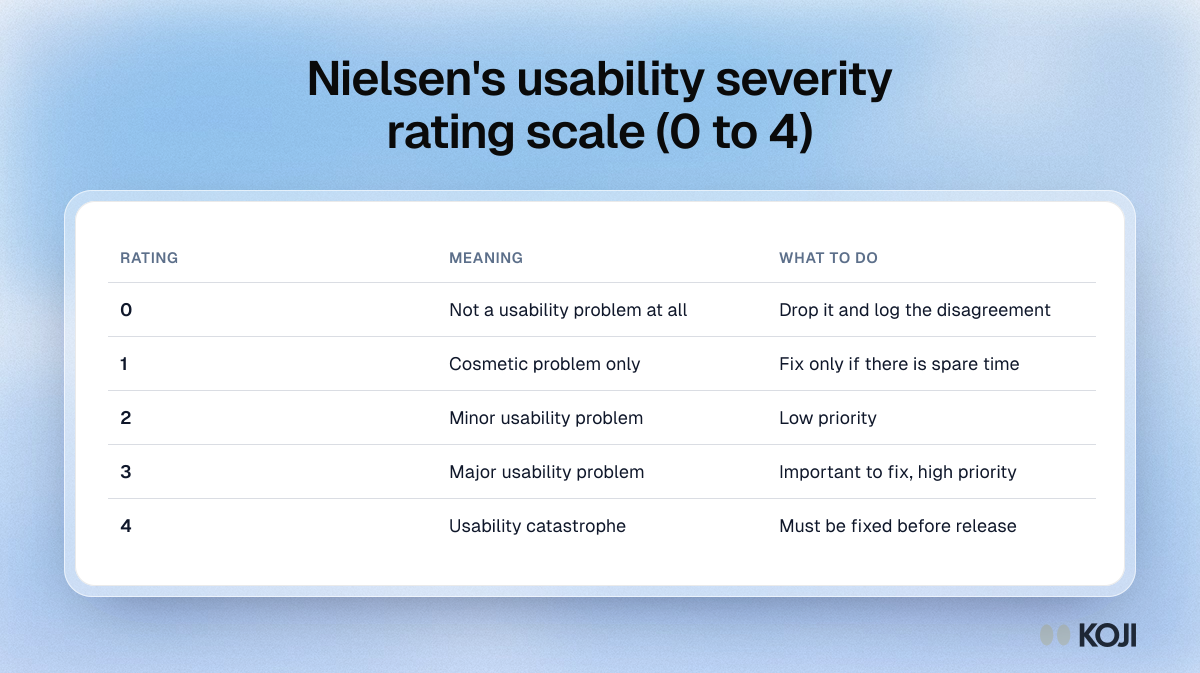
Table of the Nielsen 0 to 4 usability severity scale, from 0 not a problem and 1 cosmetic to 4 usability catastrophe, with the action for each rating.

Reference table

Nielsen's usability severity rating scale (0 to 4)
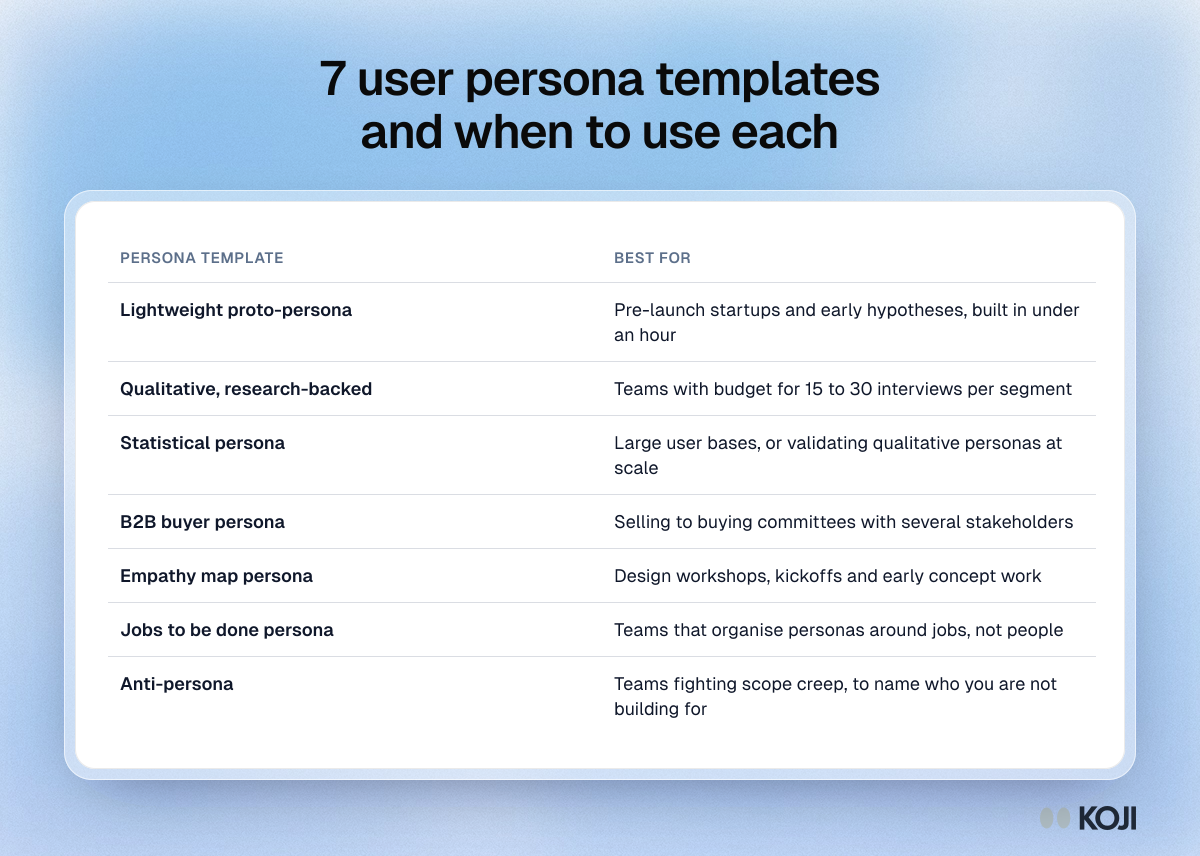
Table of seven user persona templates, from proto-persona and research-backed to statistical, buyer, empathy map, jobs to be done and anti-persona.

Reference table

7 user persona templates and when to use each
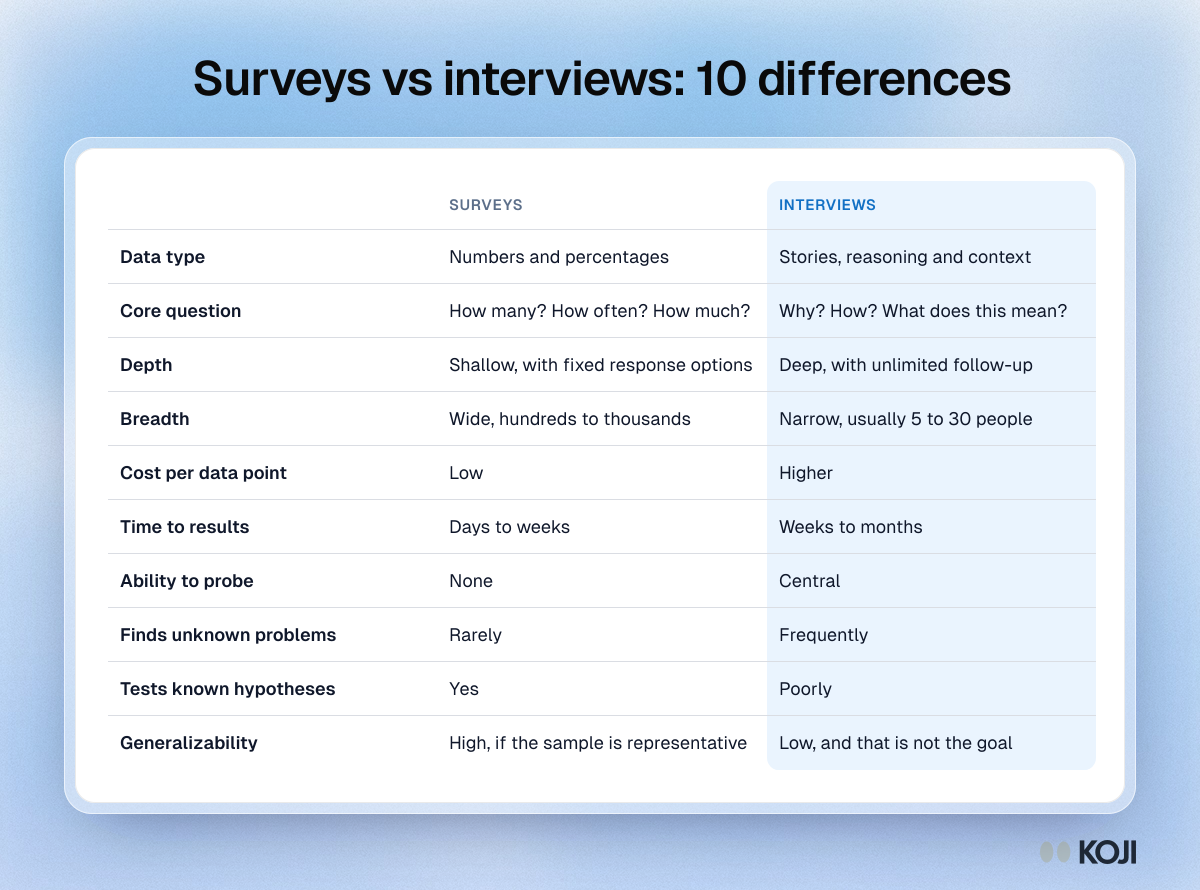
Table comparing surveys and interviews on ten points, from data type, depth and breadth to cost, speed and finding unknown problems.

Reference table

Surveys vs interviews: 10 differences
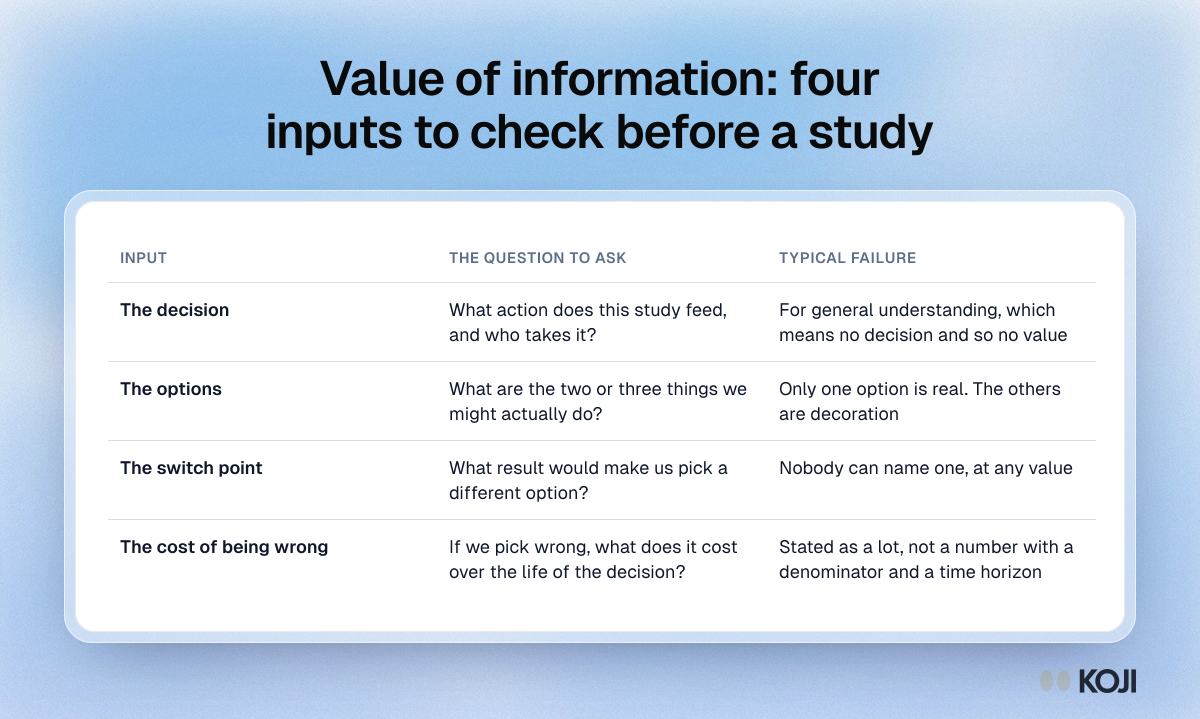
Table of the four inputs for a value of information check: the decision, the options, the switch point and the cost of being wrong, with how each one fails.

Reference table

Value of information: four inputs to check before a study
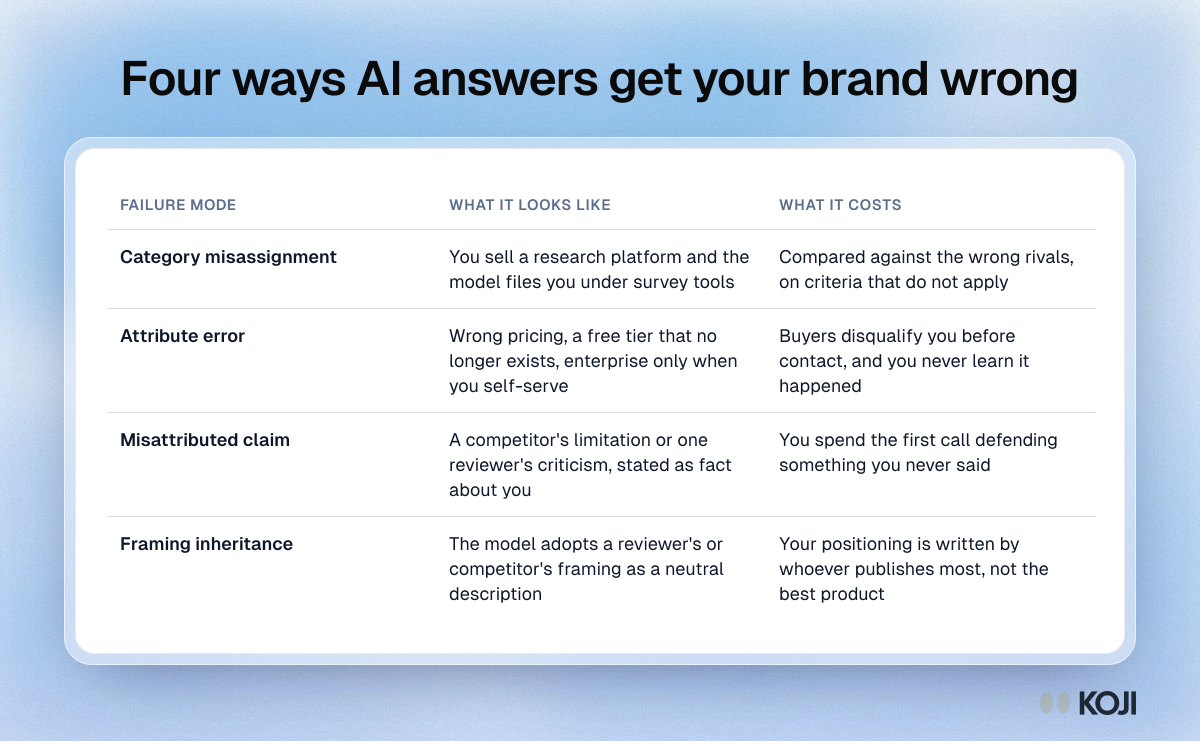
Table of four ways AI answers misdescribe a brand: category misassignment, attribute error, misattributed claim and framing inheritance, with what each costs.

Reference table

Four ways AI answers get your brand wrong
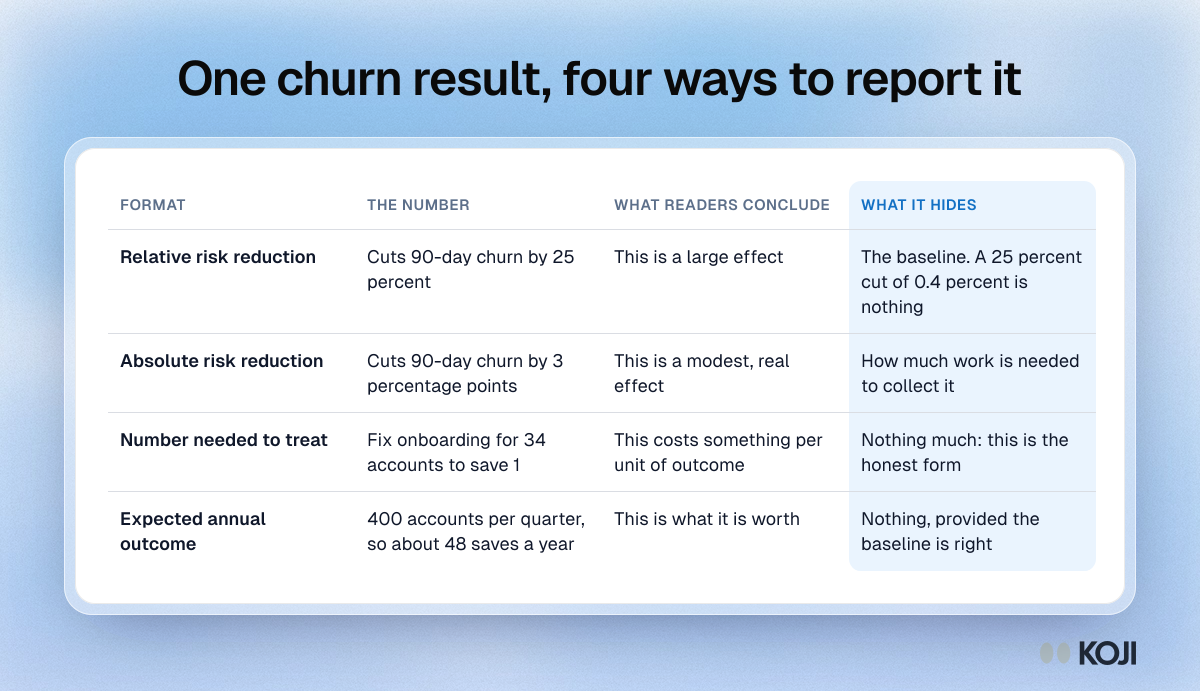
Table showing one onboarding result, churn down from 12% to 9%, as a relative reduction, an absolute reduction, a number needed to treat and an annual count.

Reference table

One churn result, four ways to report it
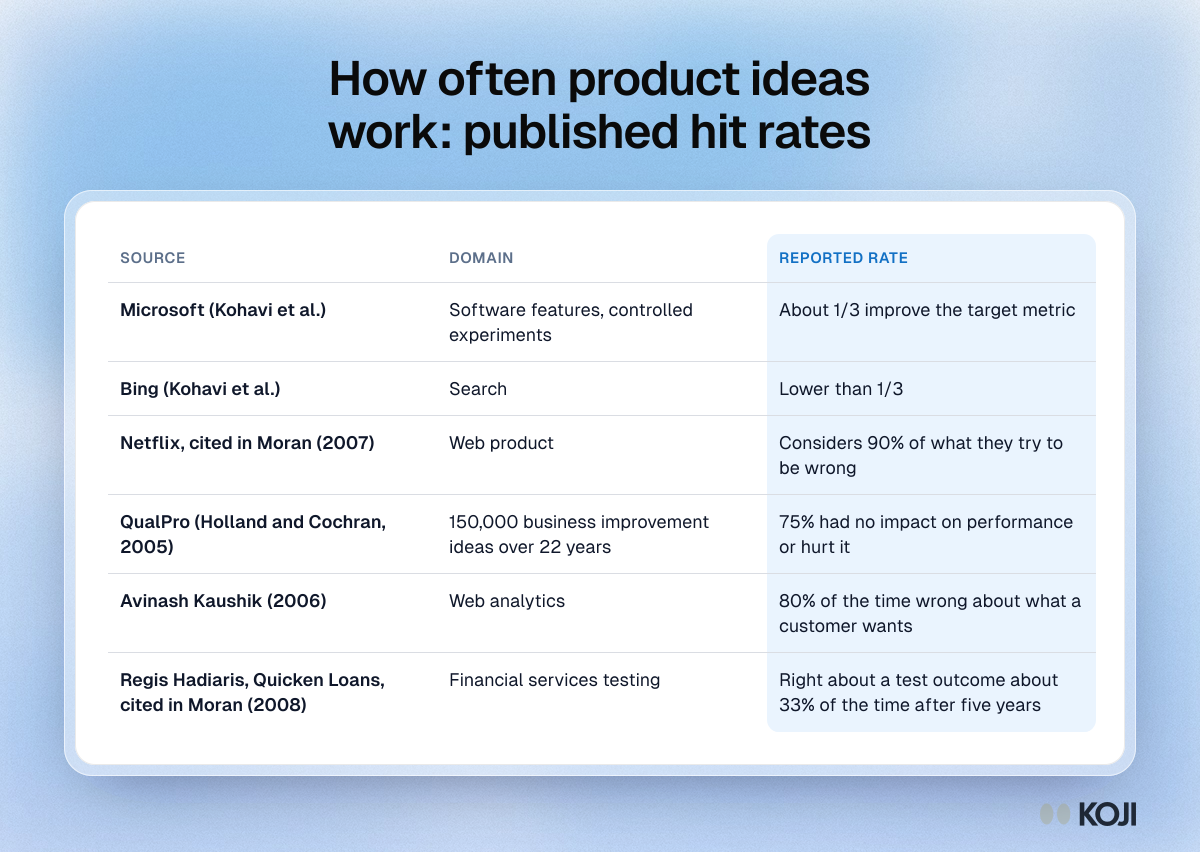
Table of published hit rates for product ideas from Microsoft, Bing, Netflix, QualPro, Avinash Kaushik and Quicken Loans, most near one in three or lower.

Reference table

How often product ideas work: published hit rates
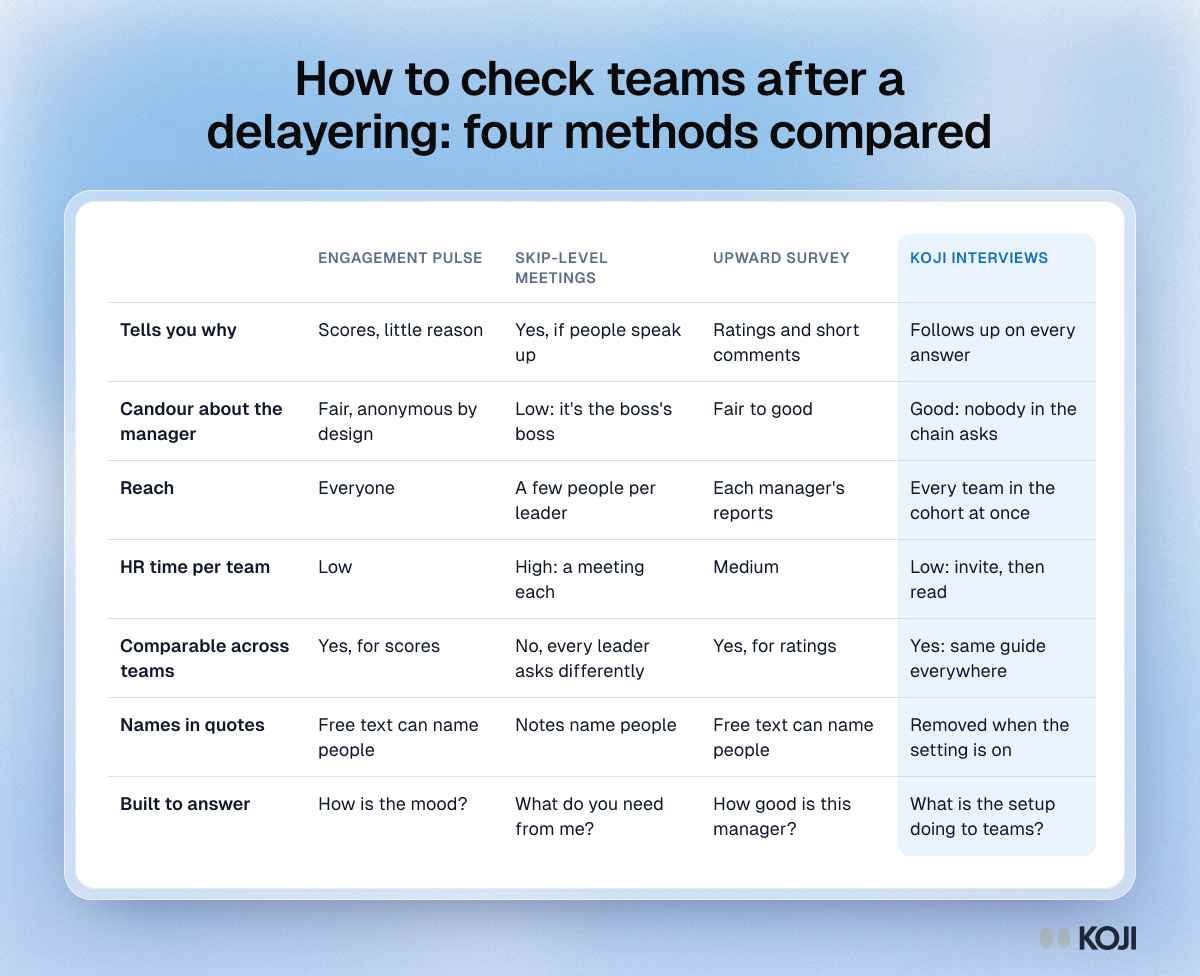
Table comparing an engagement pulse, skip-level meetings, an upward feedback survey and Koji for checking teams after a delayering

Reference table

How to check teams after a delayering: four methods compared
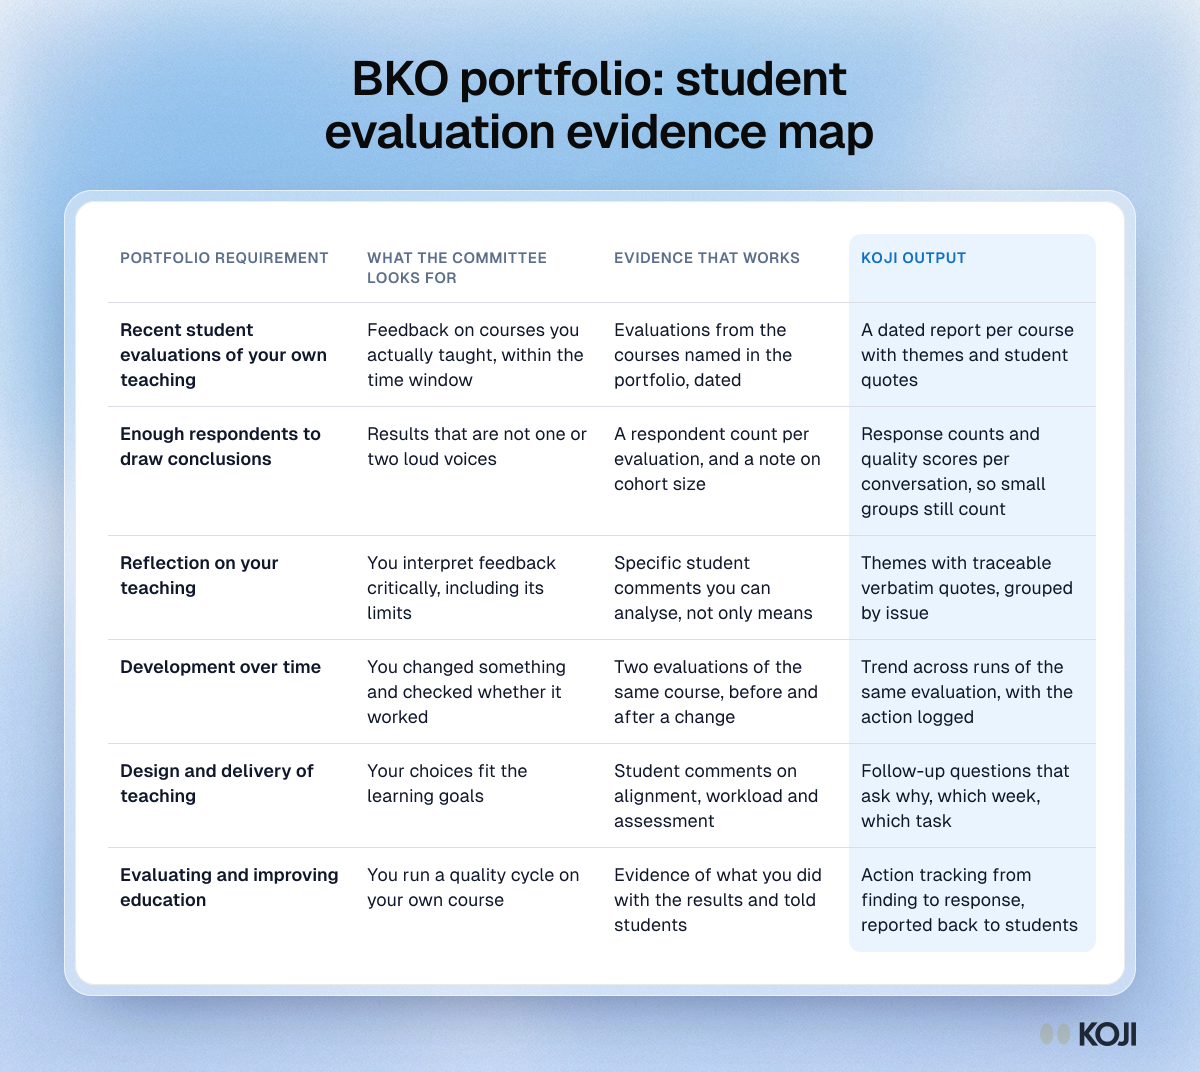
Table mapping BKO portfolio requirements to what the assessment committee looks for and the evaluation evidence and Koji output that supports each one.

Reference table

BKO portfolio: student evaluation evidence map
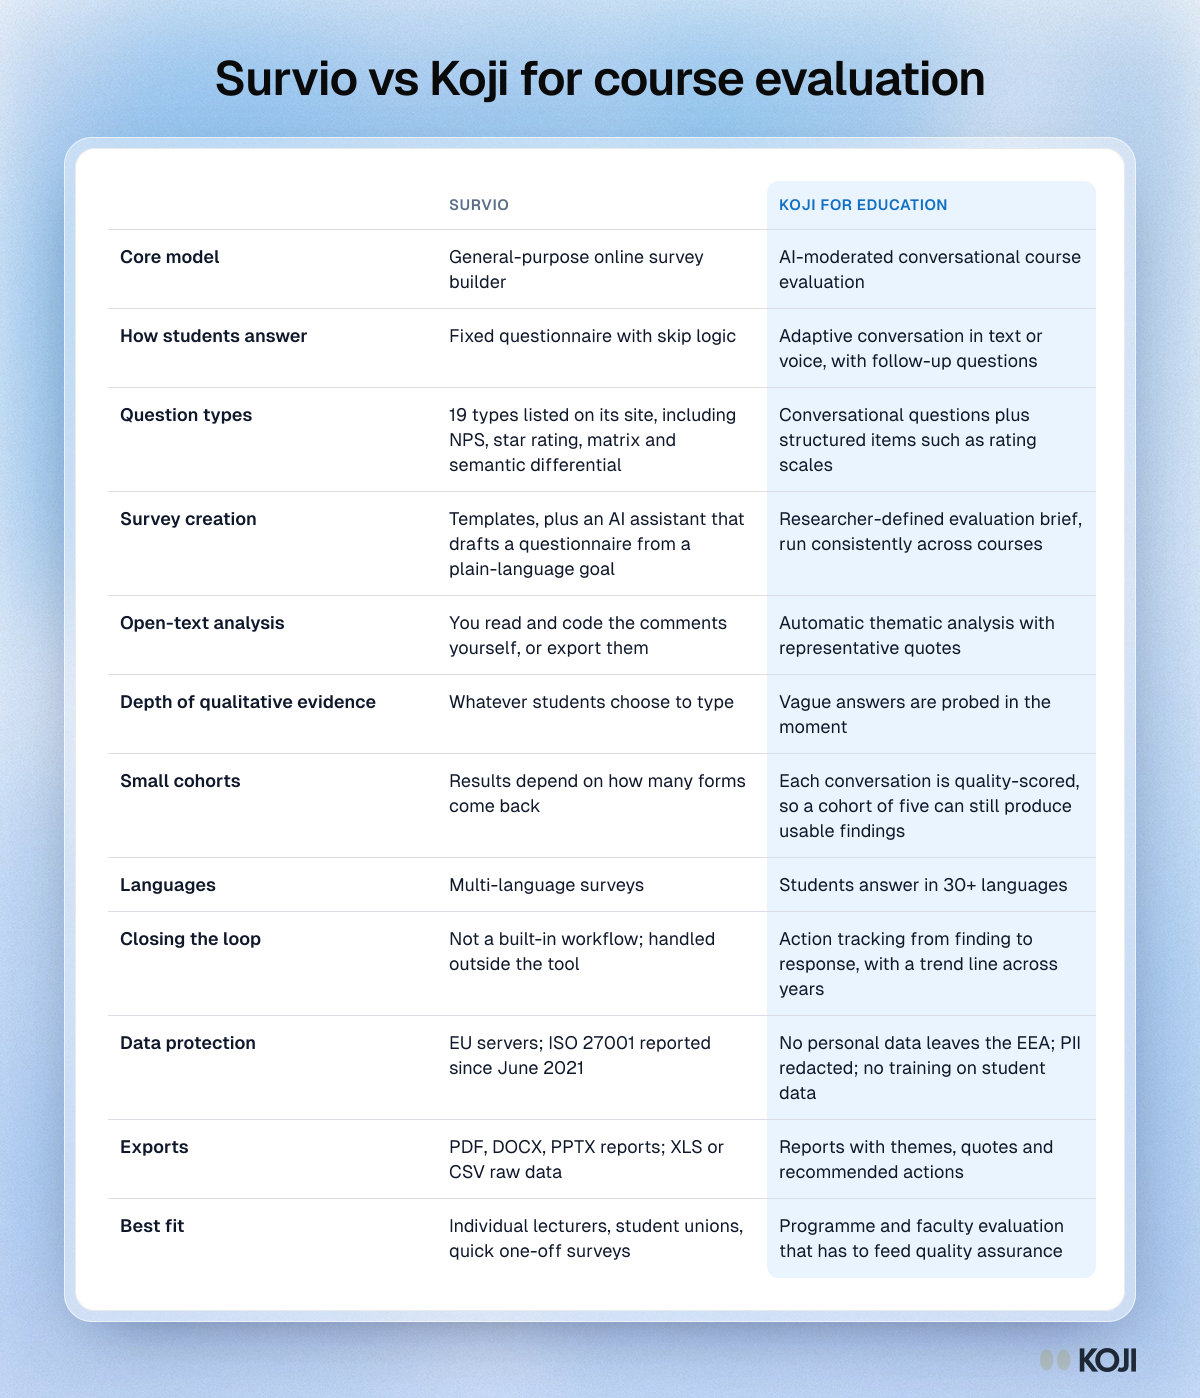
Comparison table of Survio and Koji for course evaluation across answer format, analysis, small cohorts, closing the loop and EU data handling.

Reference table

Survio vs Koji for course evaluation
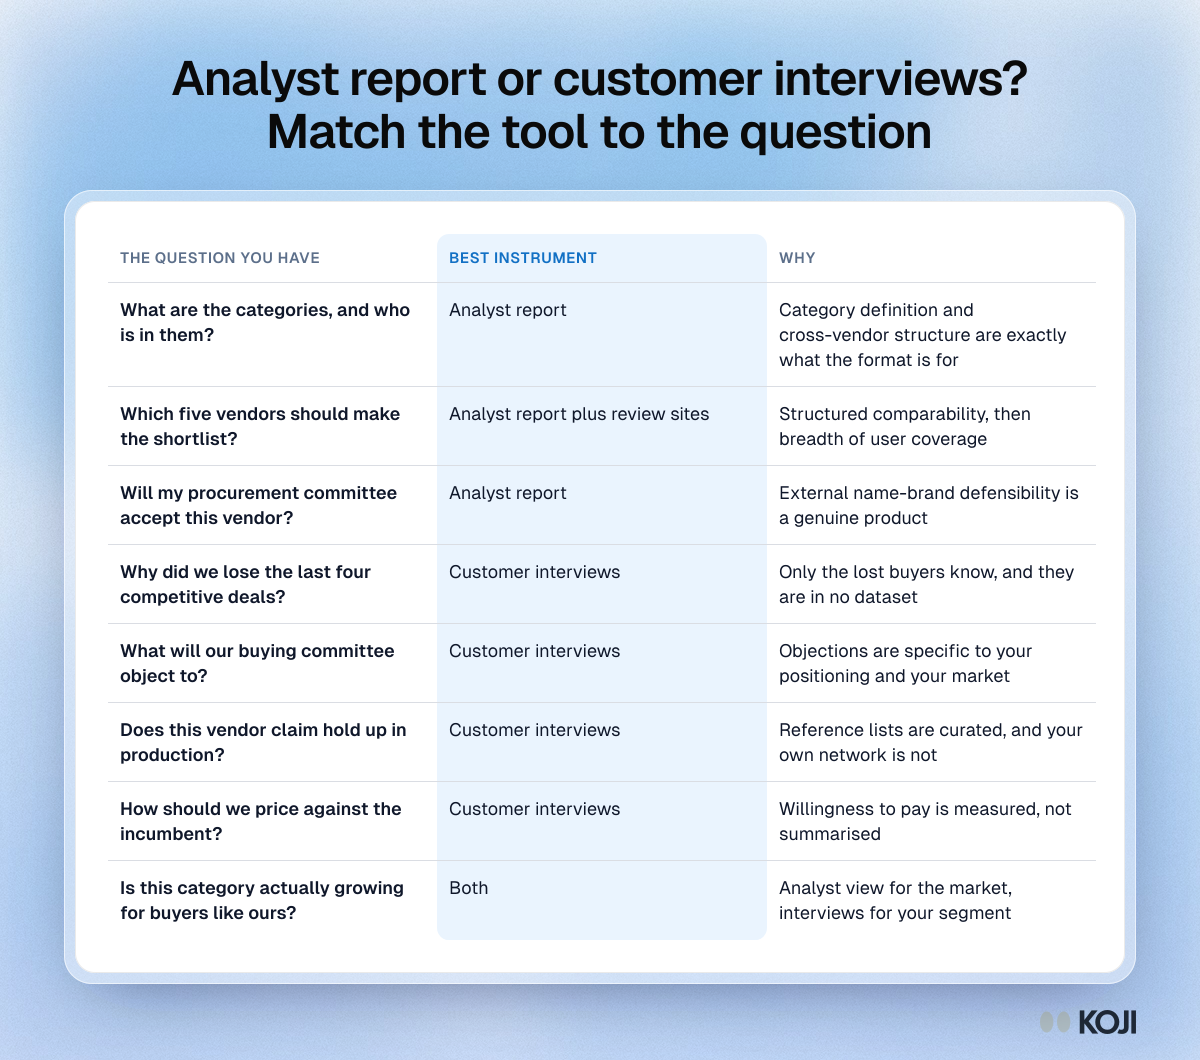
Table of eight B2B buying questions matched to an analyst report, customer interviews or both, from category structure to lost deals and pricing.

Reference table

Analyst report or customer interviews? Match the tool to the question
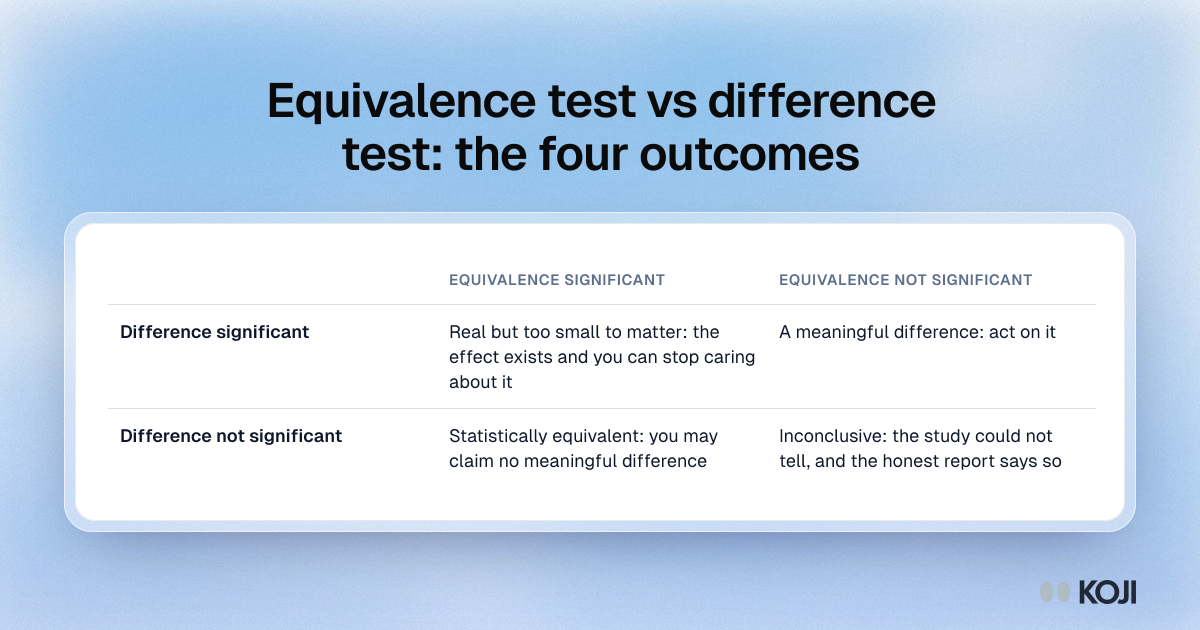
Two by two table of results from a difference test and an equivalence test: too small to matter, a meaningful difference, equivalent, or inconclusive.

Reference table

Equivalence test vs difference test: the four outcomes
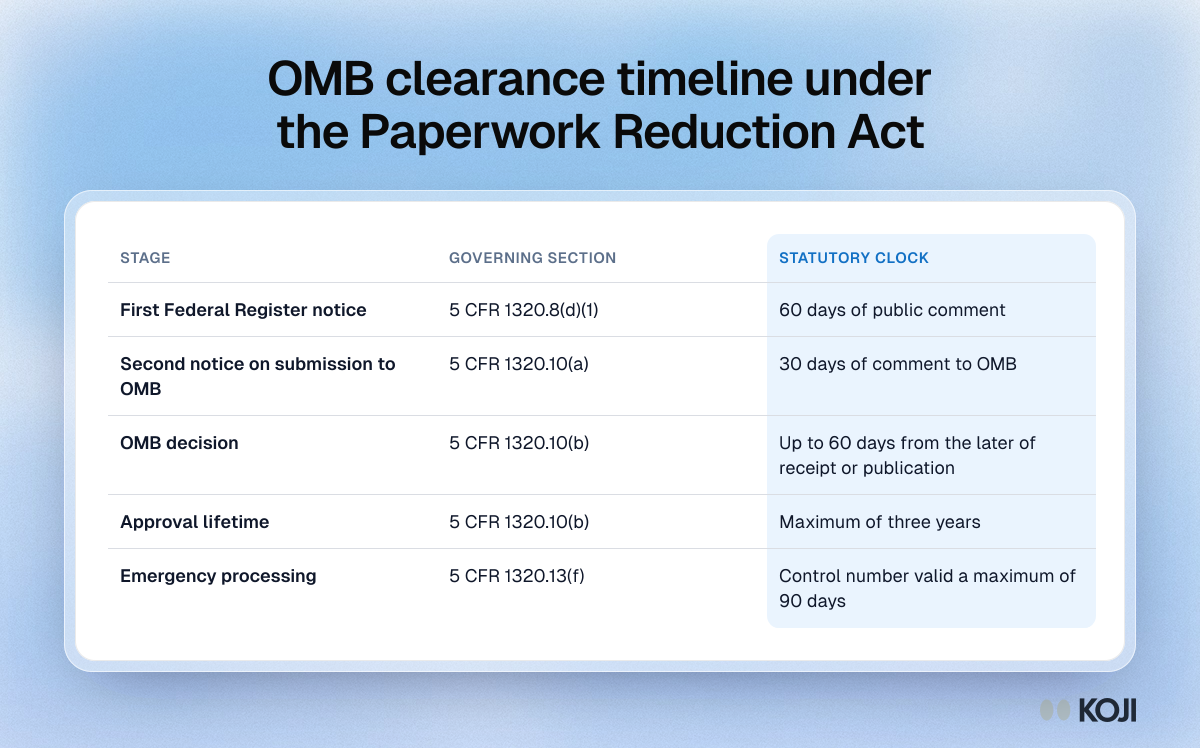
Table of the OMB clearance stages under the Paperwork Reduction Act: a 60-day notice, a 30-day notice, up to 60 days for OMB and a three-year approval limit.

Reference table

OMB clearance timeline under the Paperwork Reduction Act
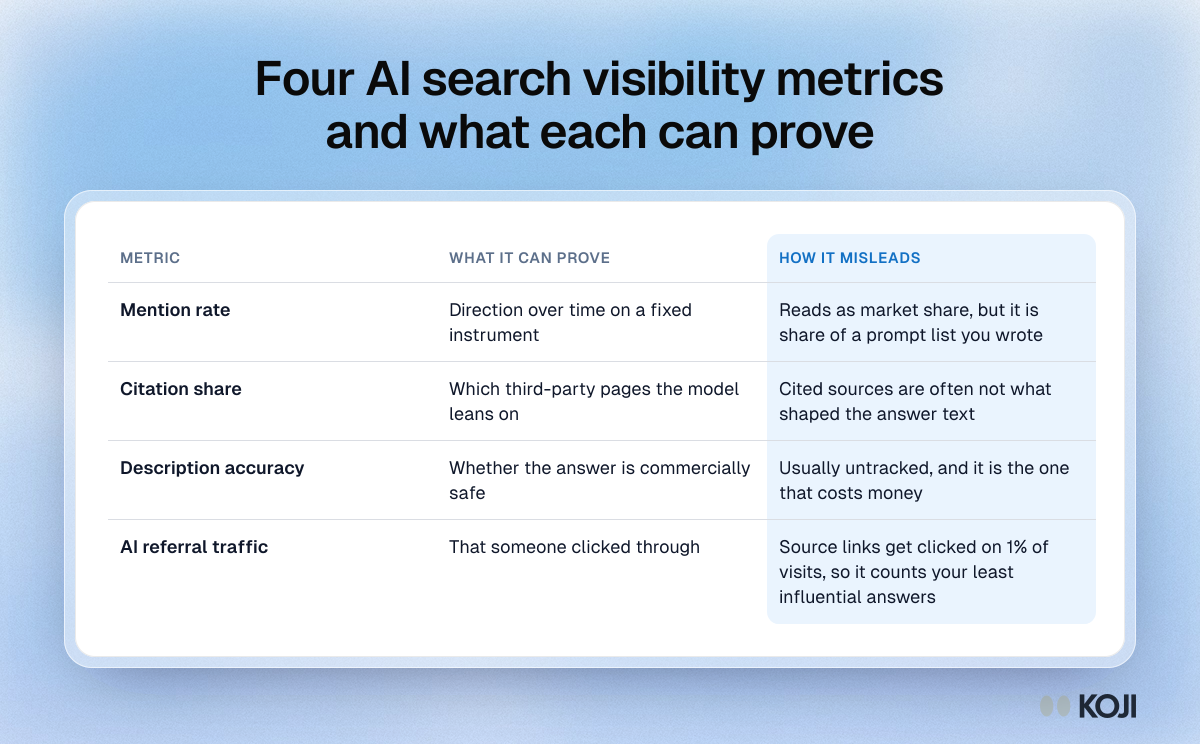
Table of four AI search visibility metrics: mention rate, citation share, description accuracy and AI referral traffic, with what each proves and hides.

Reference table

Four AI search visibility metrics and what each can prove
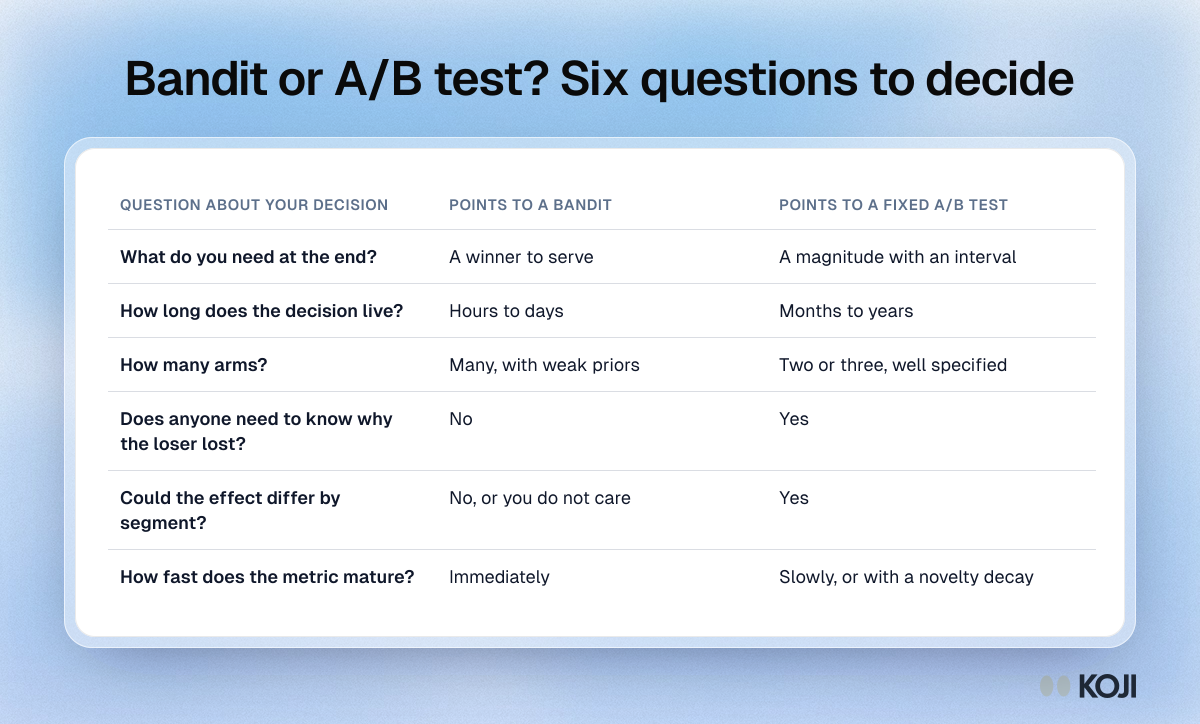
Decision table with six questions for choosing a multi-armed bandit or a fixed A/B test, such as what you need at the end and how long the decision lives.

Reference table

Bandit or A/B test? Six questions to decide
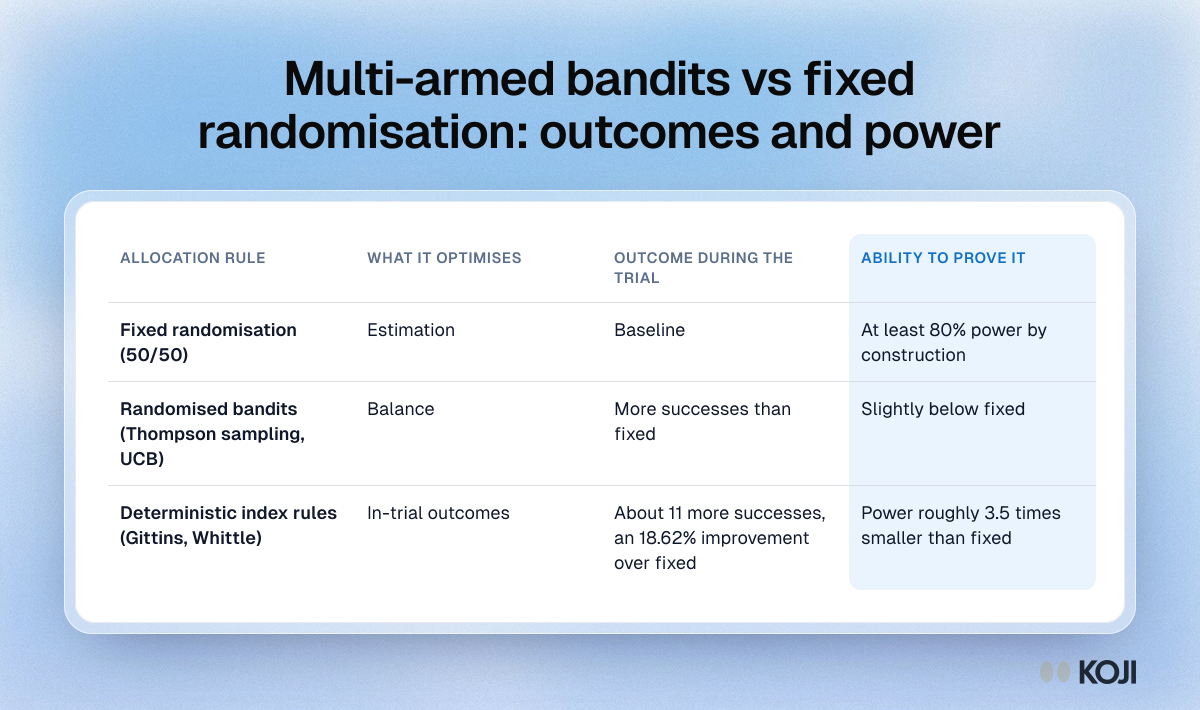
Table comparing allocation rules: fixed 50/50 keeps 80% power, while Gittins and Whittle bandits gain about 11 successes with power 3.5 times smaller.

Reference table

Multi-armed bandits vs fixed randomisation: outcomes and power
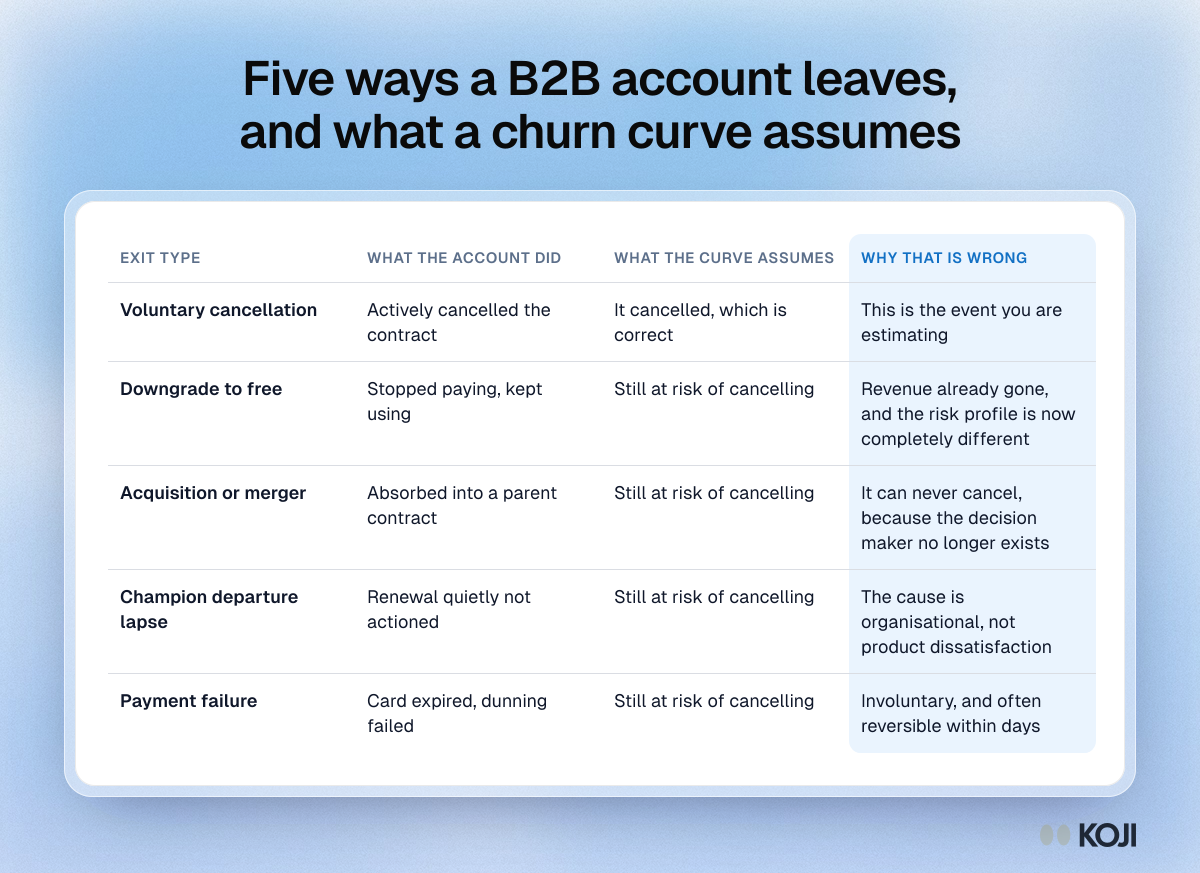
Table of five B2B churn exit types: cancellation, downgrade, acquisition, champion lapse and payment failure, with what a standard retention curve assumes.

Reference table

Five ways a B2B account leaves, and what a churn curve assumes
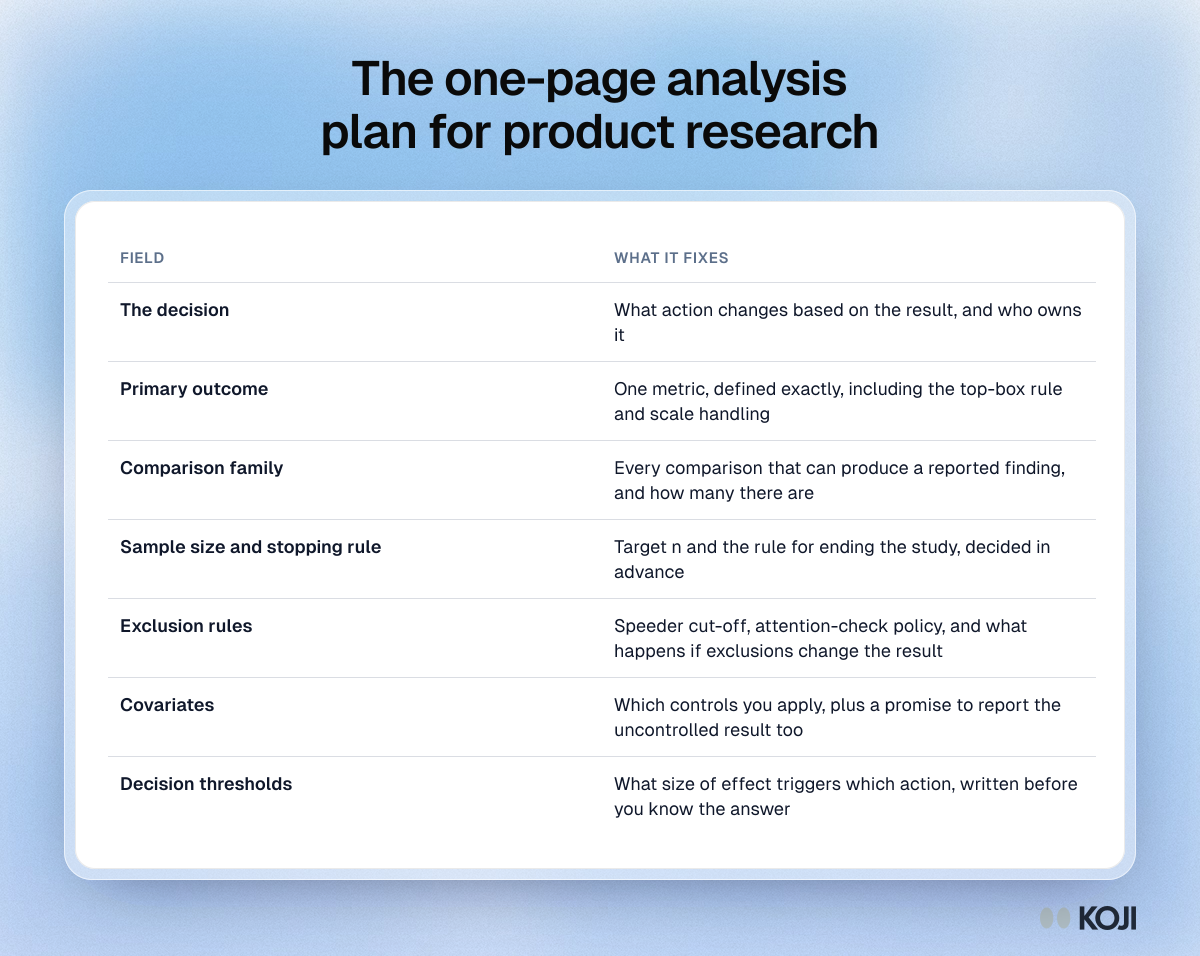
Table of a one-page analysis plan with seven fields: decision, primary outcome, comparison family, stopping rule, exclusions, covariates and thresholds.

Reference table

The one-page analysis plan for product research
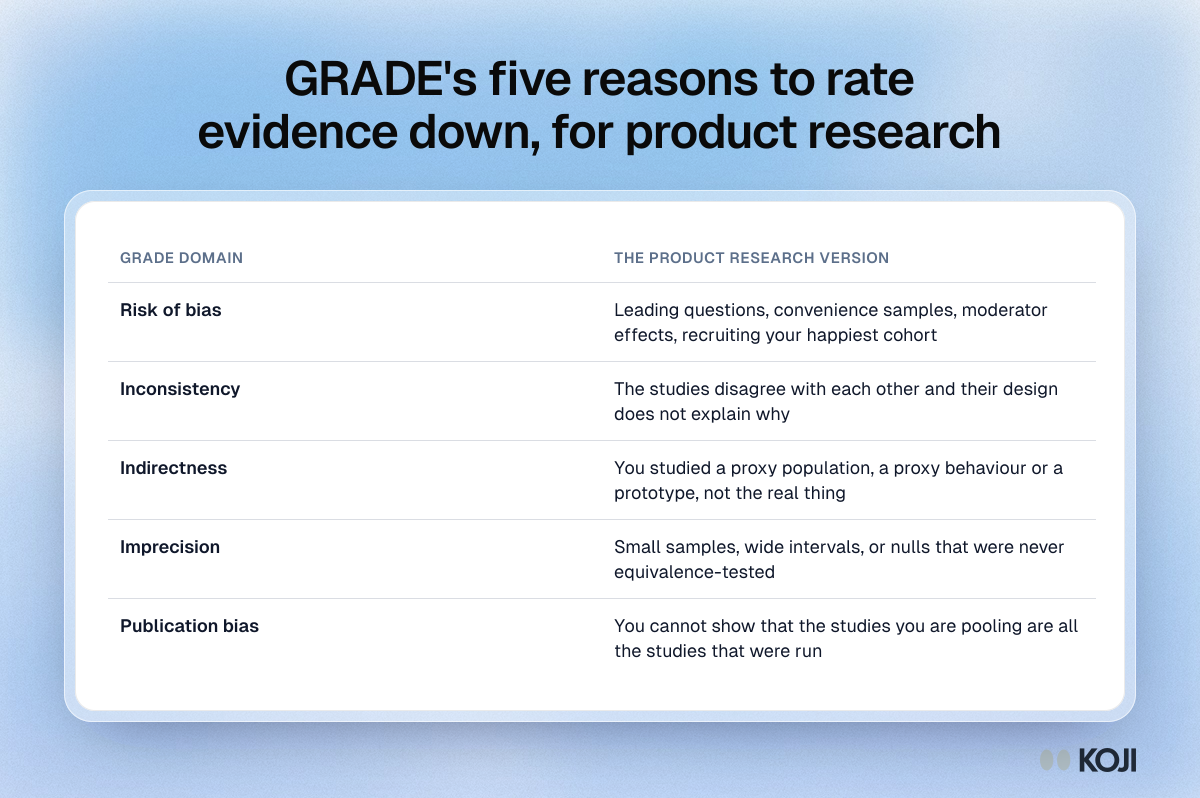
Table of the five GRADE downgrade domains (risk of bias, inconsistency, indirectness, imprecision, publication bias) applied to product research.

Reference table

GRADE's five reasons to rate evidence down, for product research
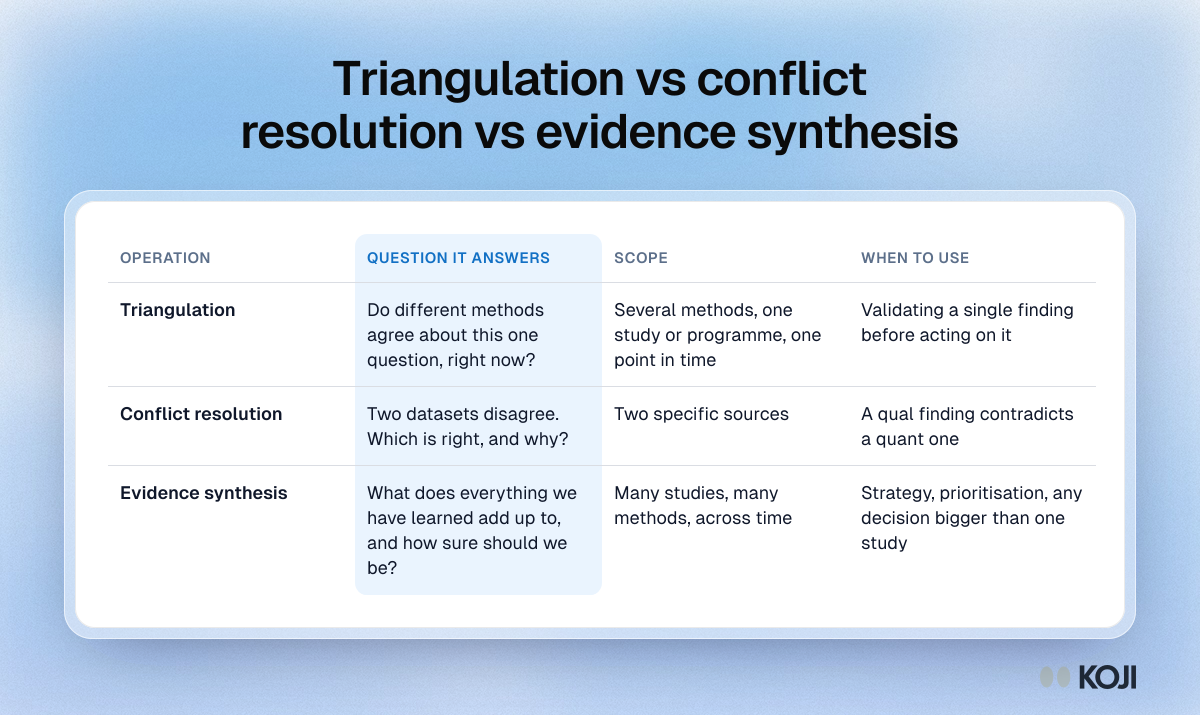
Table comparing triangulation, conflict resolution and evidence synthesis by the question each answers, its scope and when to use it.

Reference table

Triangulation vs conflict resolution vs evidence synthesis
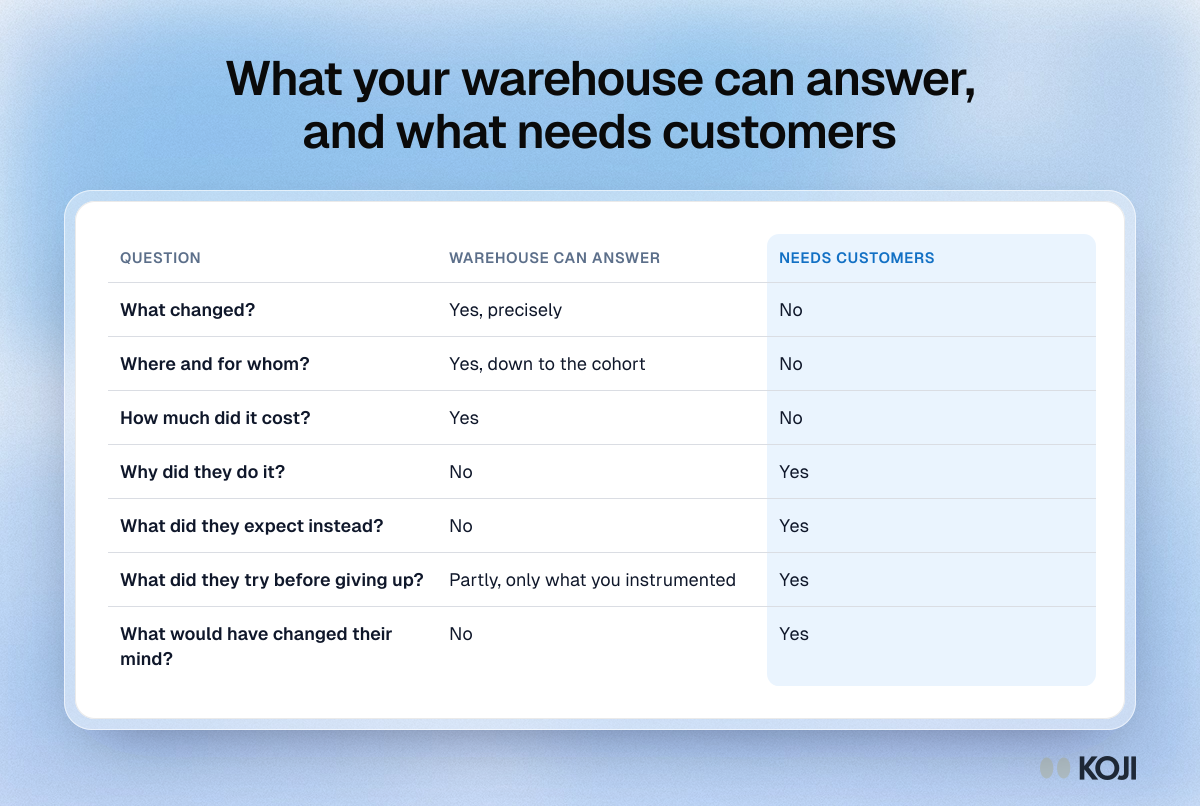
Table of seven questions about a metric change, showing the warehouse answers what, where and how much, while why needs customers.

Reference table

What your warehouse can answer, and what needs customers
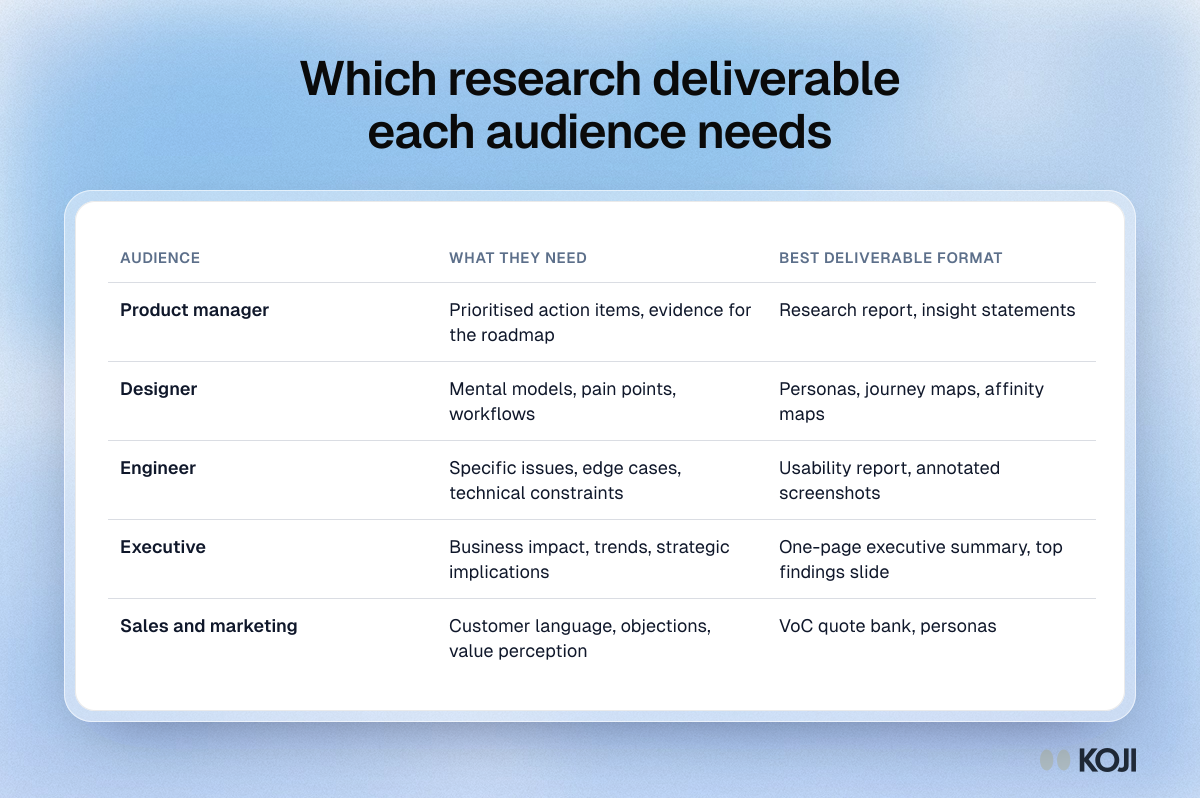
Table matching five audiences, from product managers to executives and sales, with what they need and the best research deliverable.

Reference table

Which research deliverable each audience needs
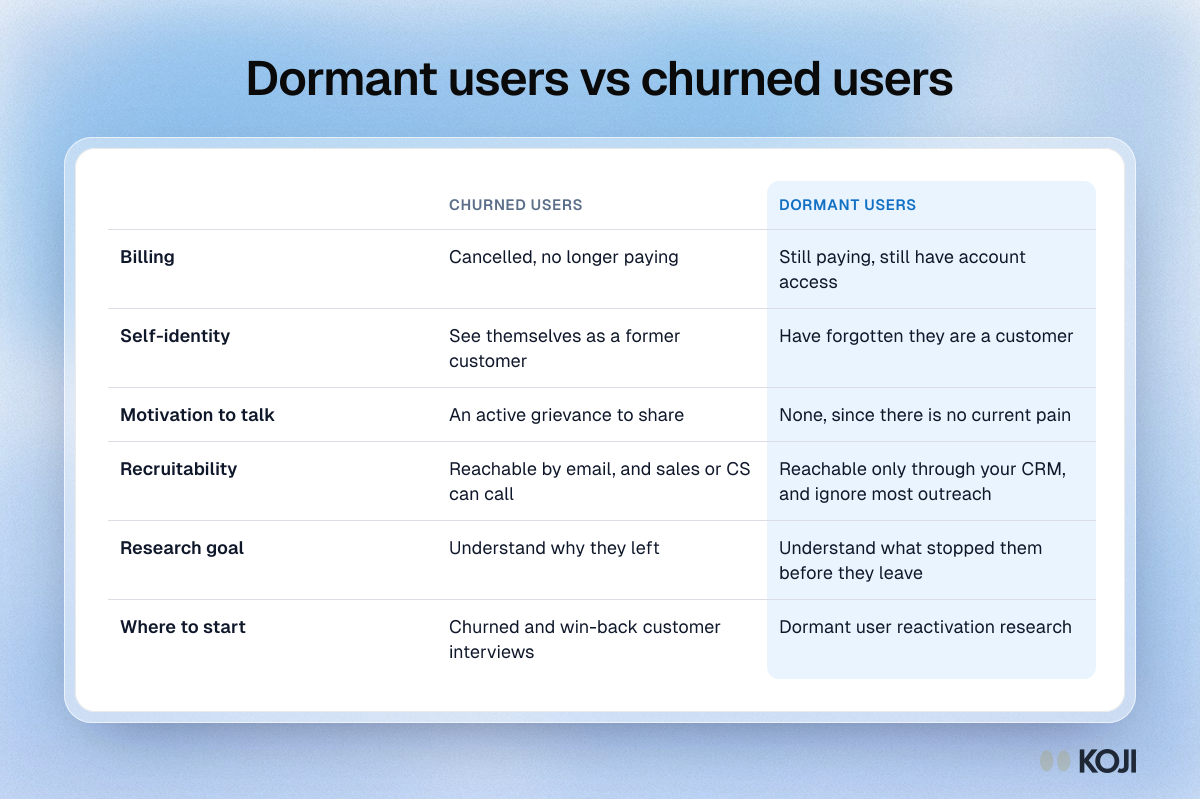
Table comparing churned and dormant users by billing, self-identity, motivation to talk, recruitability and research goal.

Reference table

Dormant users vs churned users
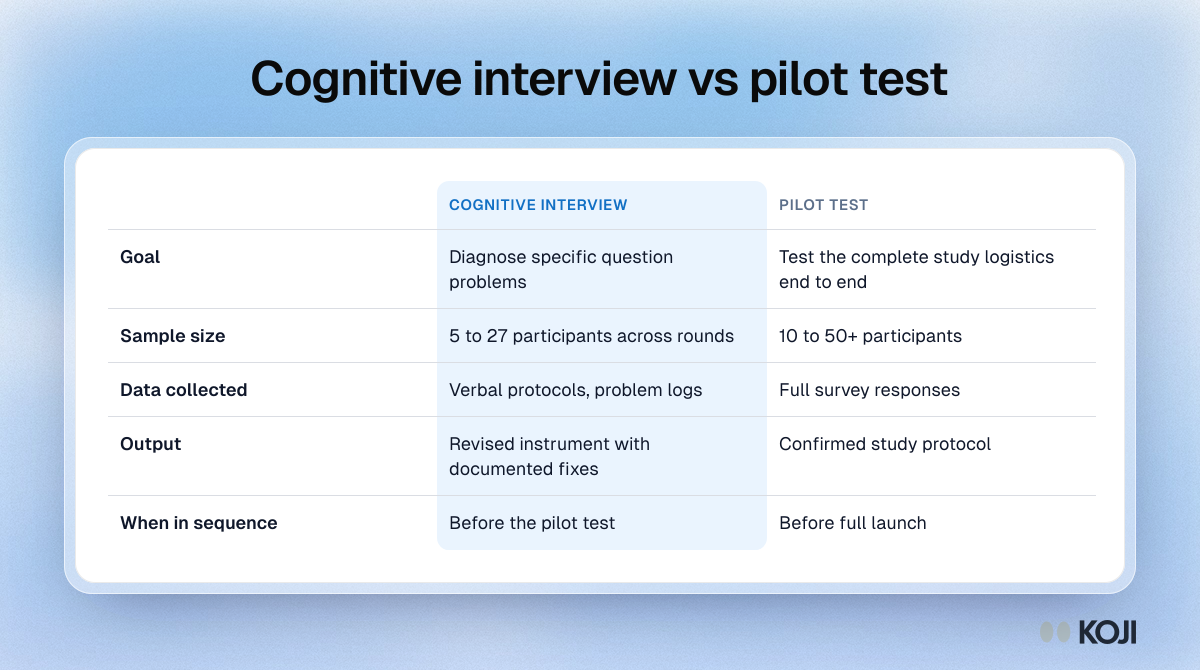
Table comparing cognitive interviews and pilot tests by goal, sample size, data collected, output and when each one runs.

Reference table

Cognitive interview vs pilot test
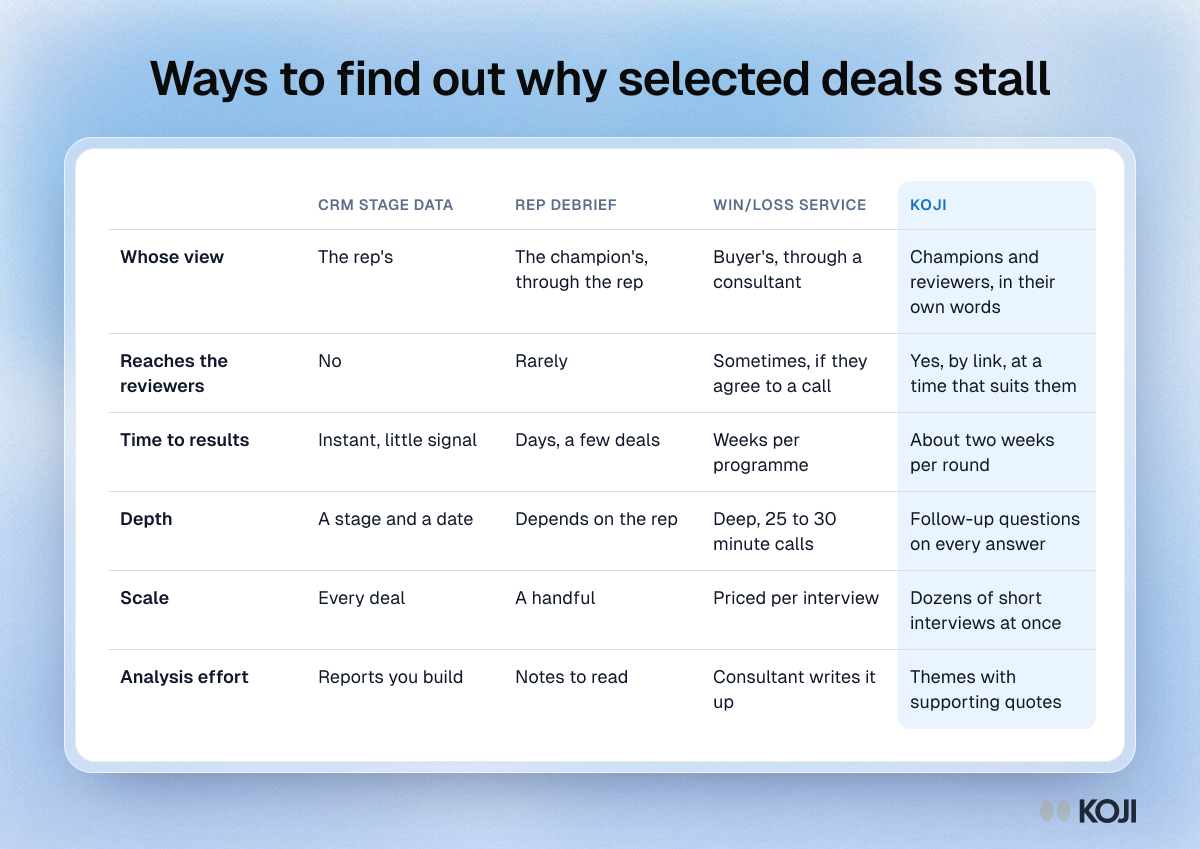
Table comparing CRM stage data, rep debriefs, win/loss interview services and Koji for finding out why selected deals stall in review.

Reference table

Ways to find out why selected deals stall
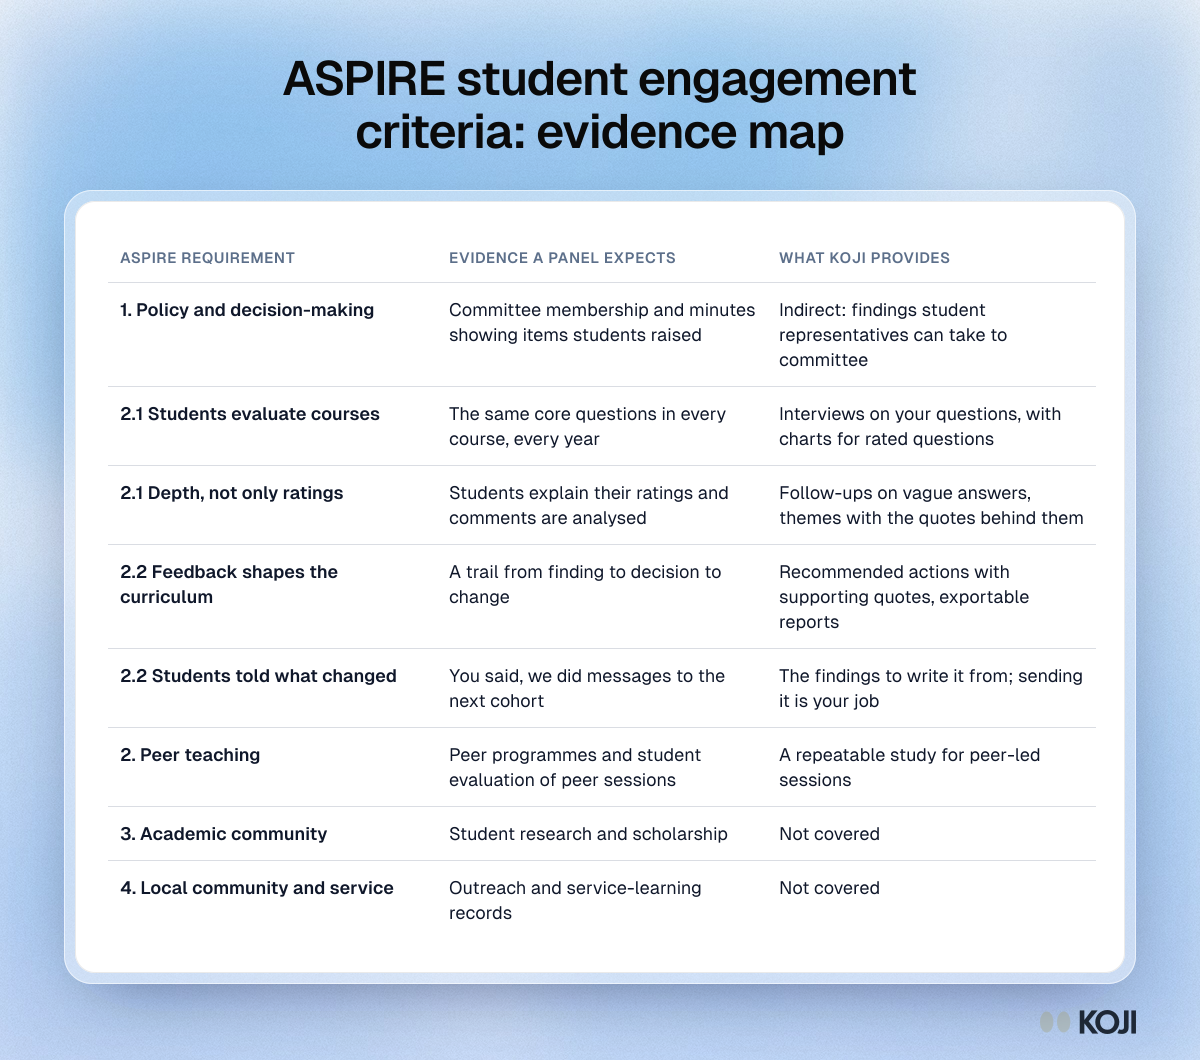
Table mapping the ASPIRE student engagement criteria to the evidence a panel expects and the course evaluation outputs that support each one.

Reference table

ASPIRE student engagement criteria: evidence map
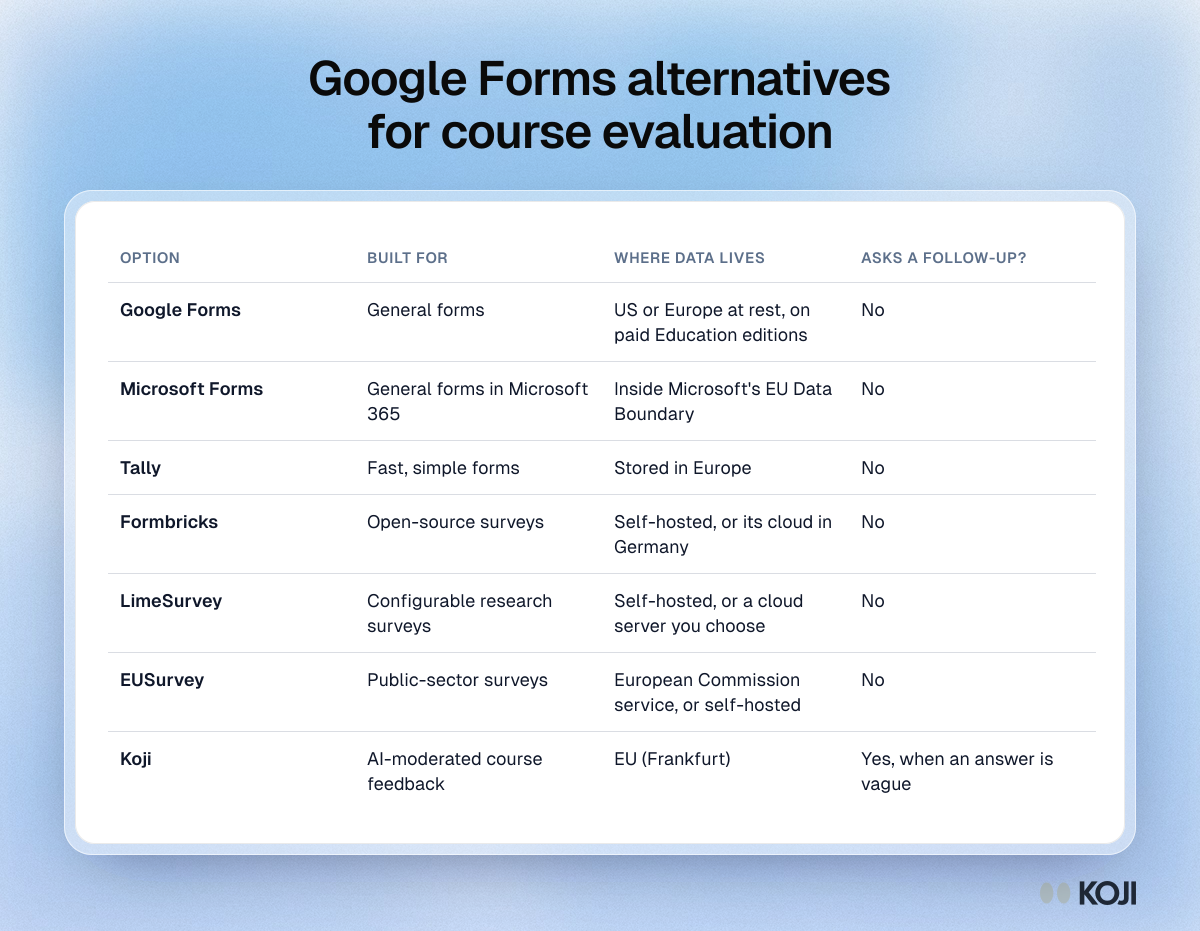
Table comparing six Google Forms alternatives for course evaluation, from Microsoft Forms and LimeSurvey to Koji, by purpose, data location and follow-ups.

Reference table

Google Forms alternatives for course evaluation
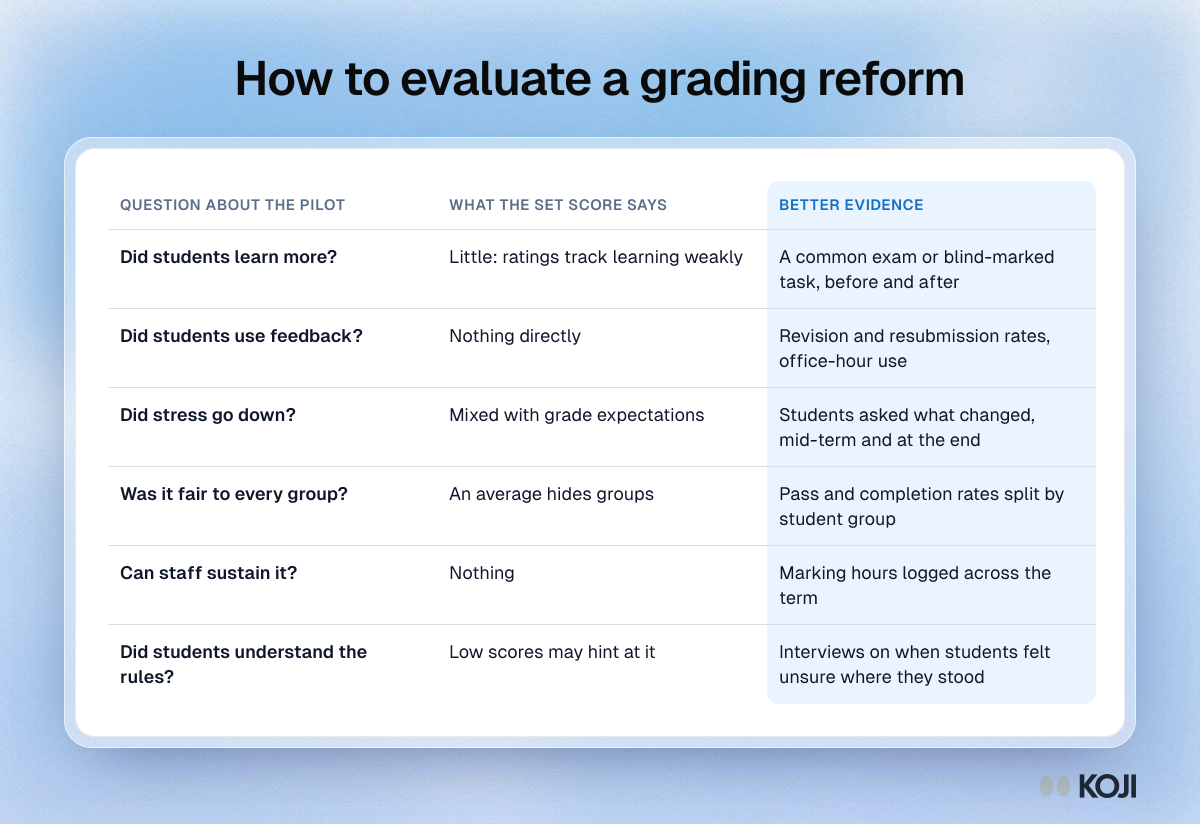
Table setting what a course evaluation score says about a grading reform against better evidence on learning, feedback use, stress, fairness and staff time.

Reference table

How to evaluate a grading reform
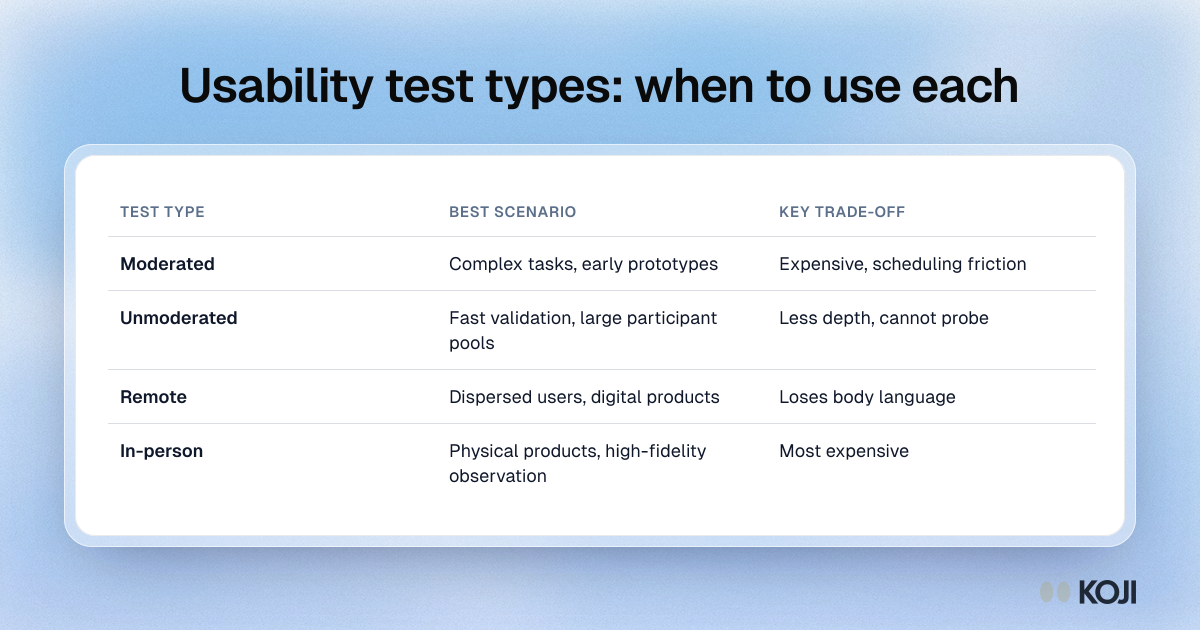
Table of four usability test types, moderated, unmoderated, remote and in-person, with the best scenario and main trade-off for each.

Reference table

Usability test types: when to use each
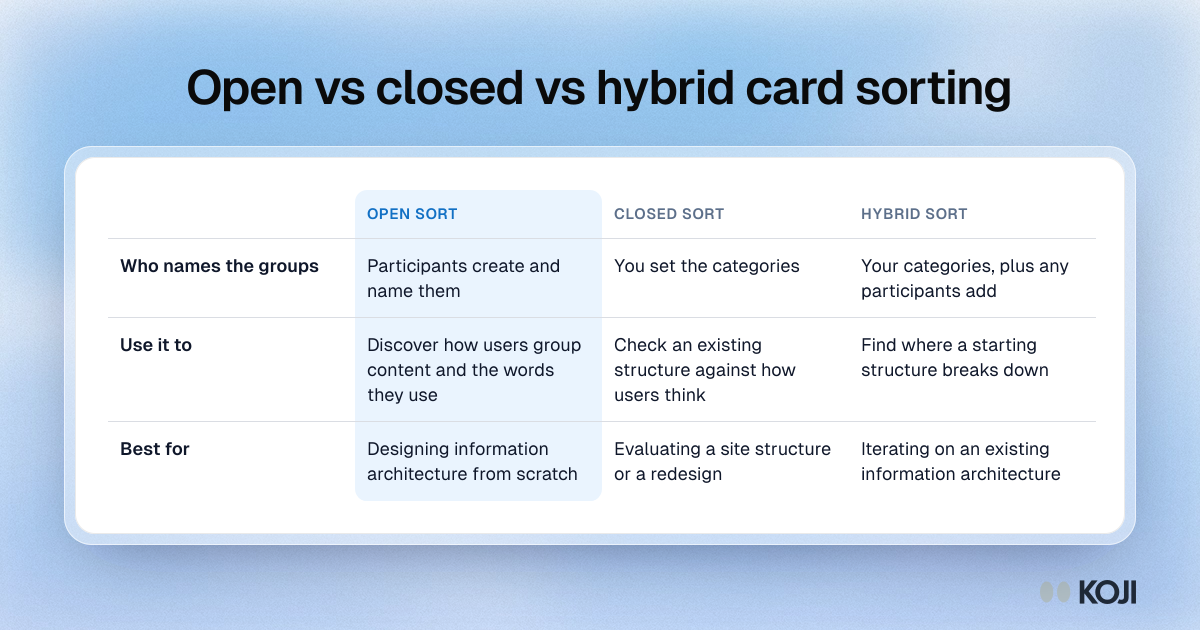
Table comparing open, closed and hybrid card sorting by who names the groups, what each is for and when to use it.

Reference table

Open vs closed vs hybrid card sorting
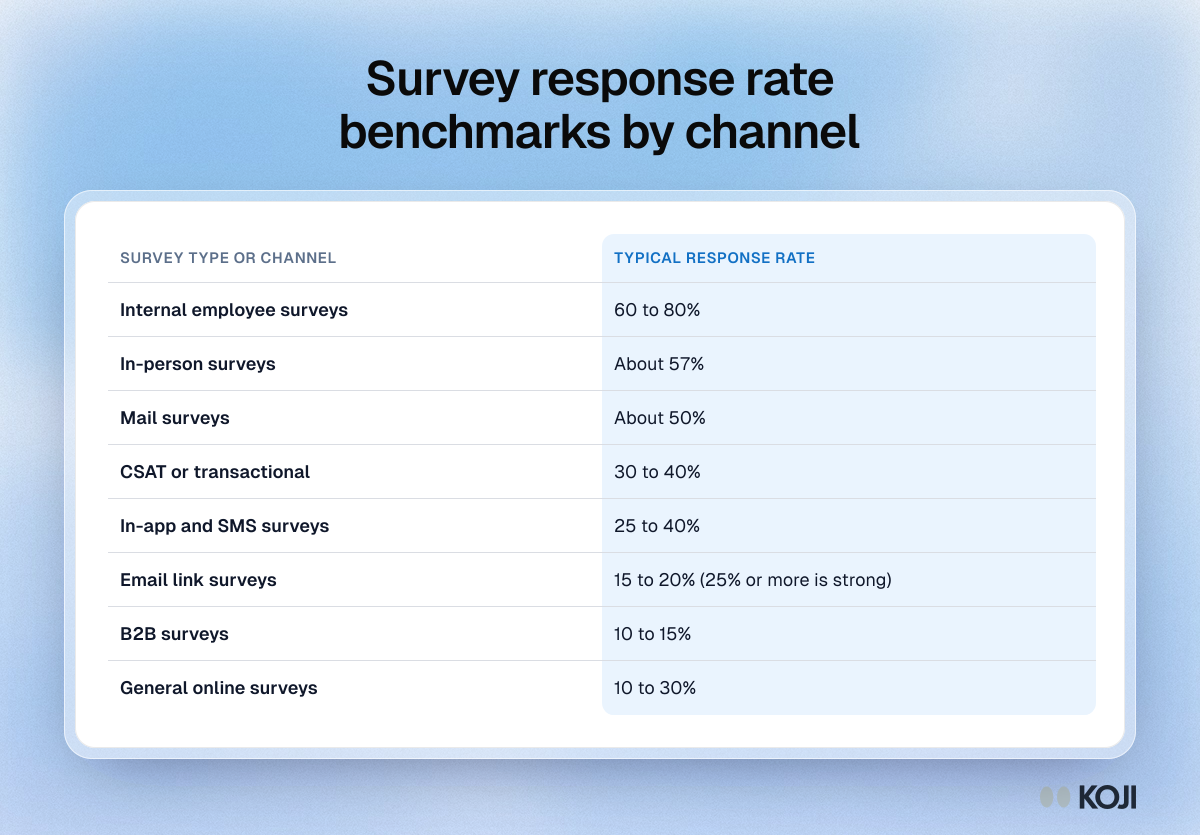
Table of typical survey response rates by channel, from 60 to 80% for employee surveys down to 10 to 15% for B2B surveys.

Reference table

Survey response rate benchmarks by channel
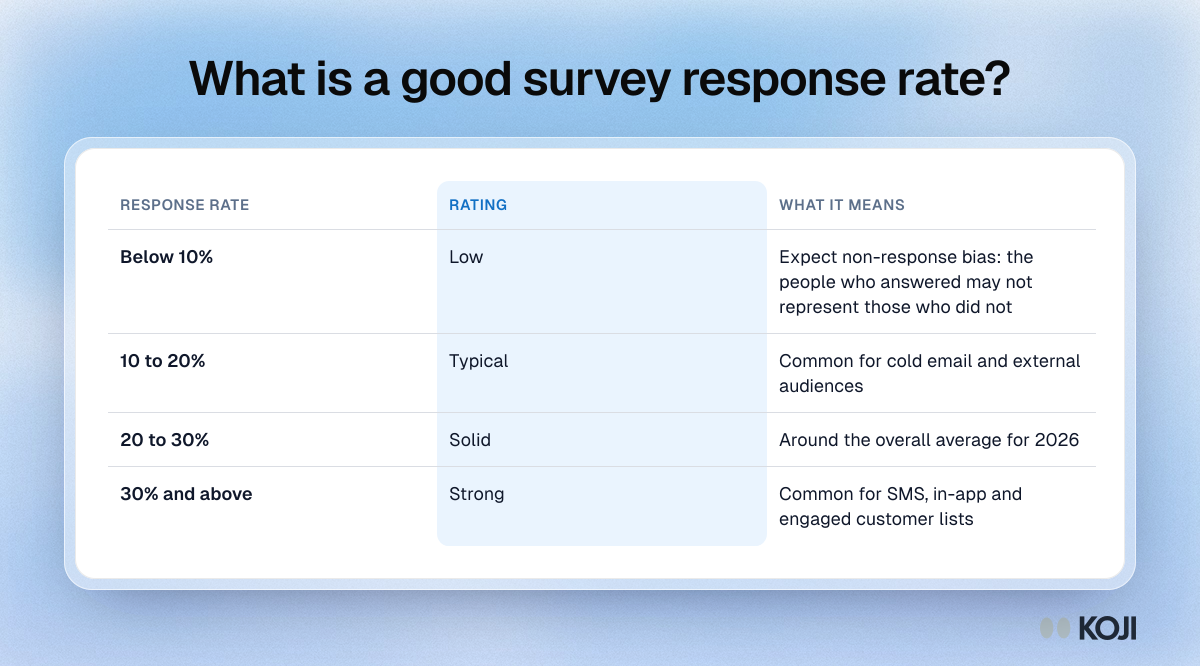
Table rating survey response rates: below 10% is low, 10 to 20% typical, 20 to 30% solid and 30% or more strong, with what each band means.

Reference table

What is a good survey response rate?
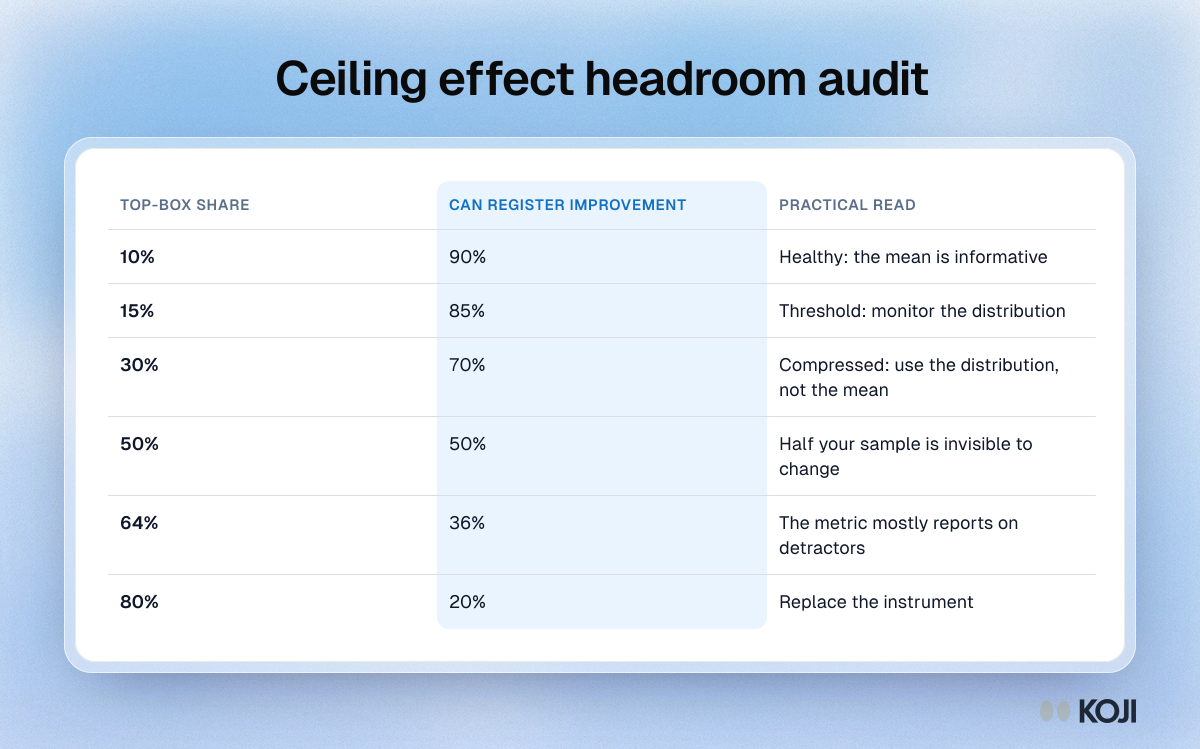
Table of top-box shares from 10% to 80% against the share of respondents who can still register improvement, with what each means.

Reference table

Ceiling effect headroom audit
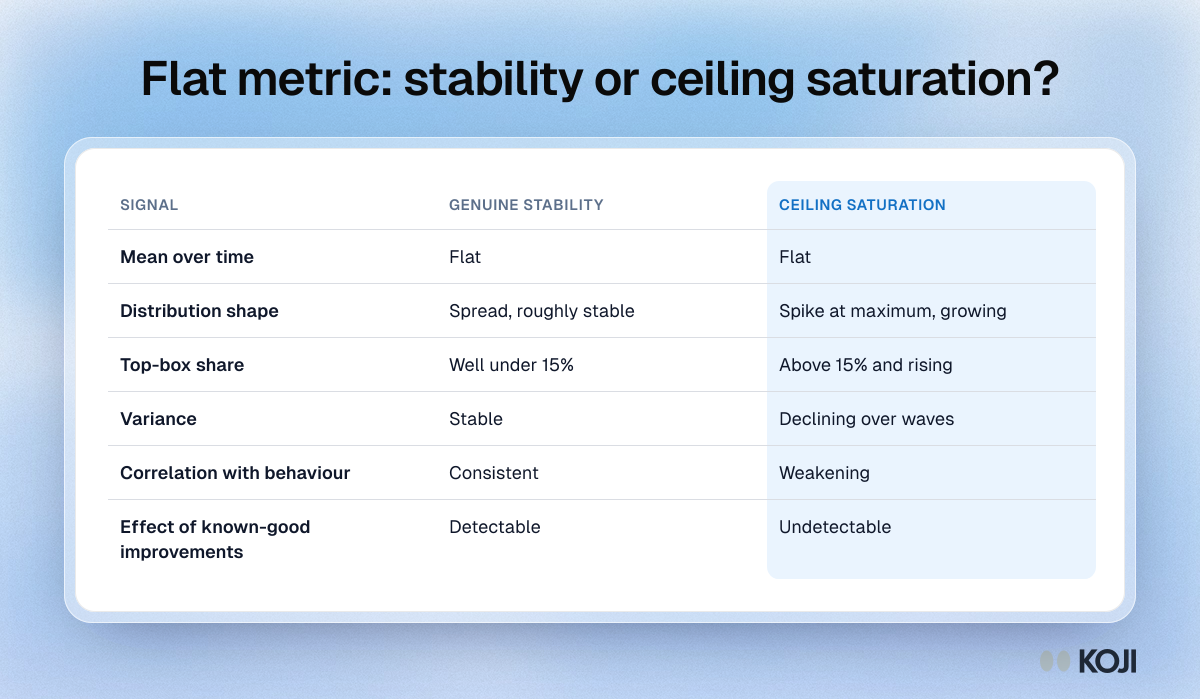
Table comparing six signals of genuine stability against ceiling saturation in a flat survey metric, from distribution shape to variance over waves.

Reference table

Flat metric: stability or ceiling saturation?
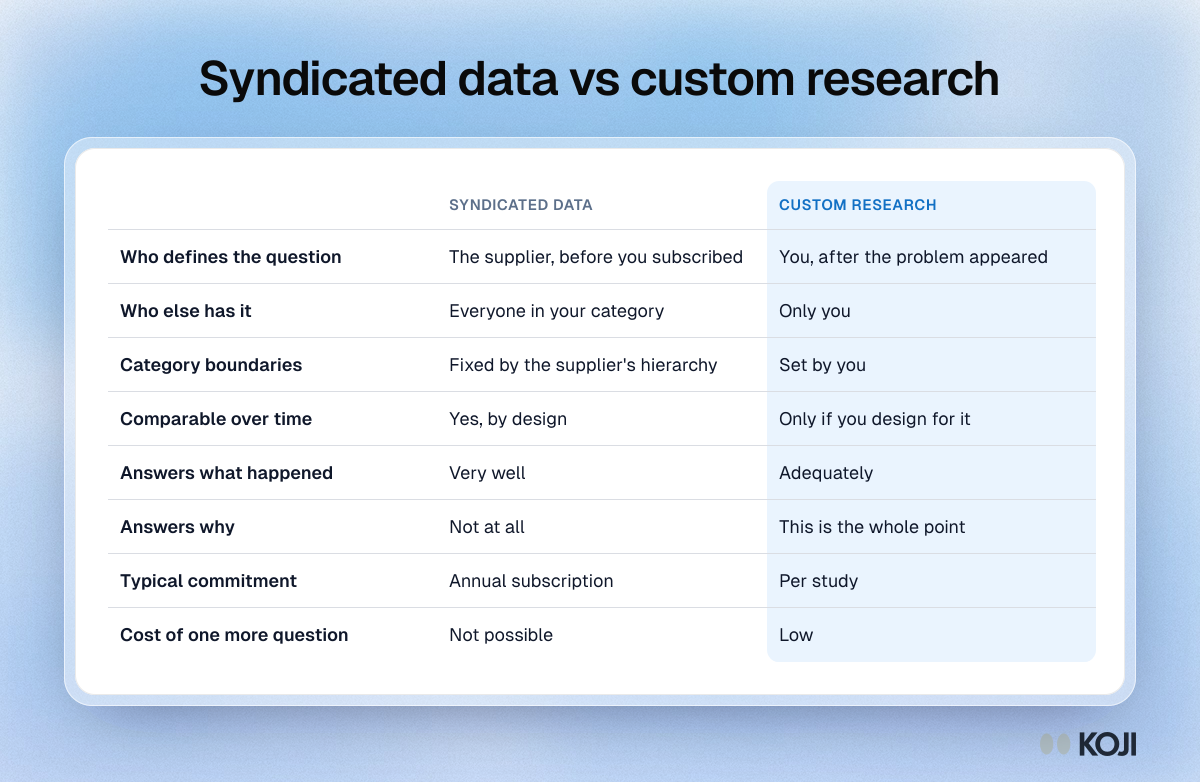
Table comparing syndicated data and custom research on eight points, including who defines the question, who else has it and whether it answers why.

Reference table

Syndicated data vs custom research
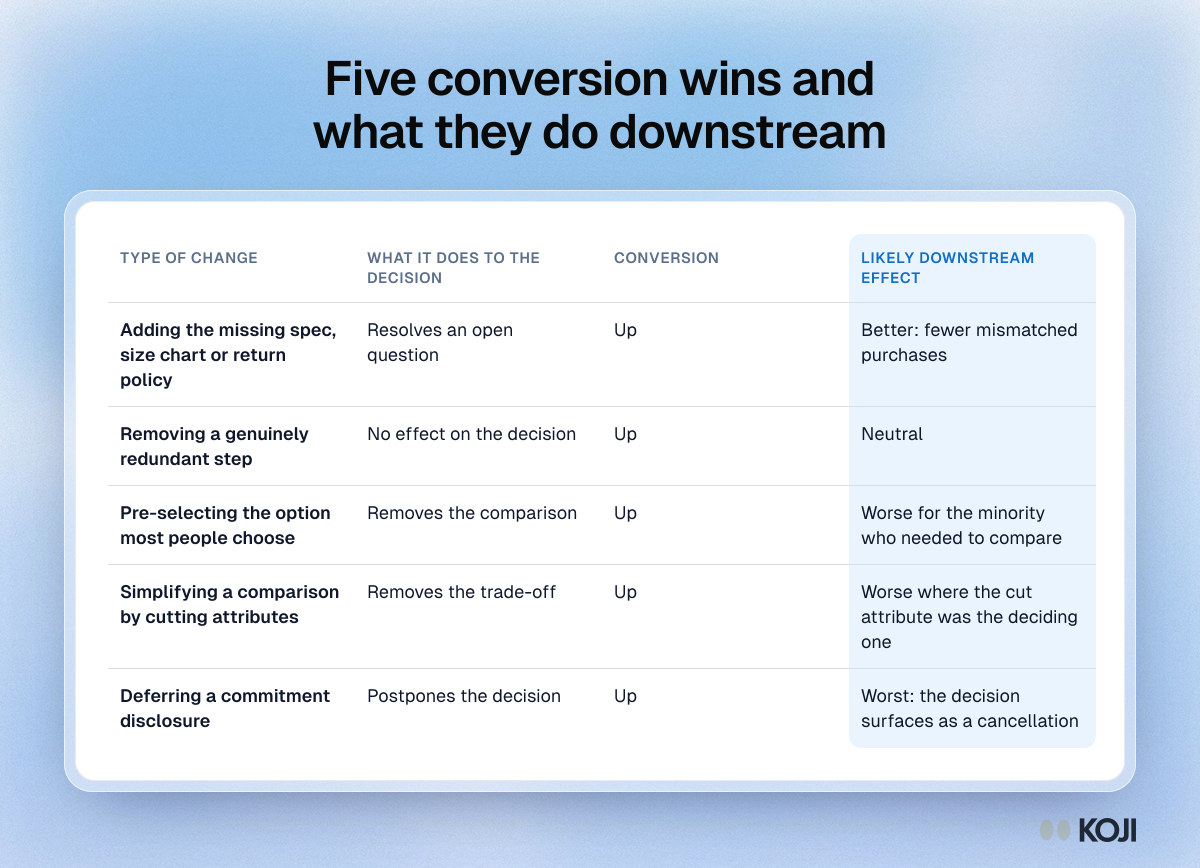
Table of five design changes that all raise conversion, from adding a missing spec to deferring a commitment disclosure, and their downstream effect.

Reference table

Five conversion wins and what they do downstream
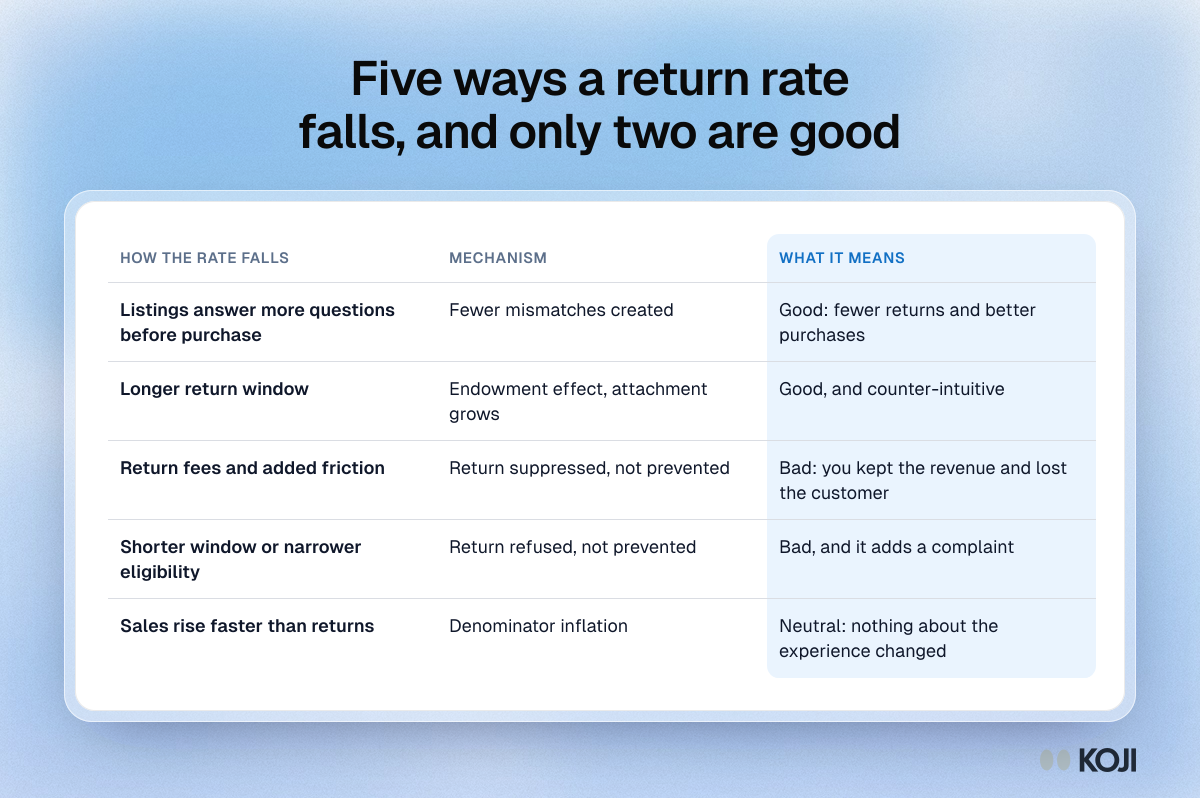
Table of five ways a retail return rate can fall, from better listings and longer windows to return fees, shorter windows and sales growth.

Reference table

Five ways a return rate falls, and only two are good
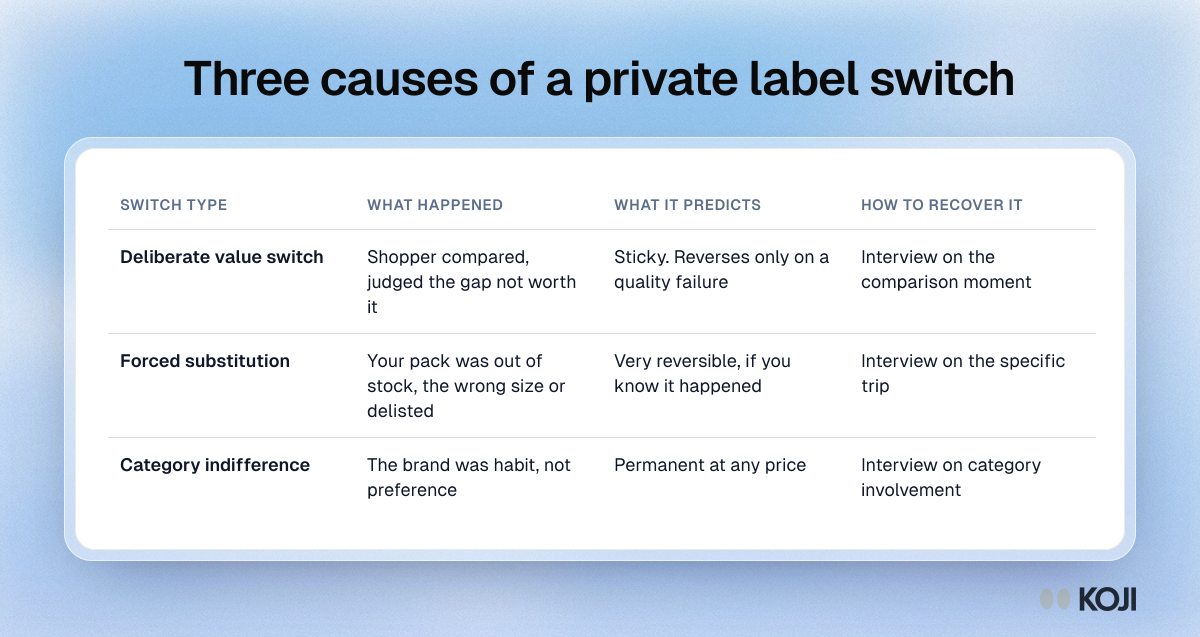
Table of three types of private label switch: deliberate value switch, forced substitution and category indifference, with what each predicts.

Reference table

Three causes of a private label switch
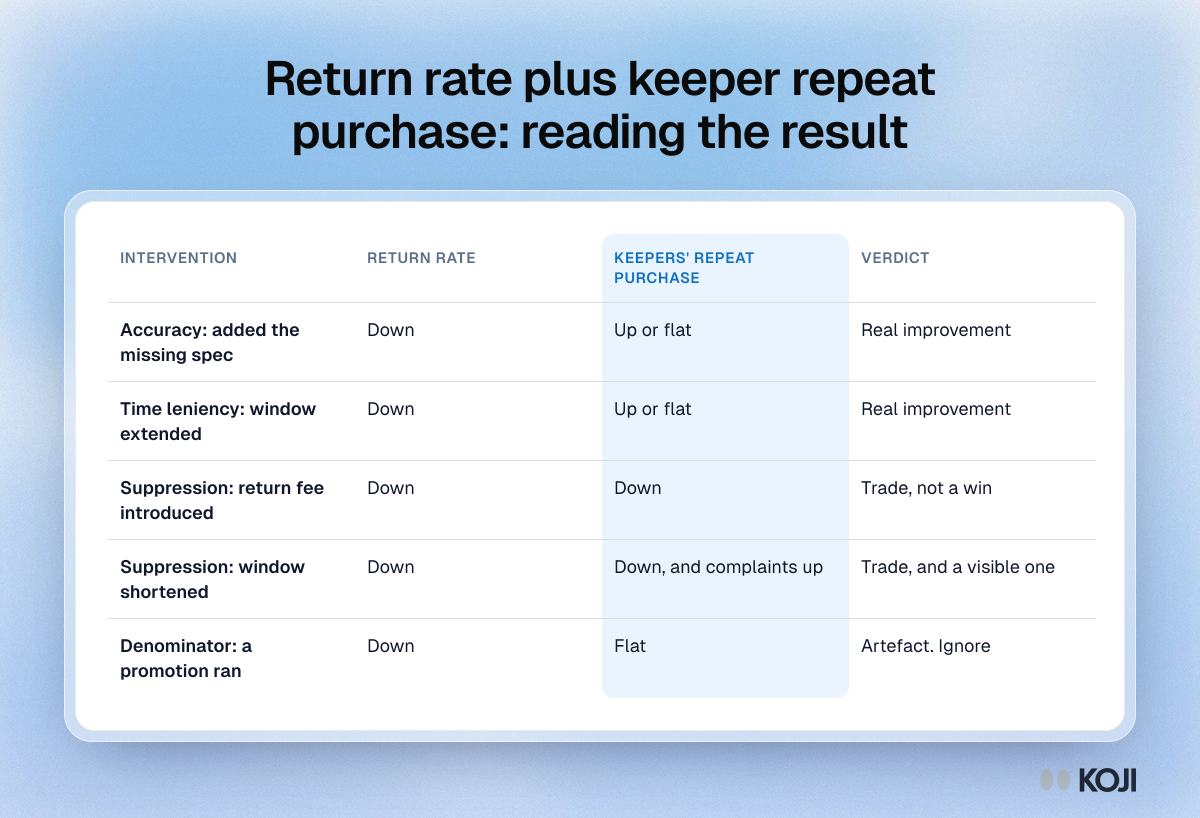
Table pairing return rate with the repeat purchase rate of customers who kept the item, showing which returns changes are real wins and which are suppression.

Reference table

Return rate plus keeper repeat purchase: reading the result
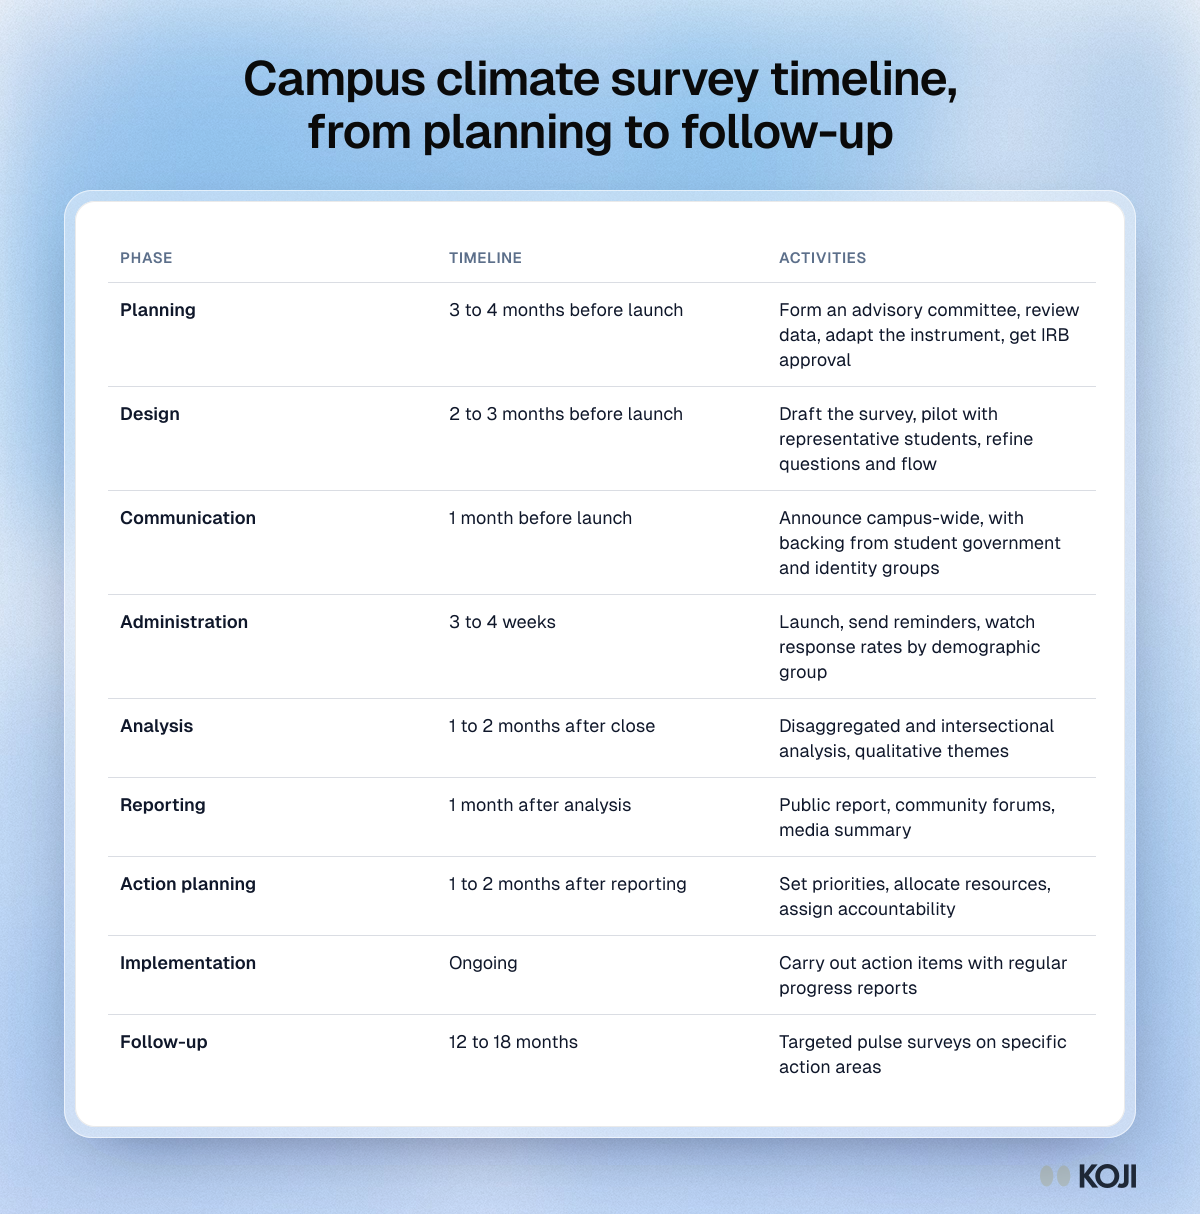
Table of the nine phases of a campus climate survey, from planning 3 to 4 months before launch to a follow-up pulse at 12 to 18 months.

Reference table

Campus climate survey timeline, from planning to follow-up
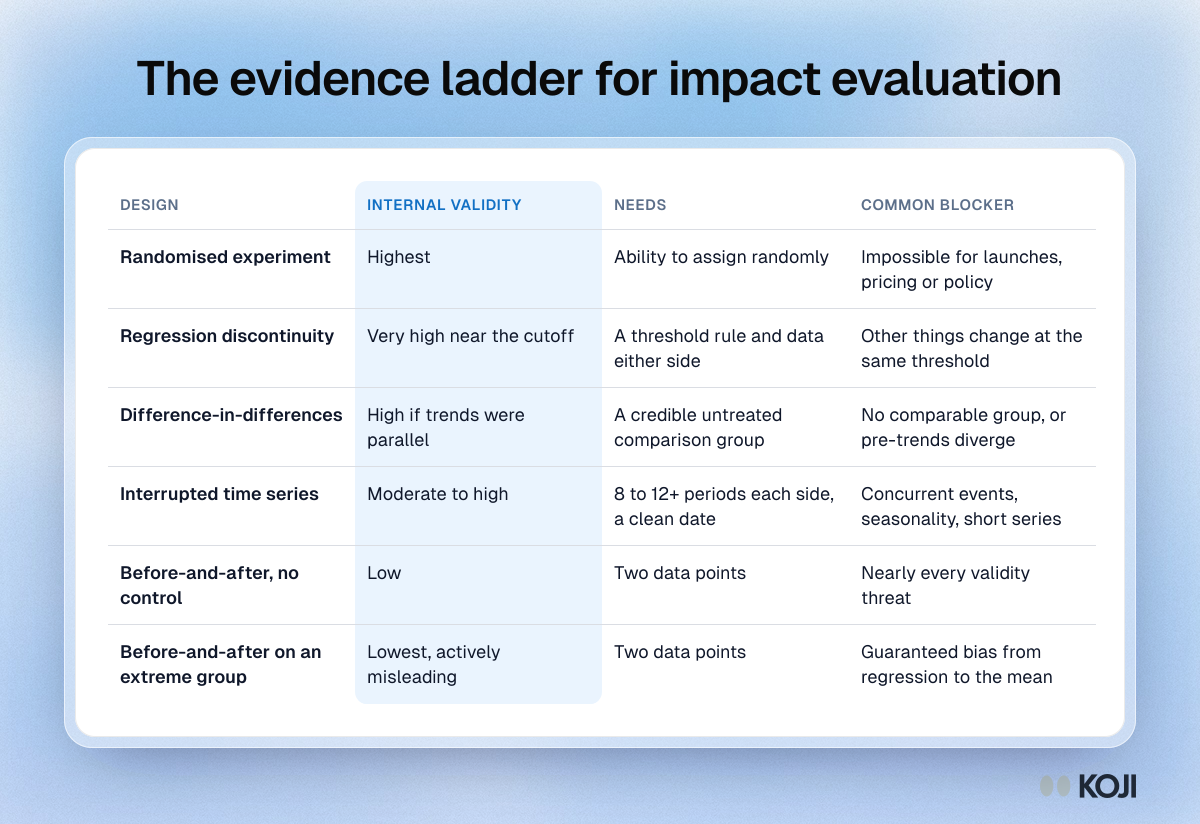
Table ranking six evaluation designs by internal validity, from randomised experiment down to before-and-after on an extreme group, with what each needs.

Reference table

The evidence ladder for impact evaluation
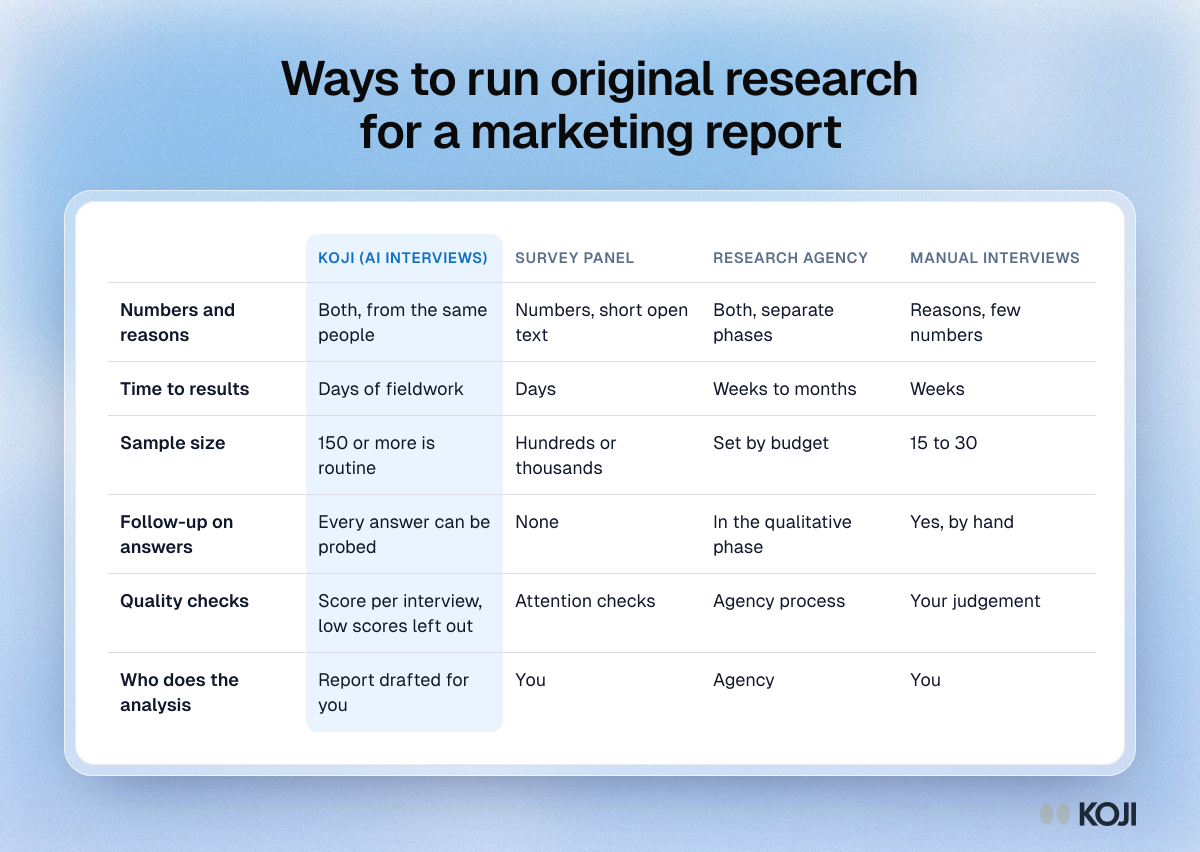
Table comparing Koji AI interviews, survey panels, research agencies and manual interviews on depth, speed, sample size, follow-up, quality and analysis.

Reference table

Ways to run original research for a marketing report
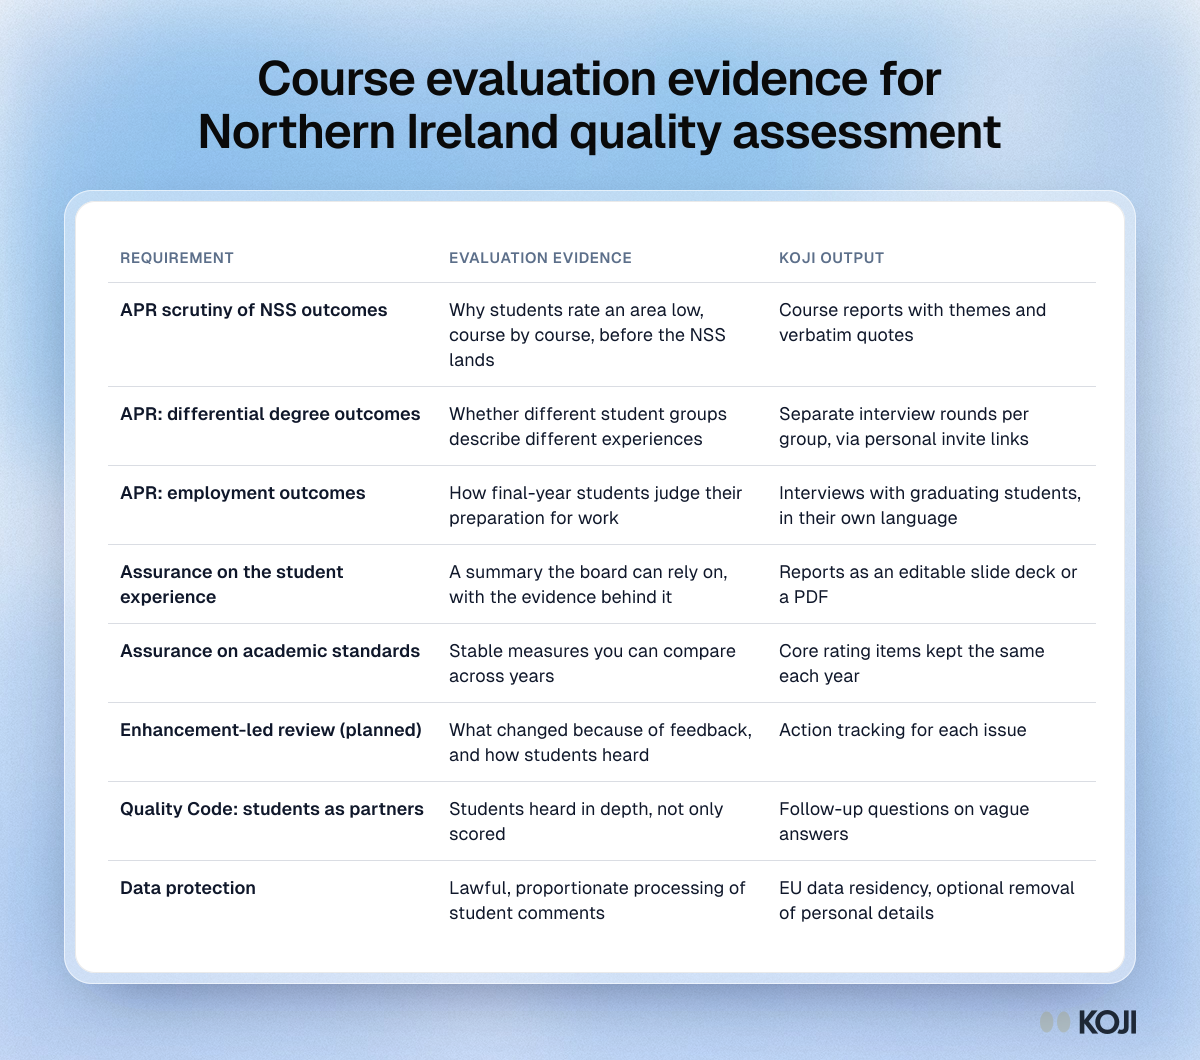
Table mapping Northern Ireland quality requirements, from NSS scrutiny to enhancement-led review, to course evaluation evidence and Koji outputs

Reference table

Course evaluation evidence for Northern Ireland quality assessment
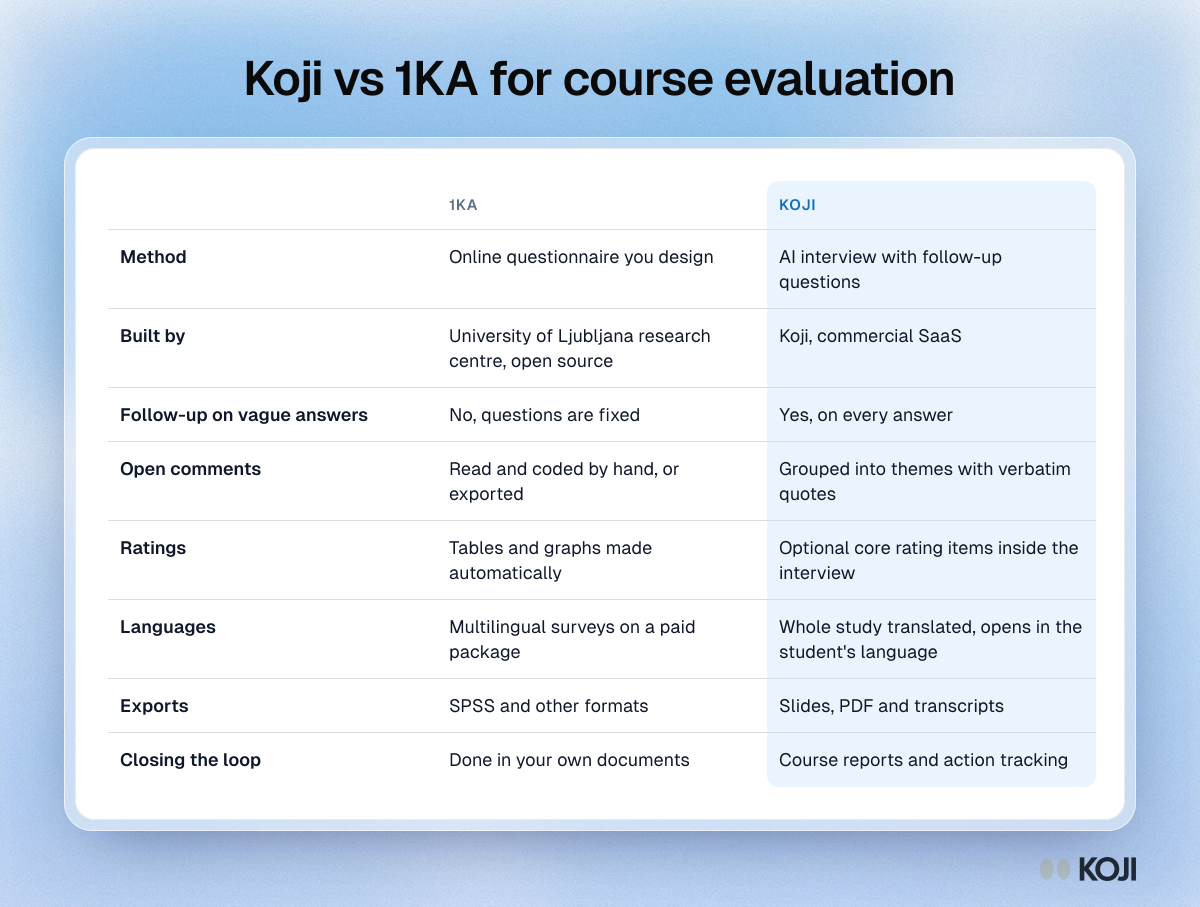
Comparison table of 1KA and Koji for course evaluation: method, follow-up questions, comment analysis, languages, exports and closing the loop

Reference table

Koji vs 1KA for course evaluation
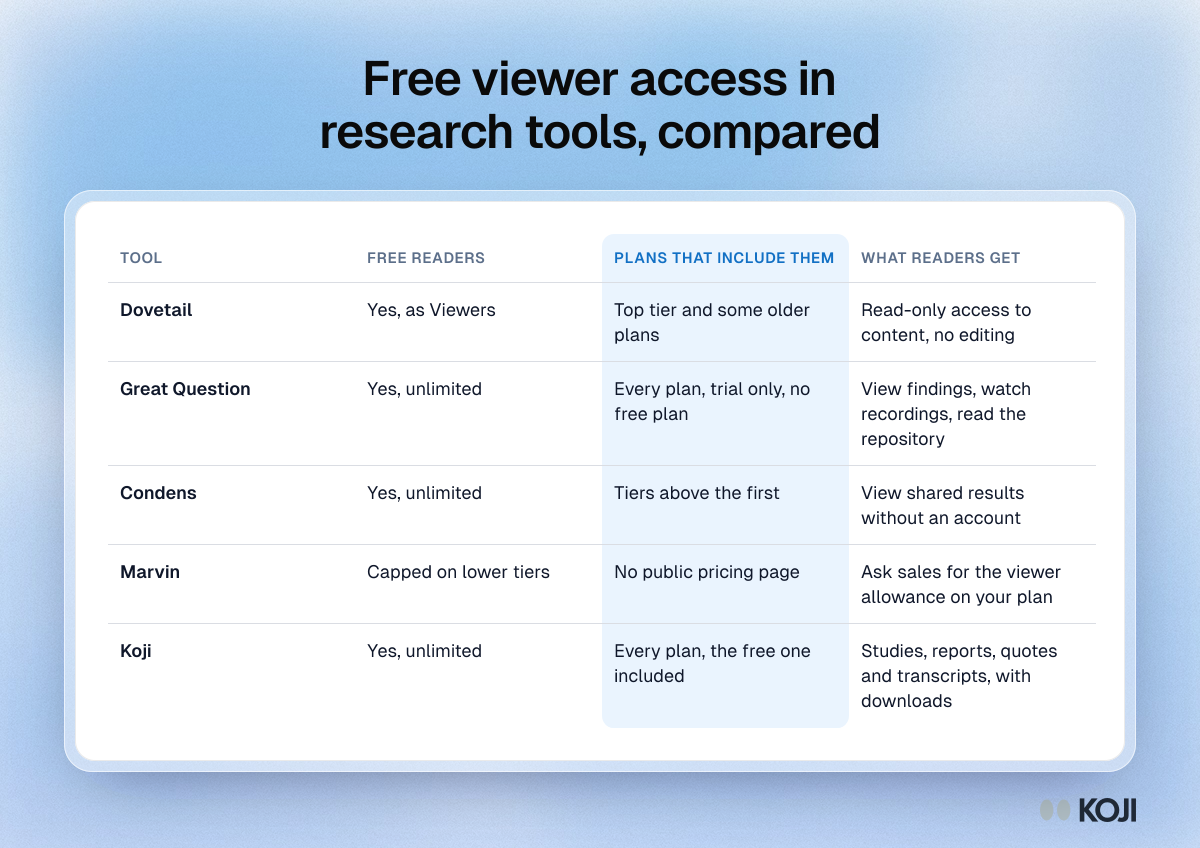
Table comparing free reader access in Dovetail, Great Question, Condens, Marvin and Koji: which plans include it and what readers can do.

Reference table

Free viewer access in research tools, compared
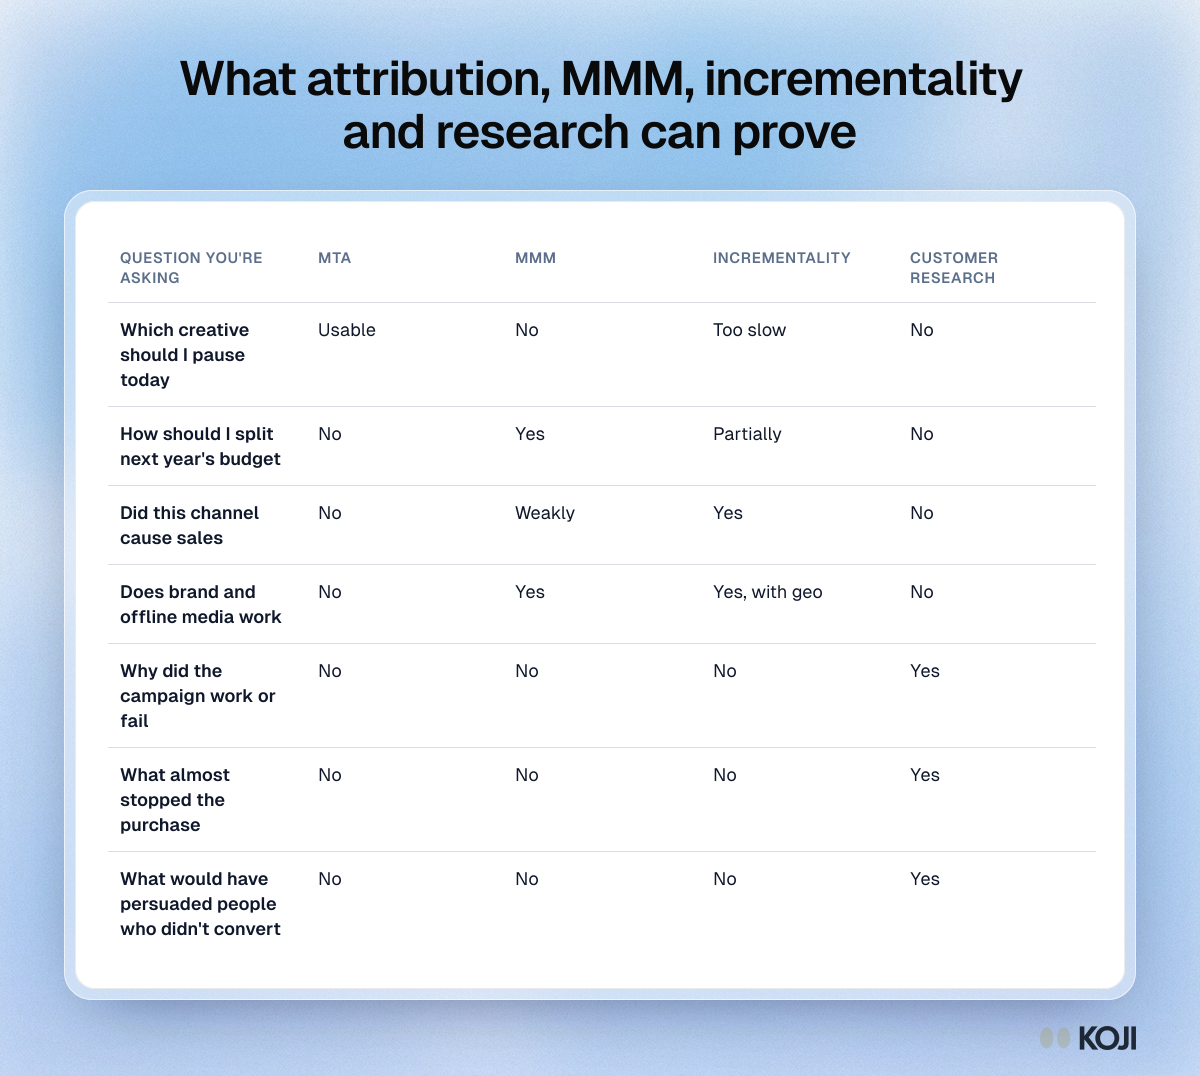
Table of seven marketing questions and which of attribution, MMM, incrementality testing and customer research can answer each, from budgets to why.

Reference table

What attribution, MMM, incrementality and research can prove