Free to save and share

Frameworks and cheat sheets for customer research

Every framework, checklist and comparison from our guides, as an image you can download, drop into a deck or share with your team.
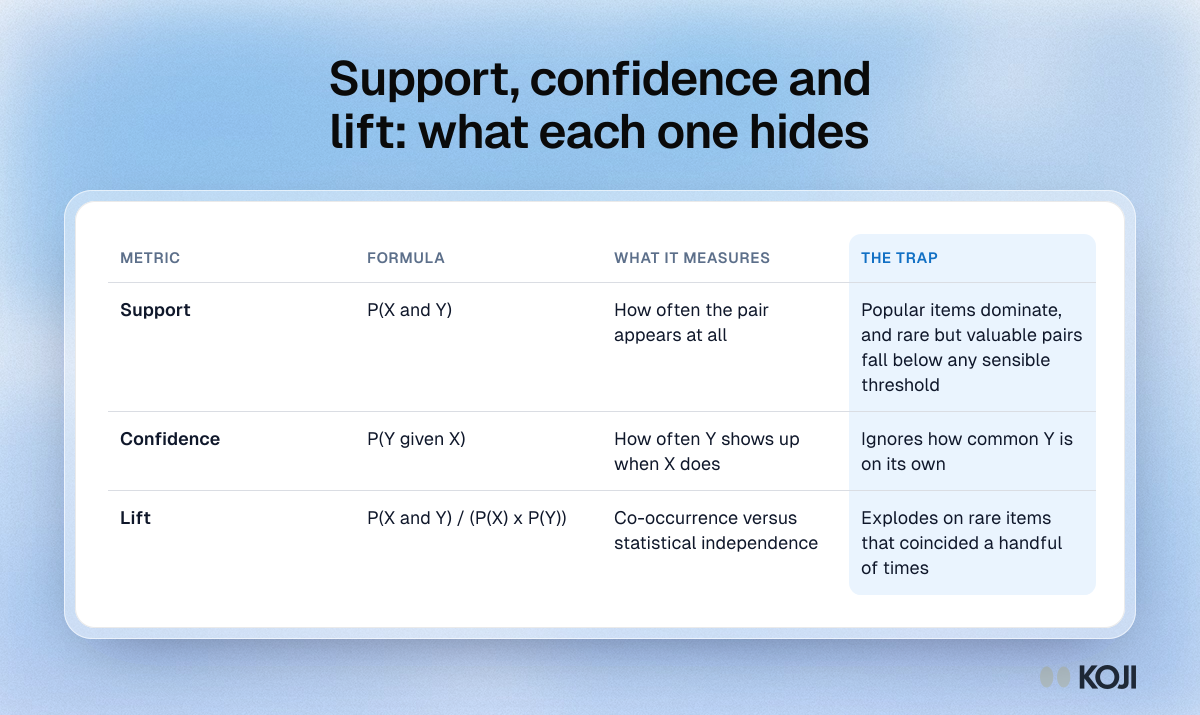
Table of the three market basket analysis metrics, support, confidence and lift, with each formula, what it measures and its trap.

Reference table

Support, confidence and lift: what each one hides
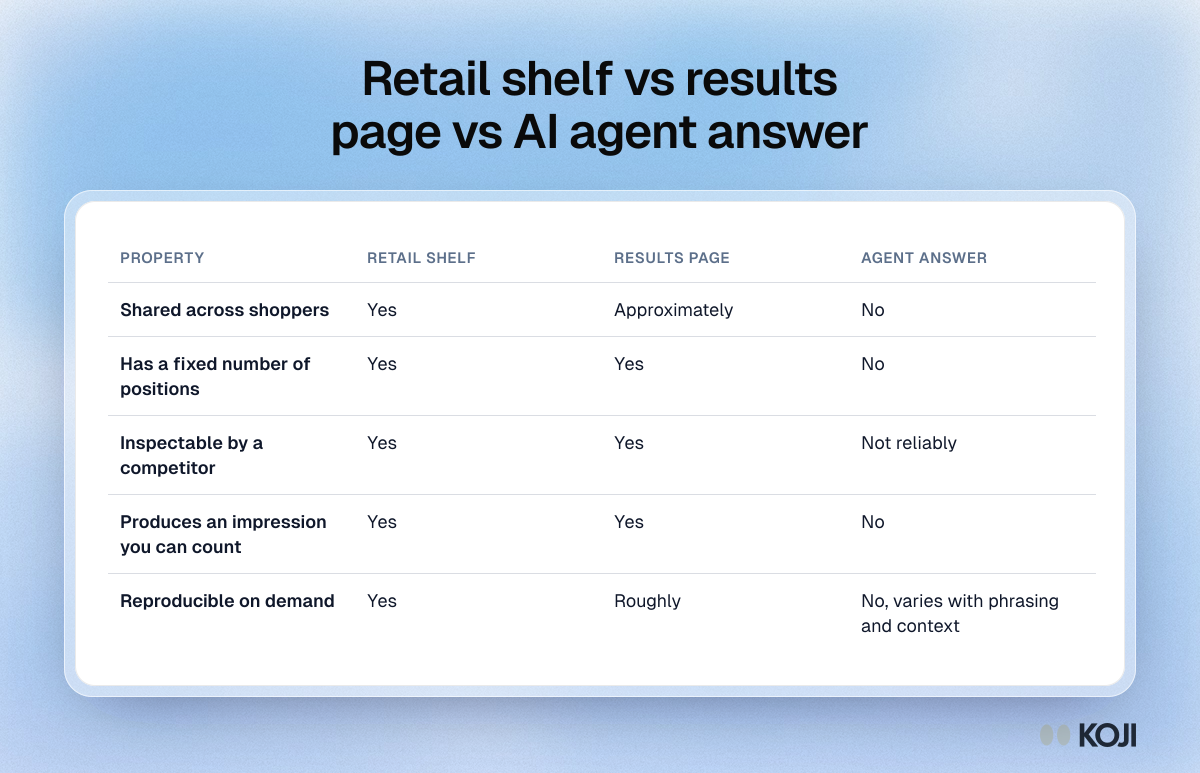
Table comparing a retail shelf, a search results page and an AI agent answer on five properties that make shelf metrics like share of search possible.

Reference table

Retail shelf vs results page vs AI agent answer
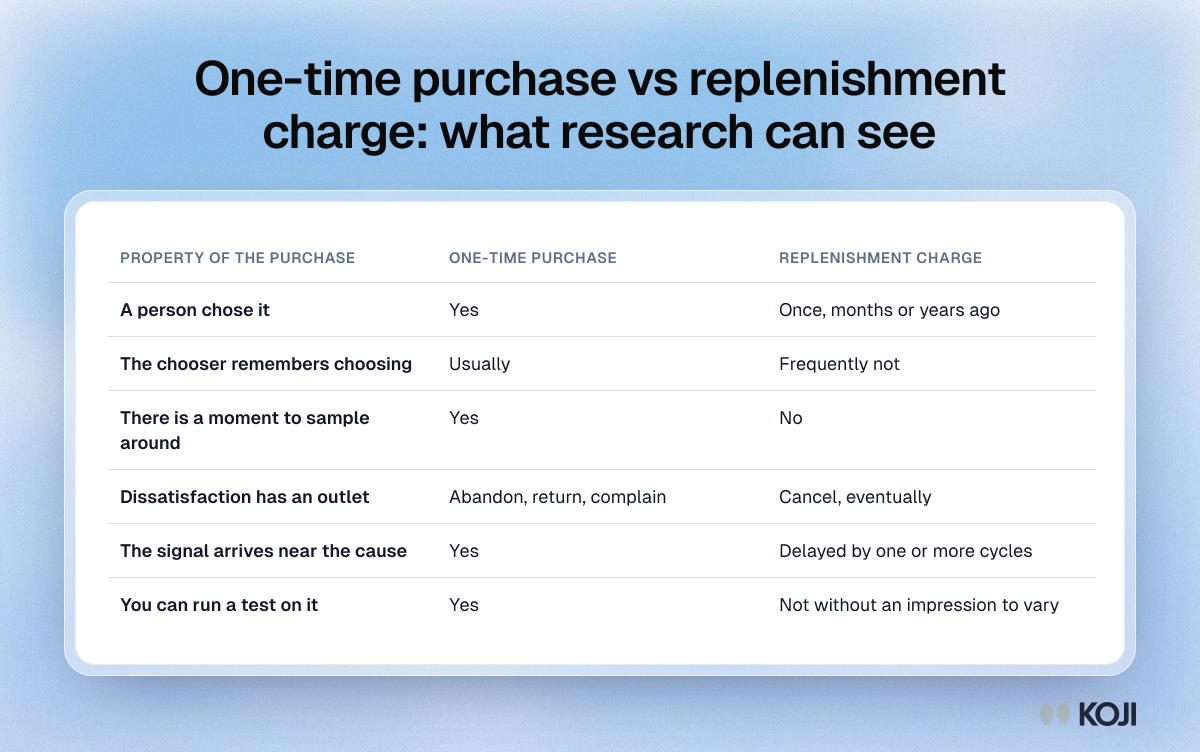
Table comparing a one-time purchase with a replenishment charge on six properties, from whether someone chose it to whether you can test it.

Reference table

One-time purchase vs replenishment charge: what research can see
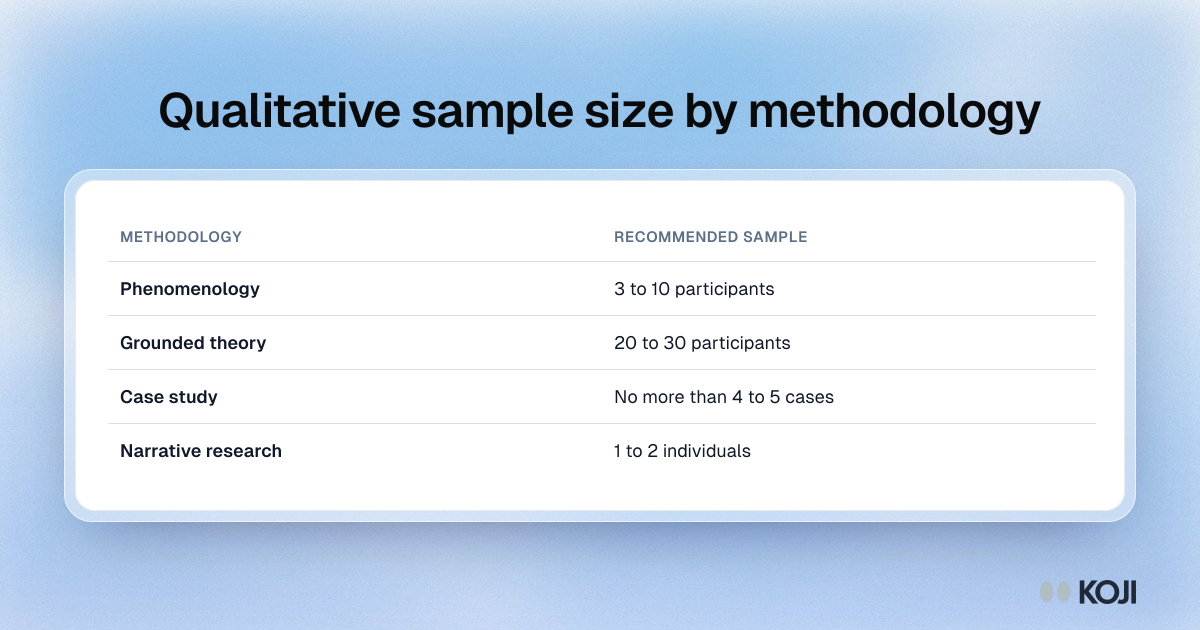
Table of Creswell's recommended sample sizes: 3 to 10 for phenomenology, 20 to 30 for grounded theory, up to 5 cases, 1 to 2 for narrative research.

Reference table

Qualitative sample size by methodology
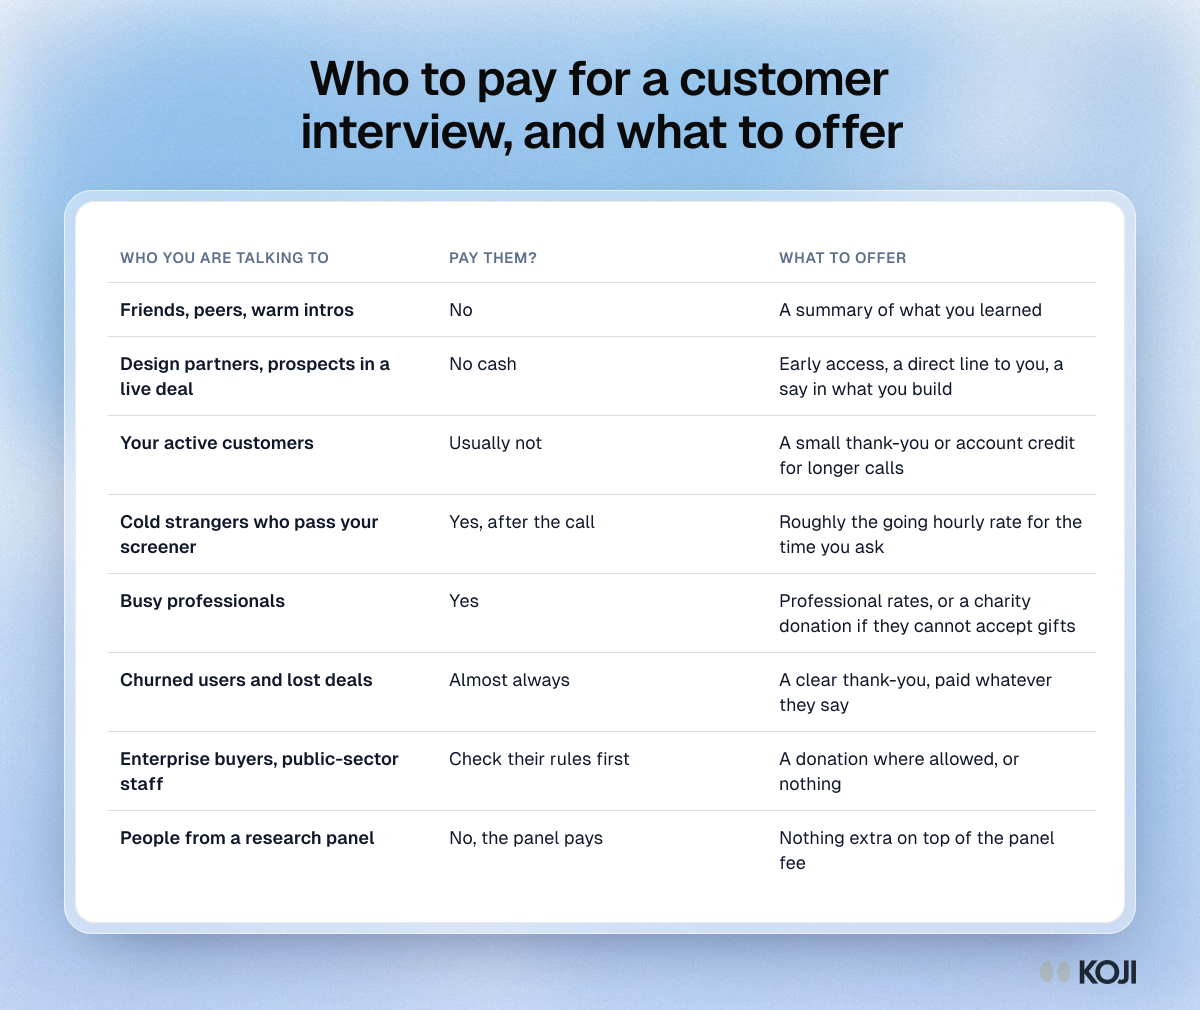
Table of whether to pay eight kinds of interviewee, from friends and design partners to churned users and enterprise buyers, and what to offer

Reference table

Who to pay for a customer interview, and what to offer
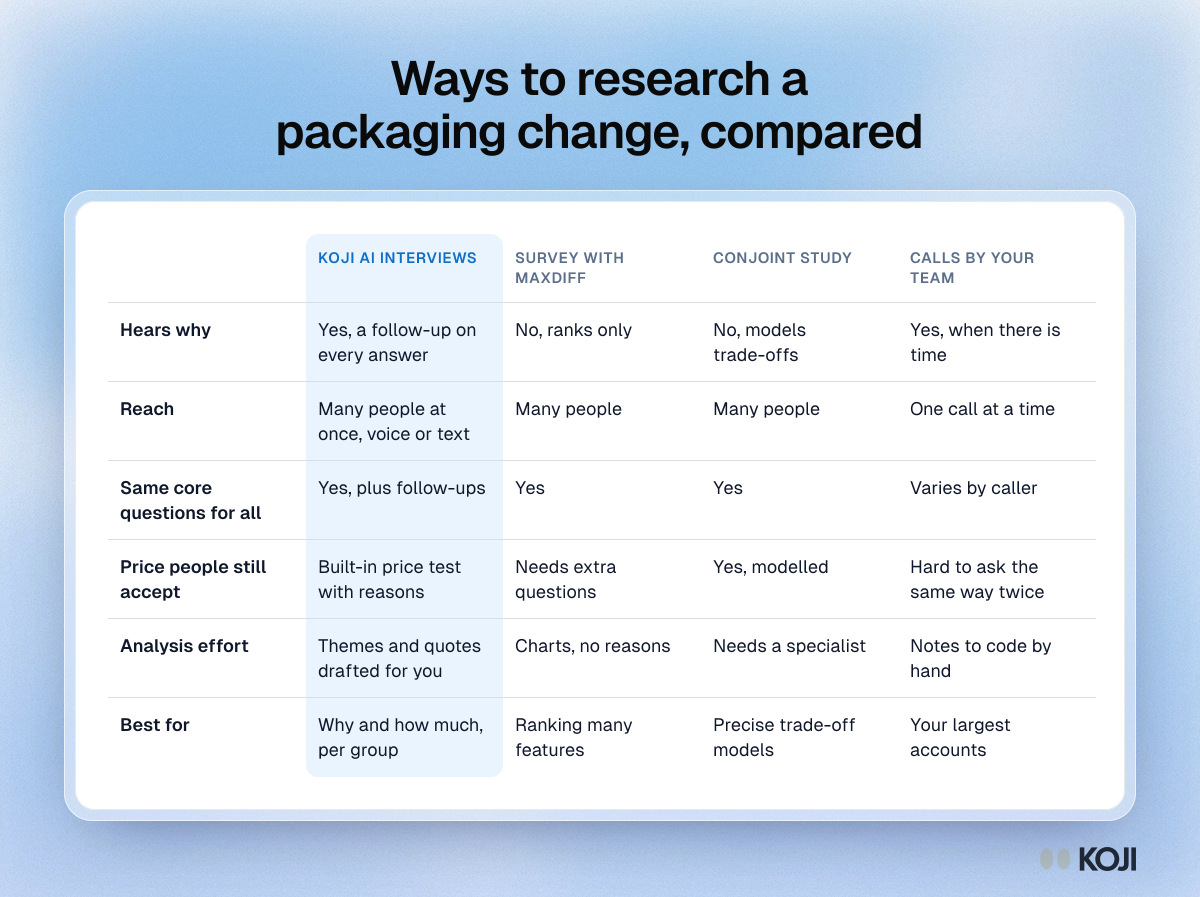
Comparison table of four ways to research a packaging change: AI interviews, a MaxDiff survey, a conjoint study and calls by your own team.

Reference table

Ways to research a packaging change, compared
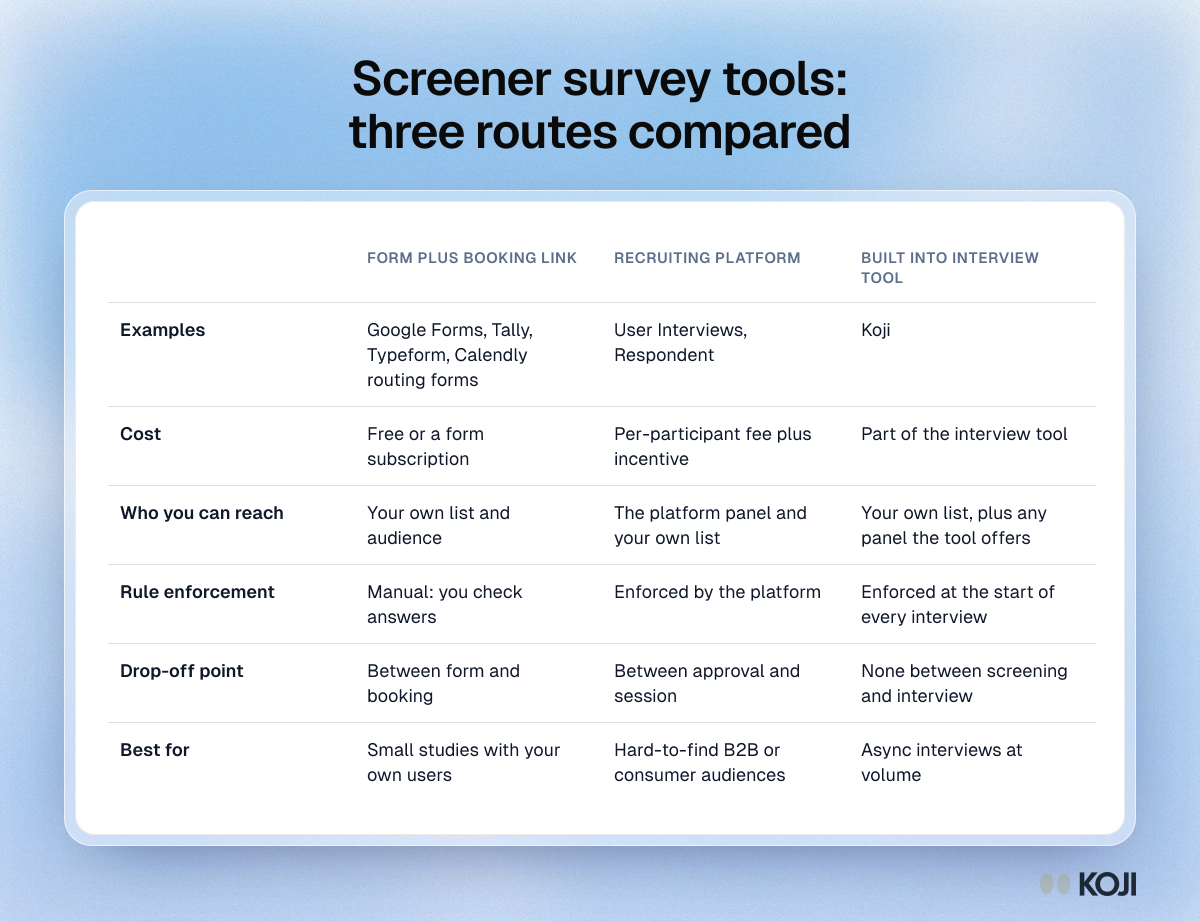
Table comparing three ways to screen research participants: a form and booking link, a recruiting platform, and a screener in the interview tool.

Reference table

Screener survey tools: three routes compared
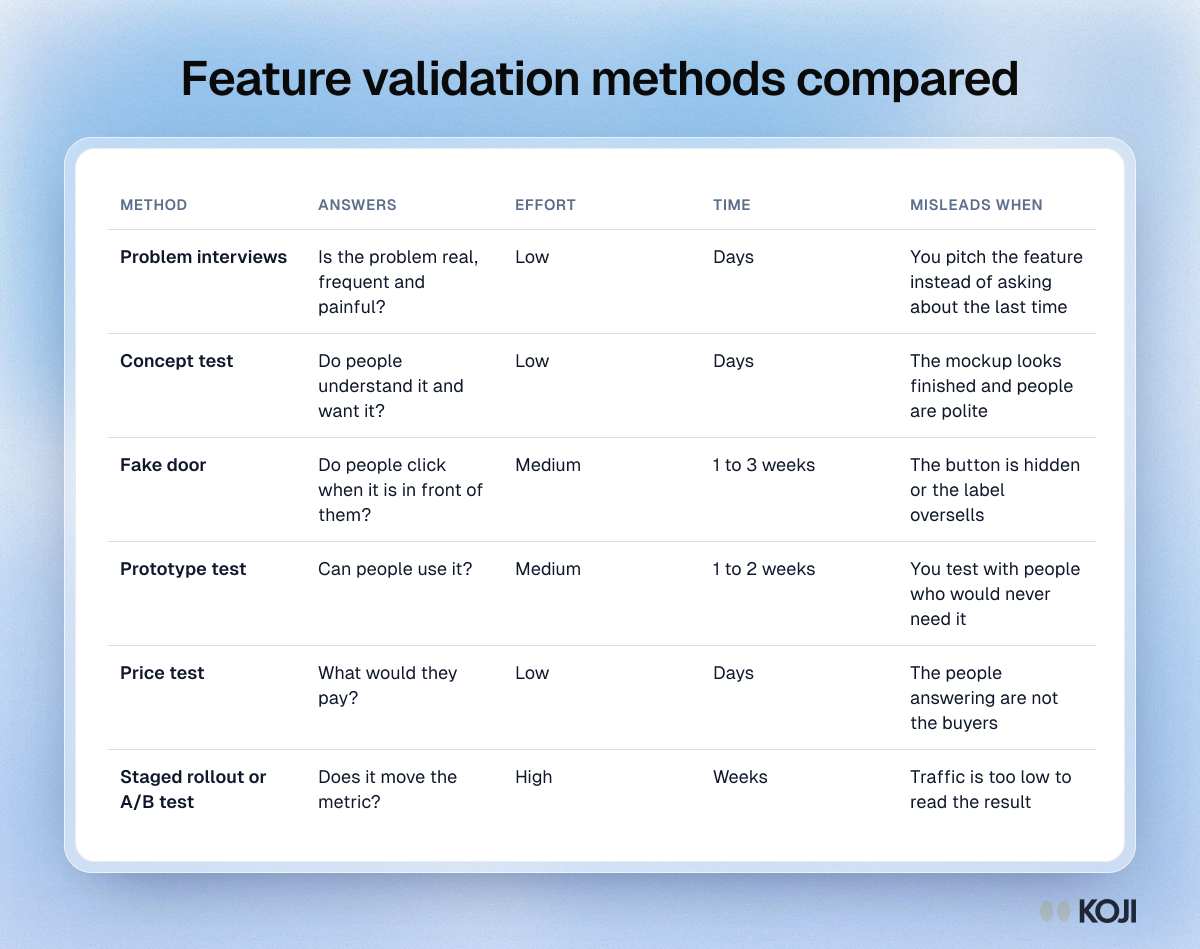
Table comparing six feature validation methods by the question each answers, effort, time and when it misleads.

Reference table

Feature validation methods compared
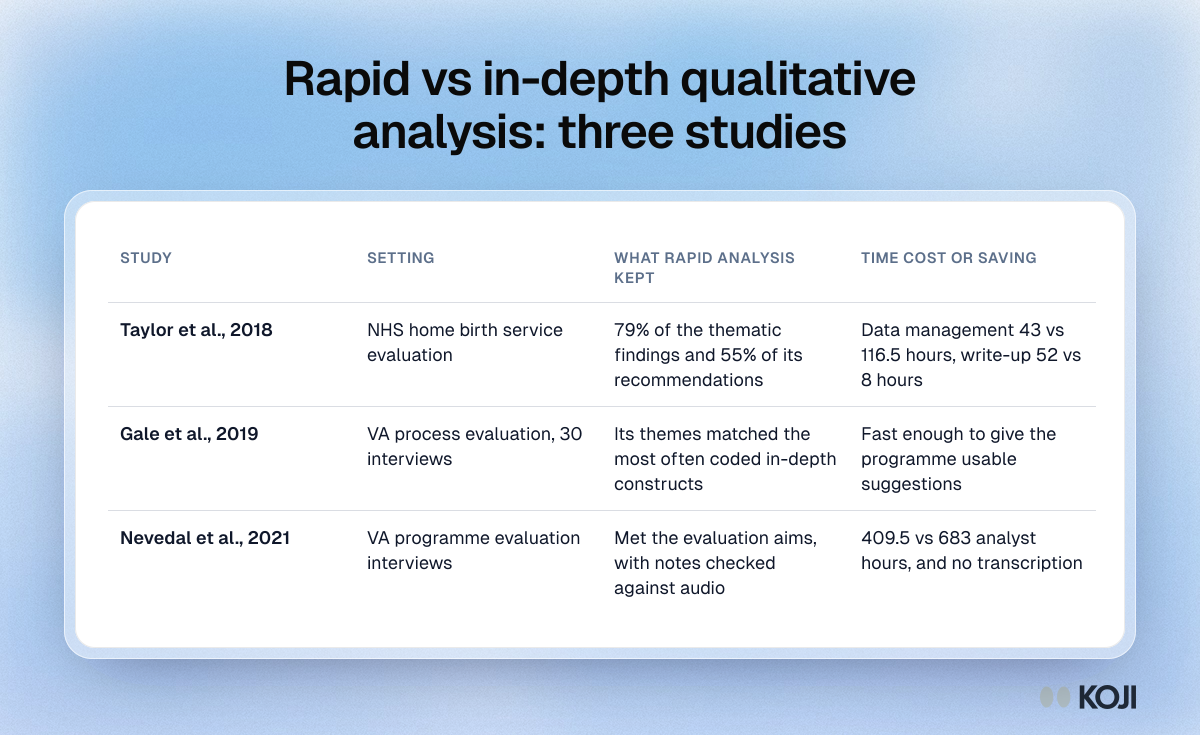
Table comparing three studies of rapid vs in-depth qualitative analysis: what the rapid approach kept and what it cost or saved in each.

Reference table

Rapid vs in-depth qualitative analysis: three studies
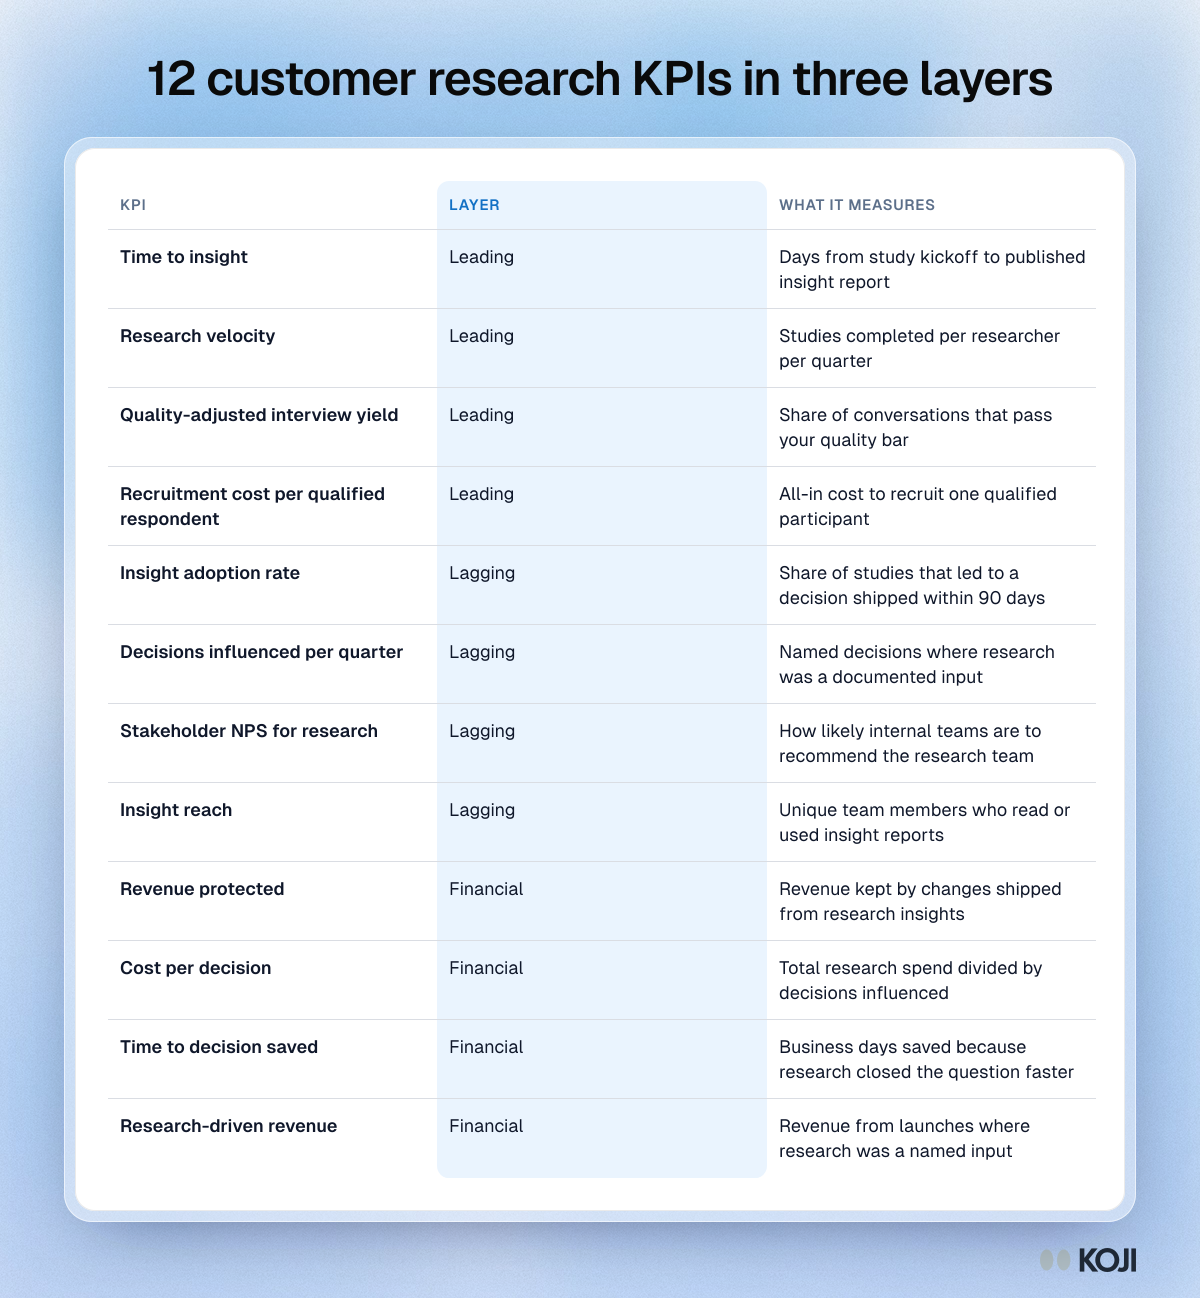
Table of 12 customer research KPIs grouped as leading, lagging and financial, from time to insight to cost per decision and research-driven revenue.

Reference table

12 customer research KPIs in three layers
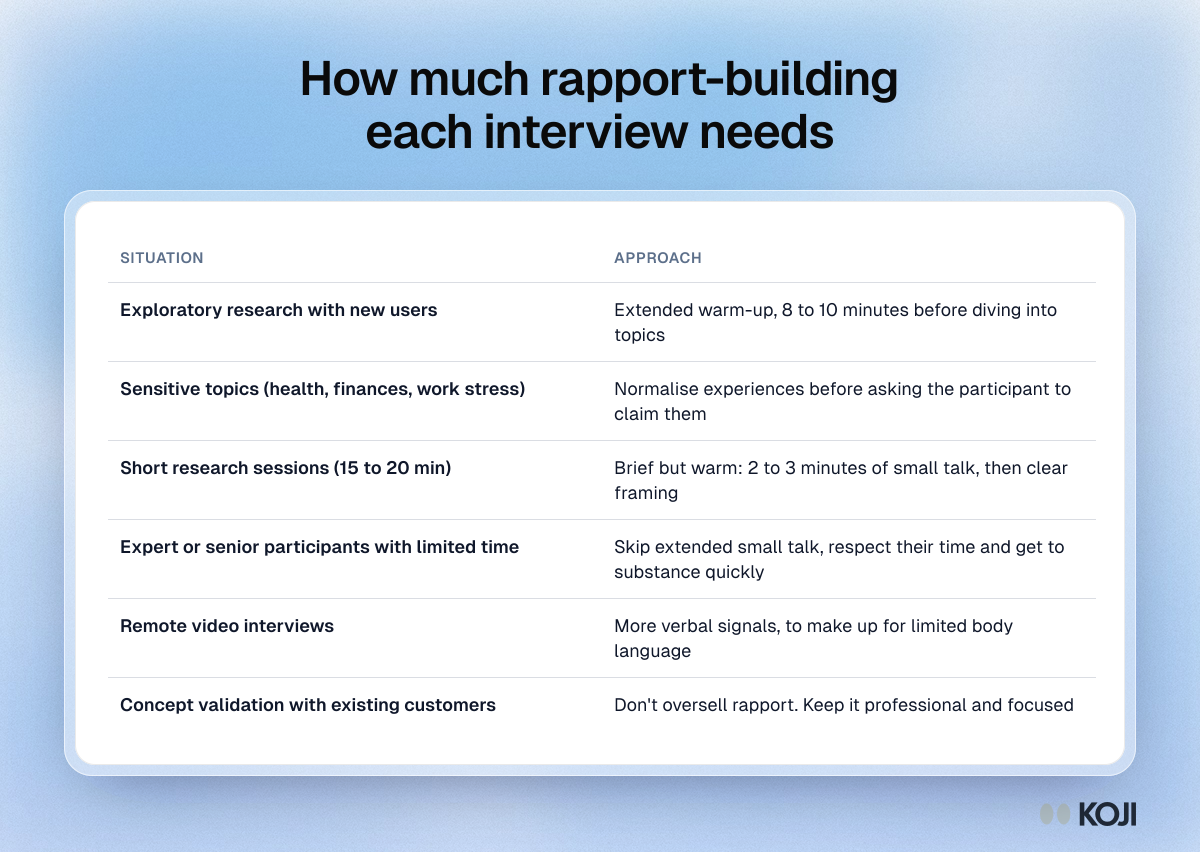
Table matching six interview situations, from exploratory research to expert participants and remote calls, with how much rapport-building each needs.

Reference table

How much rapport-building each interview needs
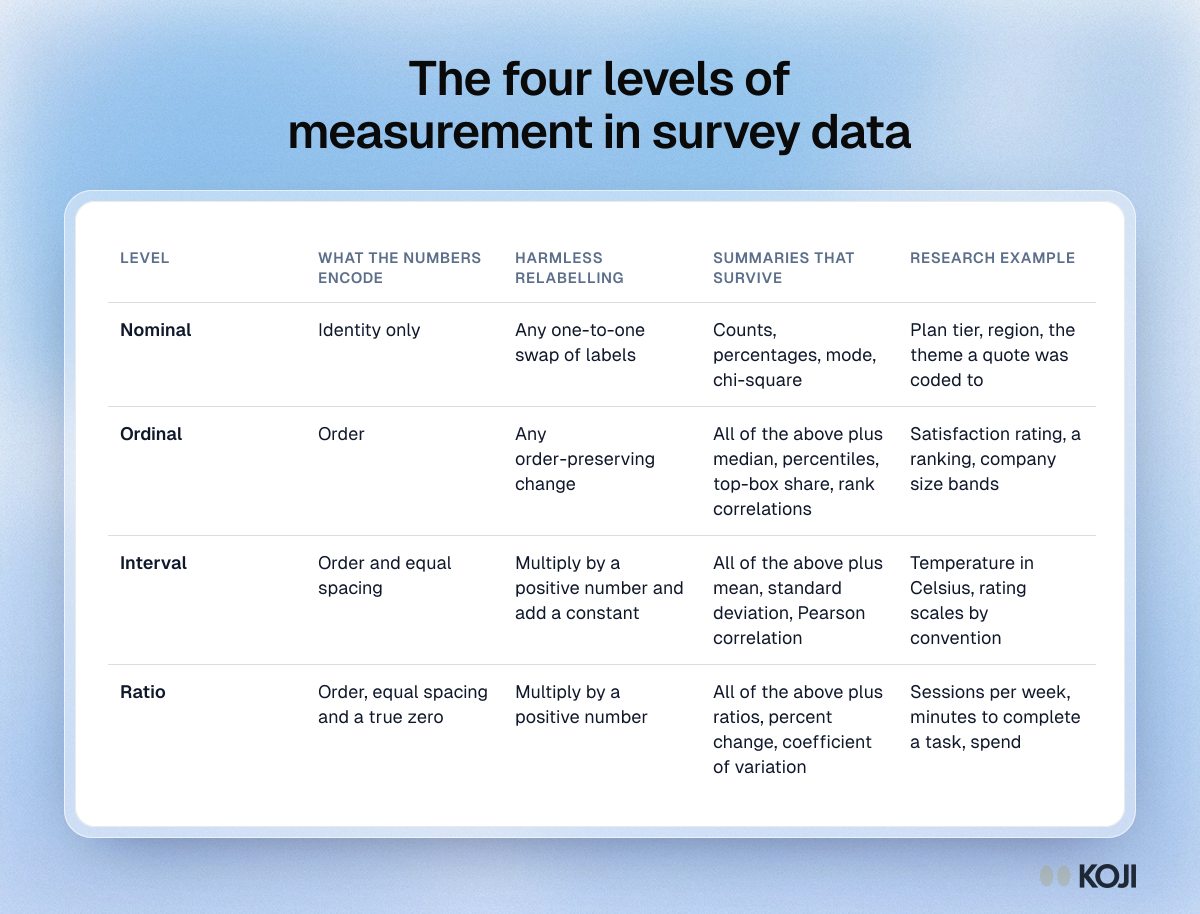
Table of the four levels of measurement, nominal, ordinal, interval and ratio, with the summaries each allows and a research example of each.

Reference table

The four levels of measurement in survey data
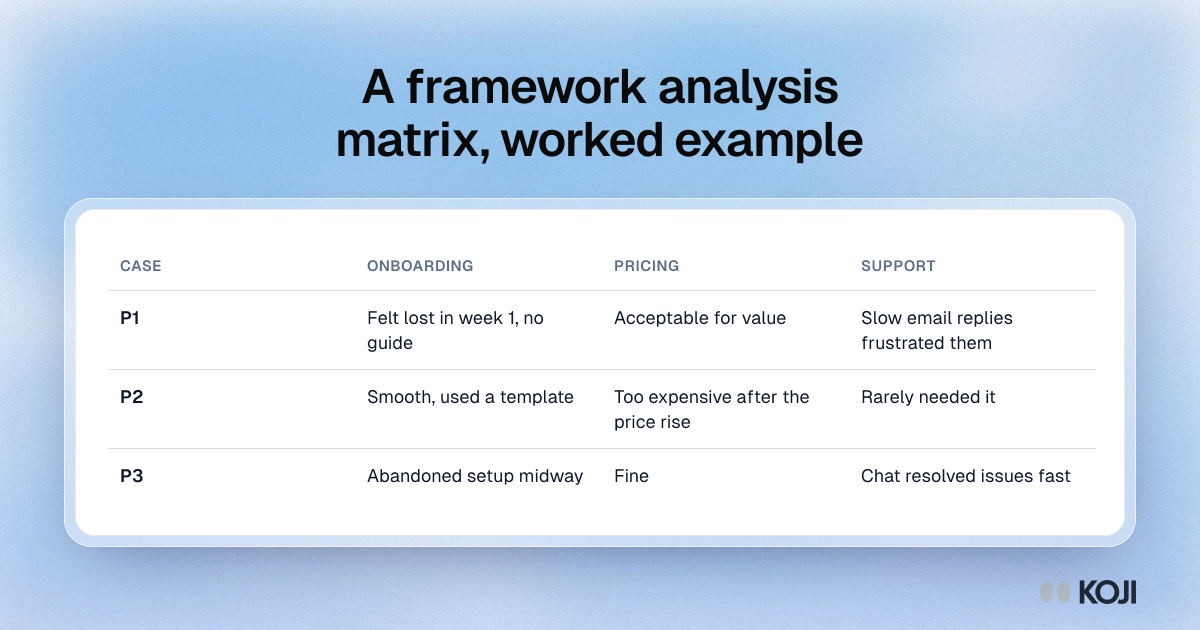
Table showing a framework analysis matrix for a churn study: three participants as rows and onboarding, pricing and support as theme columns.

Reference table

A framework analysis matrix, worked example
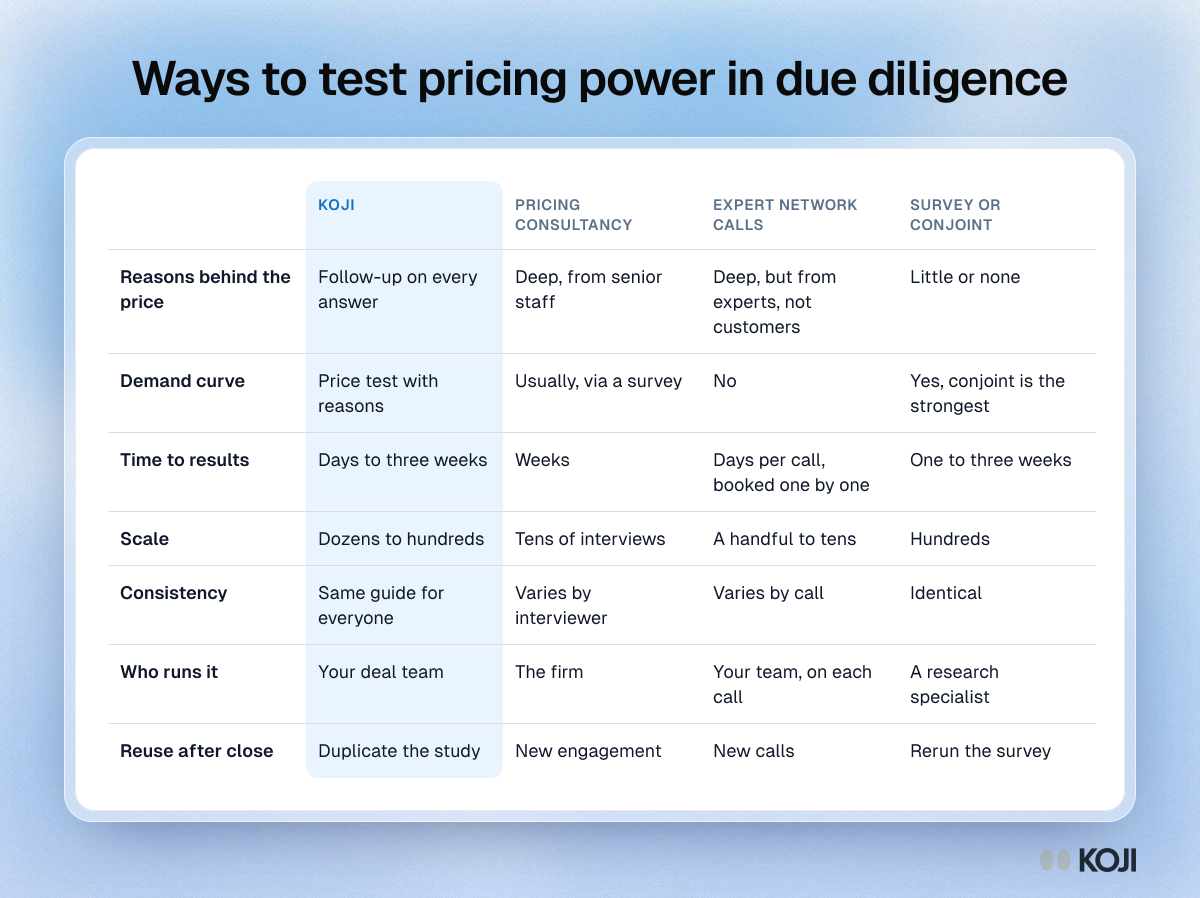
Table comparing Koji, a pricing consultancy, expert network calls and survey or conjoint studies for testing pricing power in due diligence

Reference table

Ways to test pricing power in due diligence
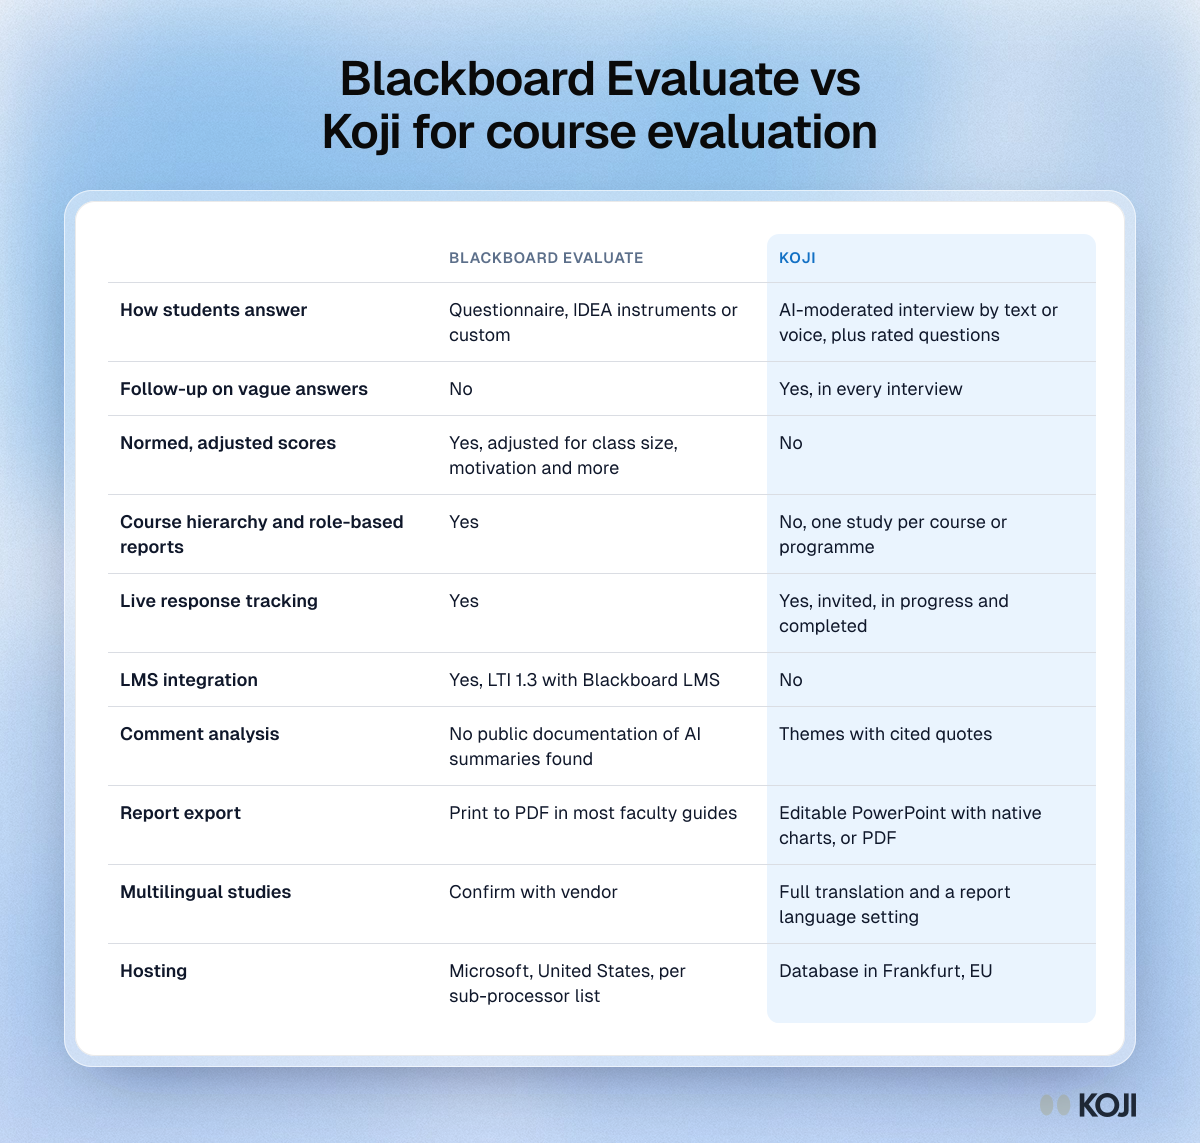
Comparison table of Blackboard Evaluate and Koji for course evaluation, covering collection method, normed scores, comment analysis, export and hosting.

Reference table

Blackboard Evaluate vs Koji for course evaluation
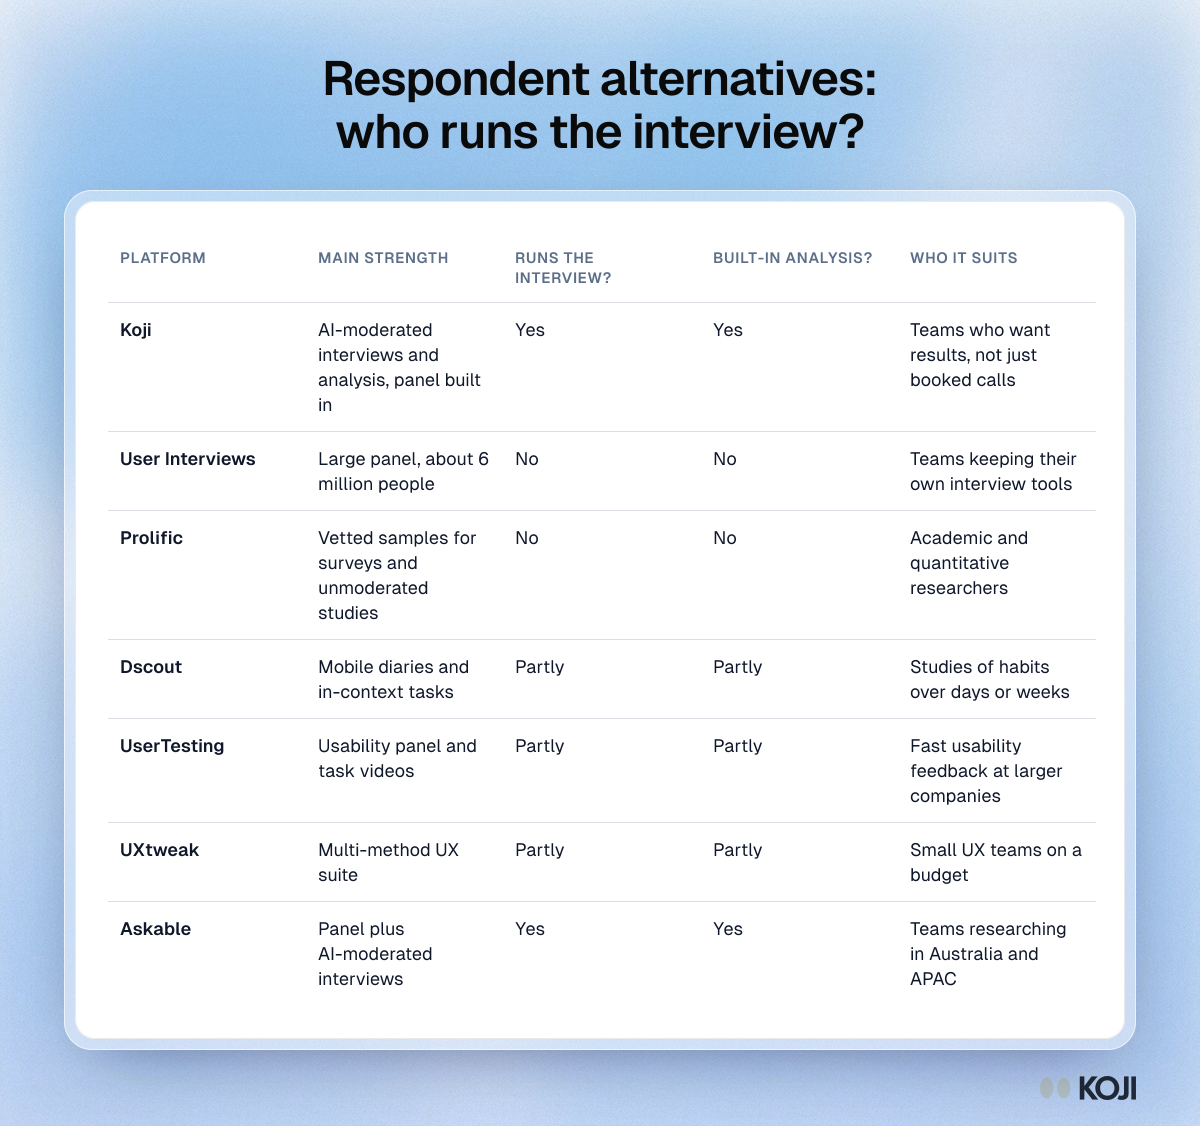
Table comparing seven Respondent alternatives by main strength, whether each runs the interview, whether it includes analysis, and who it suits.

Reference table

Respondent alternatives: who runs the interview?
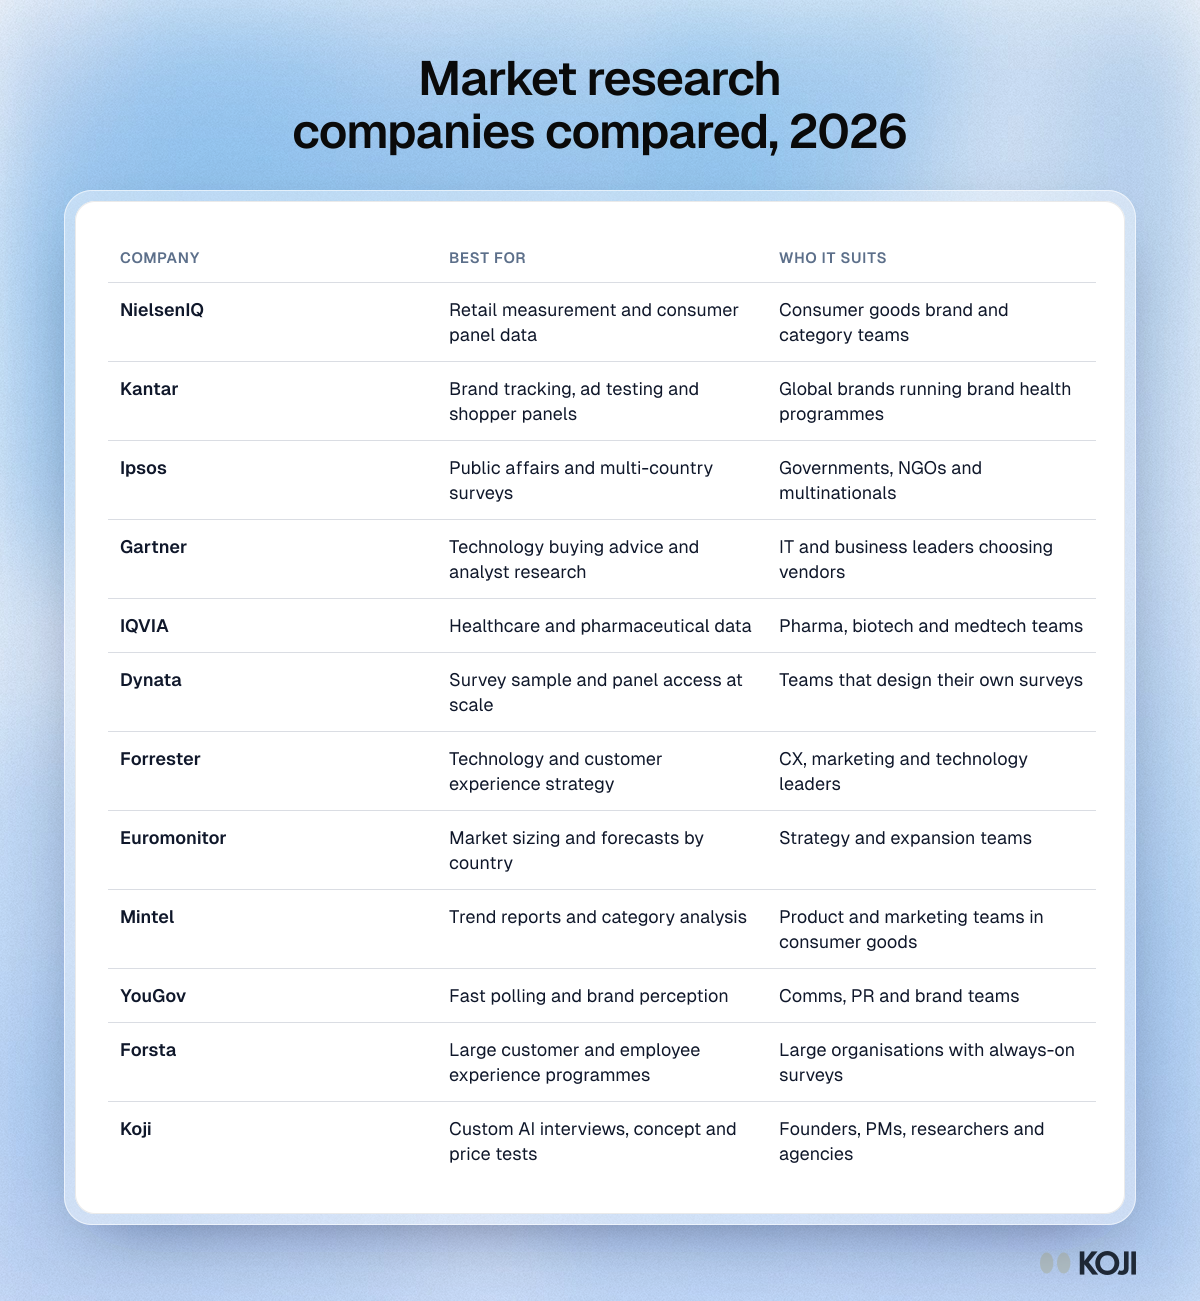
Table comparing 12 market research companies by what each is best for and who it suits, from NielsenIQ and Kantar to Koji.

Reference table

Market research companies compared, 2026
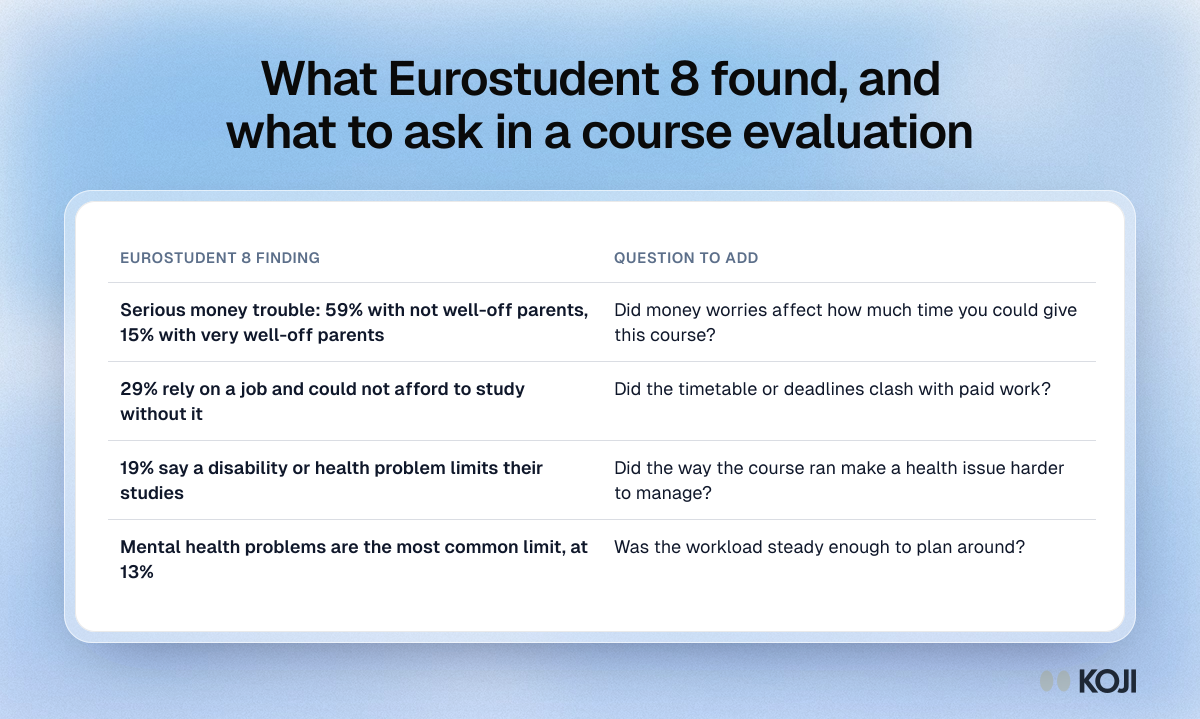
Table pairing four EUROSTUDENT 8 findings on money, paid work, health and mental health with a question to add to a course evaluation for each.

Reference table

What Eurostudent 8 found, and what to ask in a course evaluation
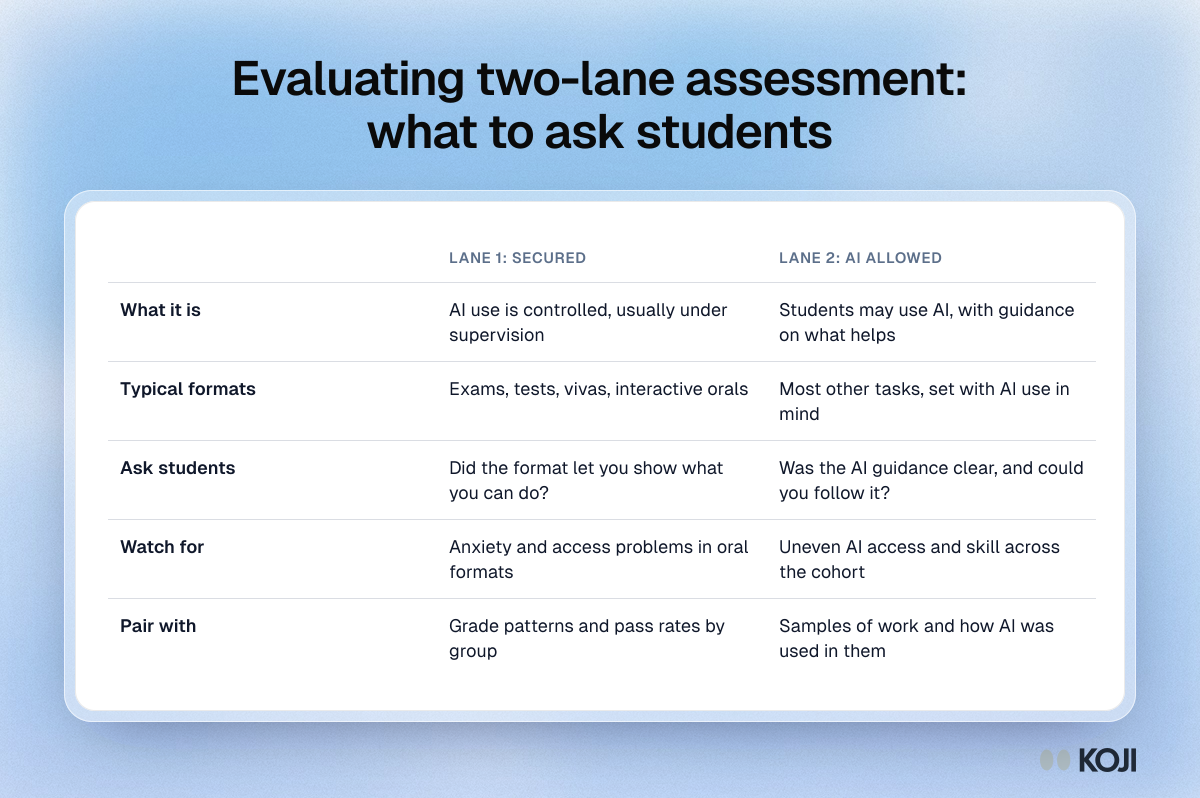
Table comparing secured Lane 1 and AI-allowed Lane 2 assessment, with what each is, typical formats, questions for students, risks and evidence to pair.

Reference table

Evaluating two-lane assessment: what to ask students
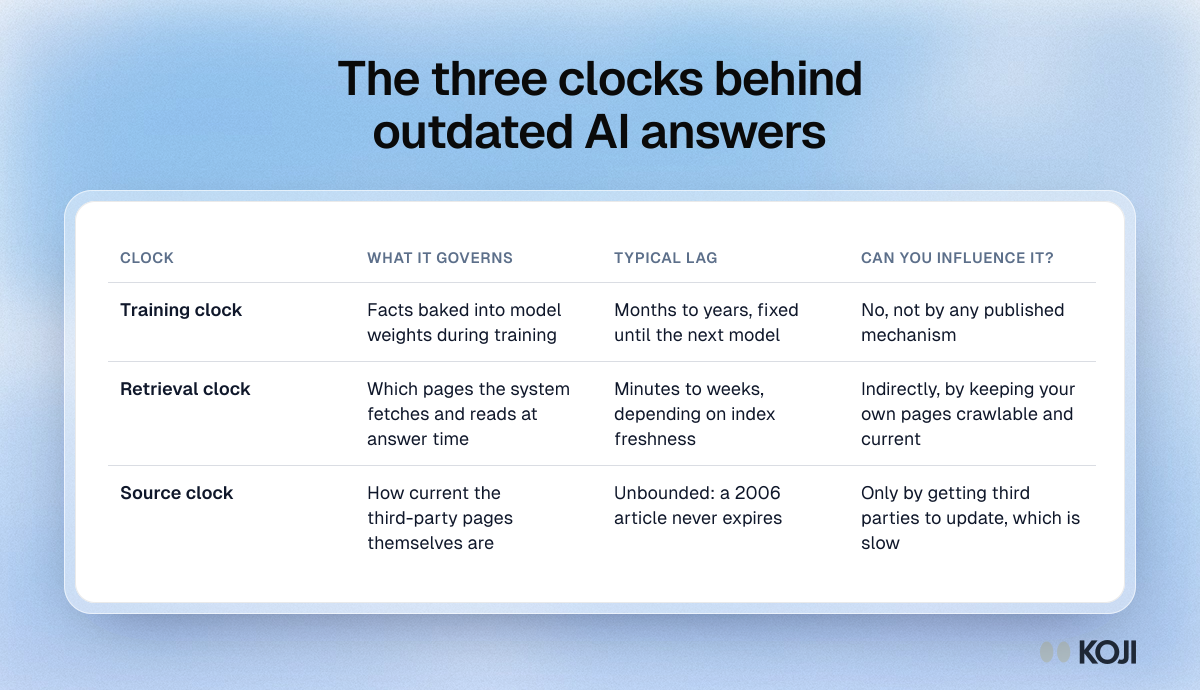
Table of the three clocks behind outdated AI answers: training, retrieval and source, with what each governs, its lag and your influence.

Reference table

The three clocks behind outdated AI answers
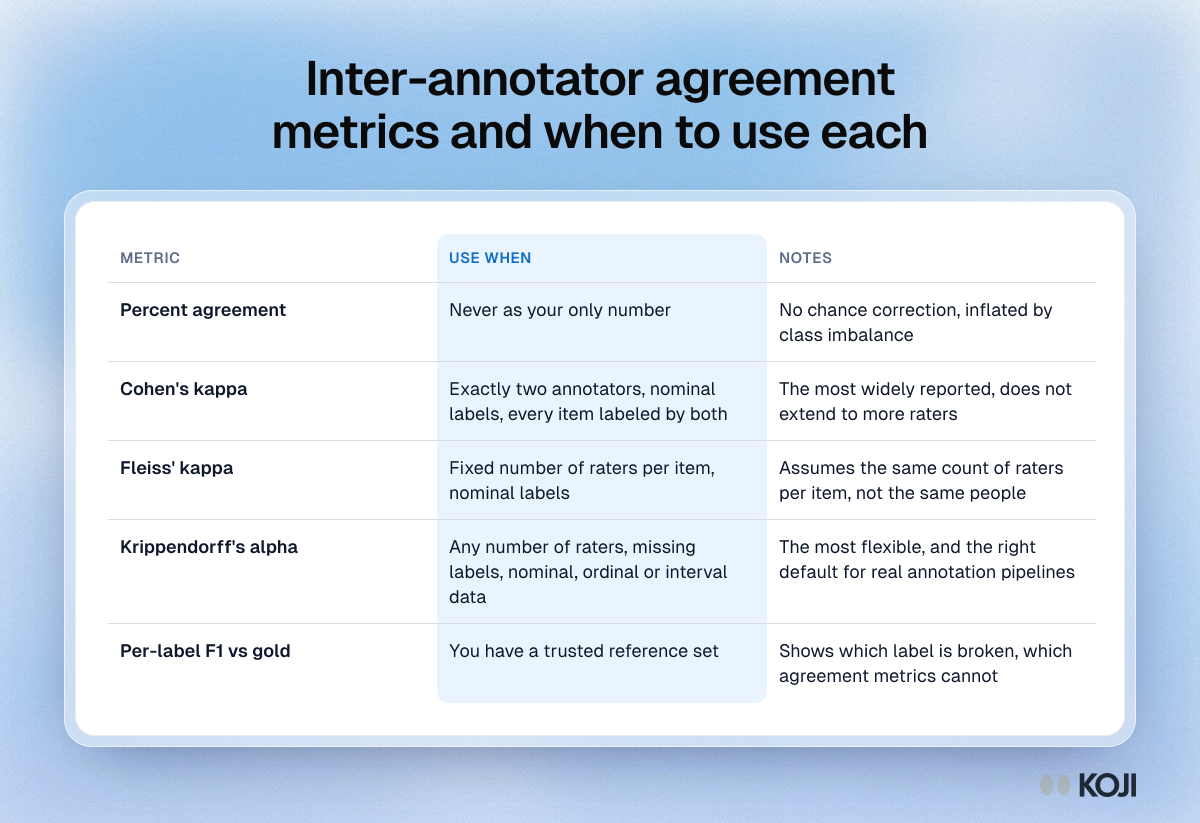
Table comparing percent agreement, Cohen's kappa, Fleiss' kappa, Krippendorff's alpha and per-label F1 by when to use each.

Reference table

Inter-annotator agreement metrics and when to use each
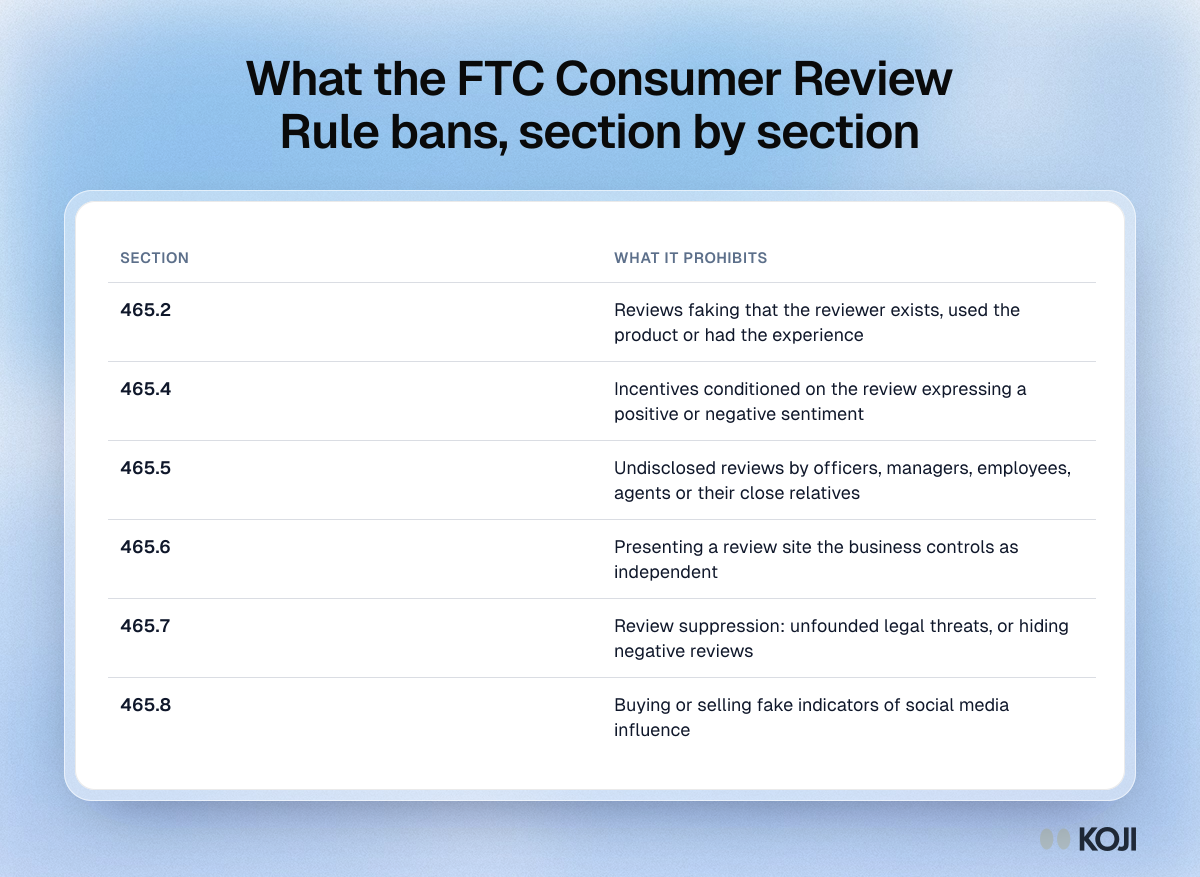
Table of the FTC Consumer Review Rule, 16 CFR Part 465, listing what sections 465.2, 465.4, 465.5, 465.6, 465.7 and 465.8 prohibit.

Reference table

What the FTC Consumer Review Rule bans, section by section
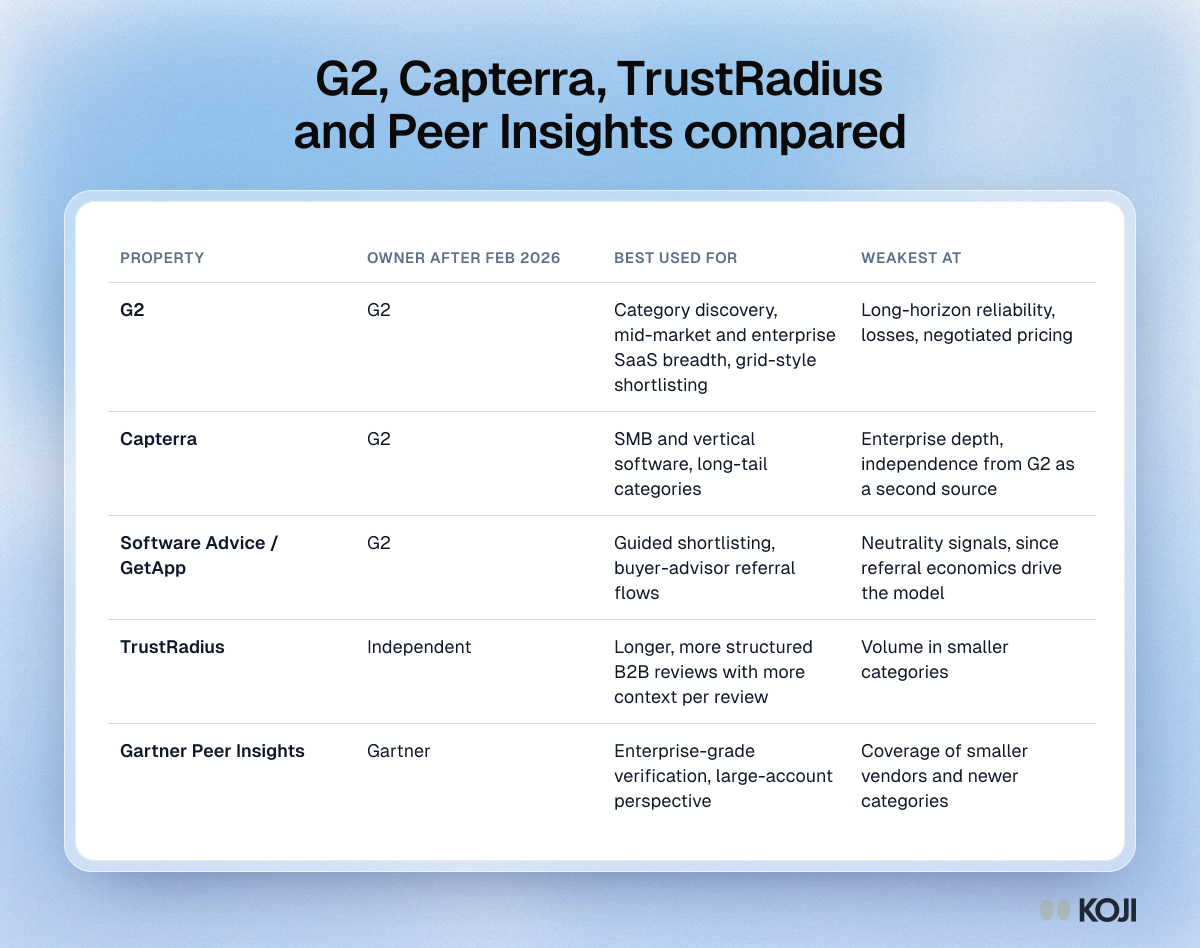
Table comparing G2, Capterra, Software Advice and GetApp, TrustRadius and Gartner Peer Insights by owner, best use and weakest point.

Reference table

G2, Capterra, TrustRadius and Peer Insights compared
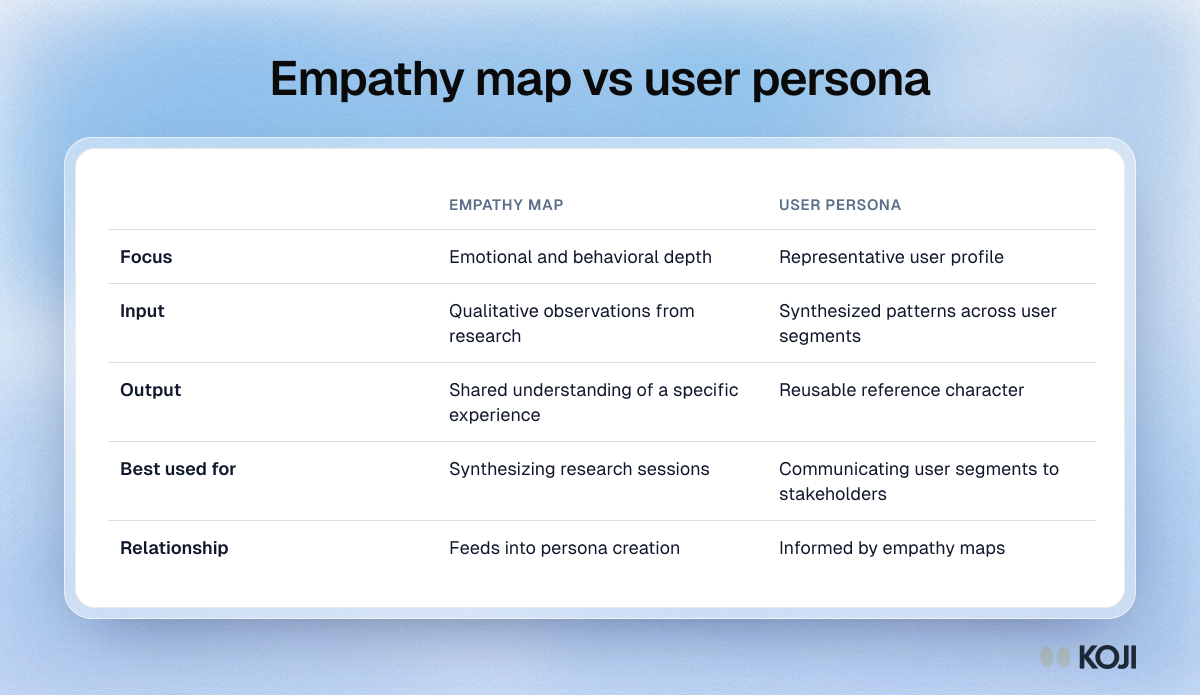
Table comparing empathy maps and user personas by focus, input, output, best use and how the two feed each other.

Reference table

Empathy map vs user persona
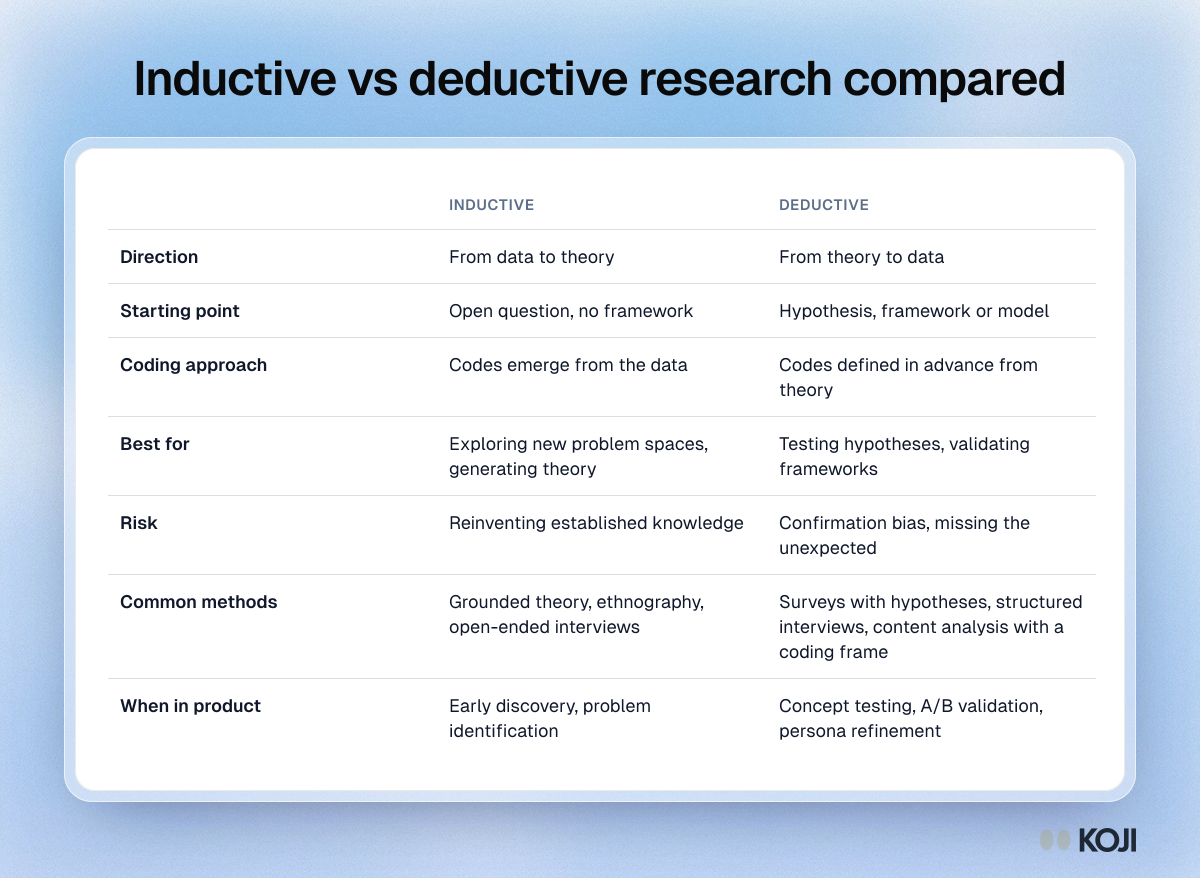
Table comparing inductive and deductive research by direction, starting point, coding, best use, risk, common methods and timing in product work.

Reference table

Inductive vs deductive research compared
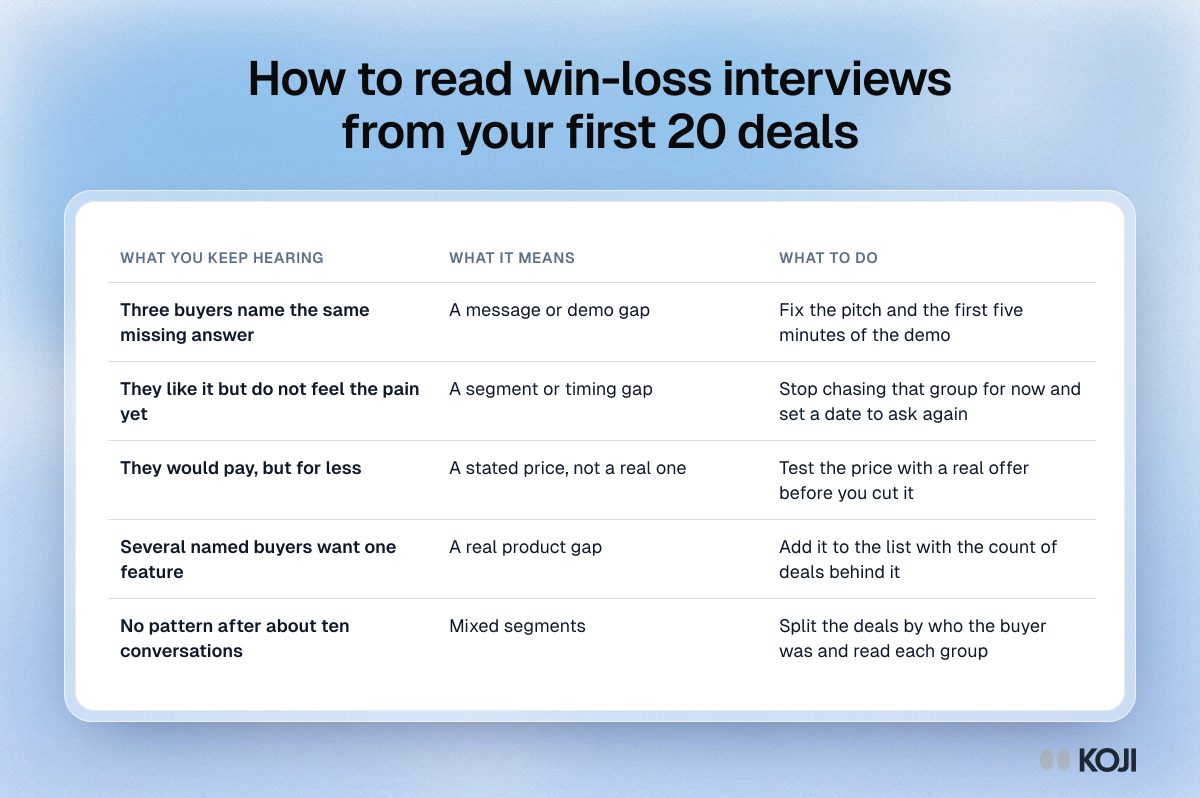
Table matching what founders hear in win-loss interviews, such as a missing answer, no felt pain or a lower price, to what it means and the one change to make.

Reference table

How to read win-loss interviews from your first 20 deals
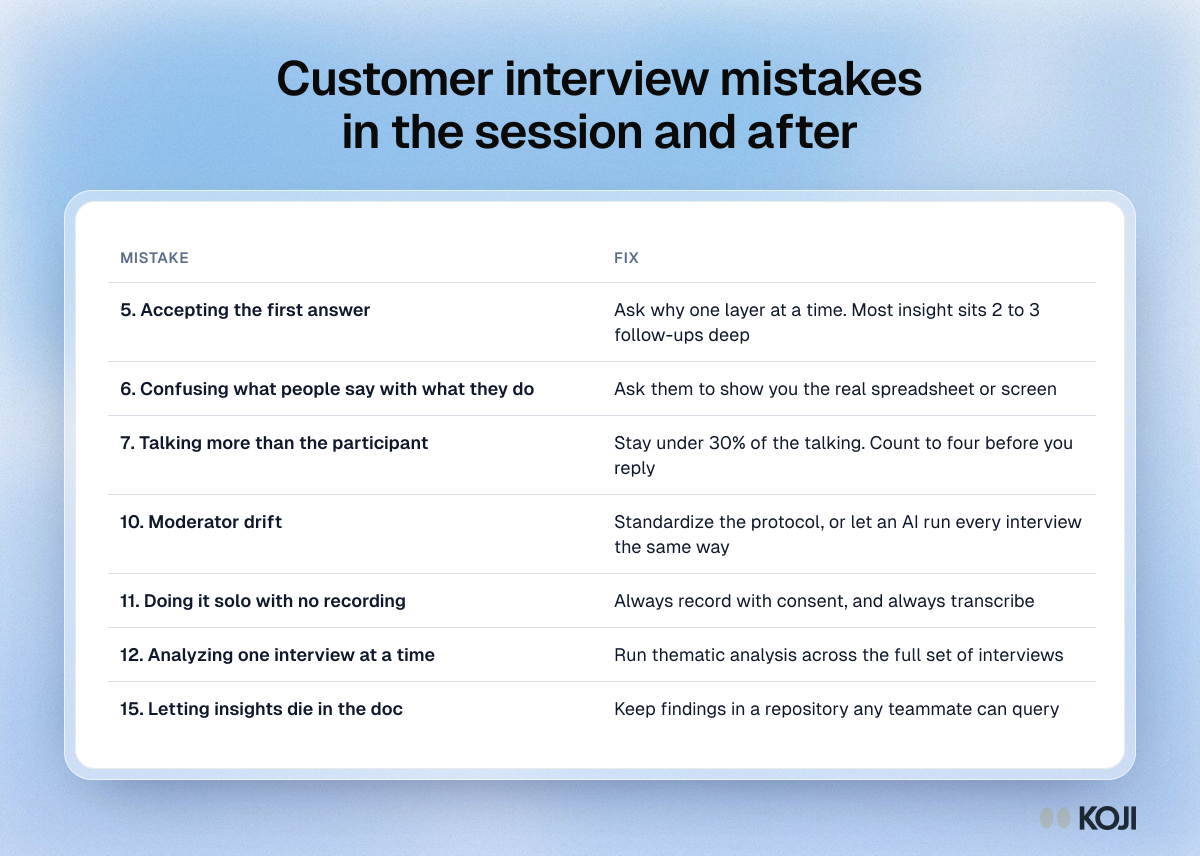
Table of seven customer interview mistakes made during and after the session, from accepting the first answer to letting insights die in a doc, with fixes.

Reference table

Customer interview mistakes in the session and after
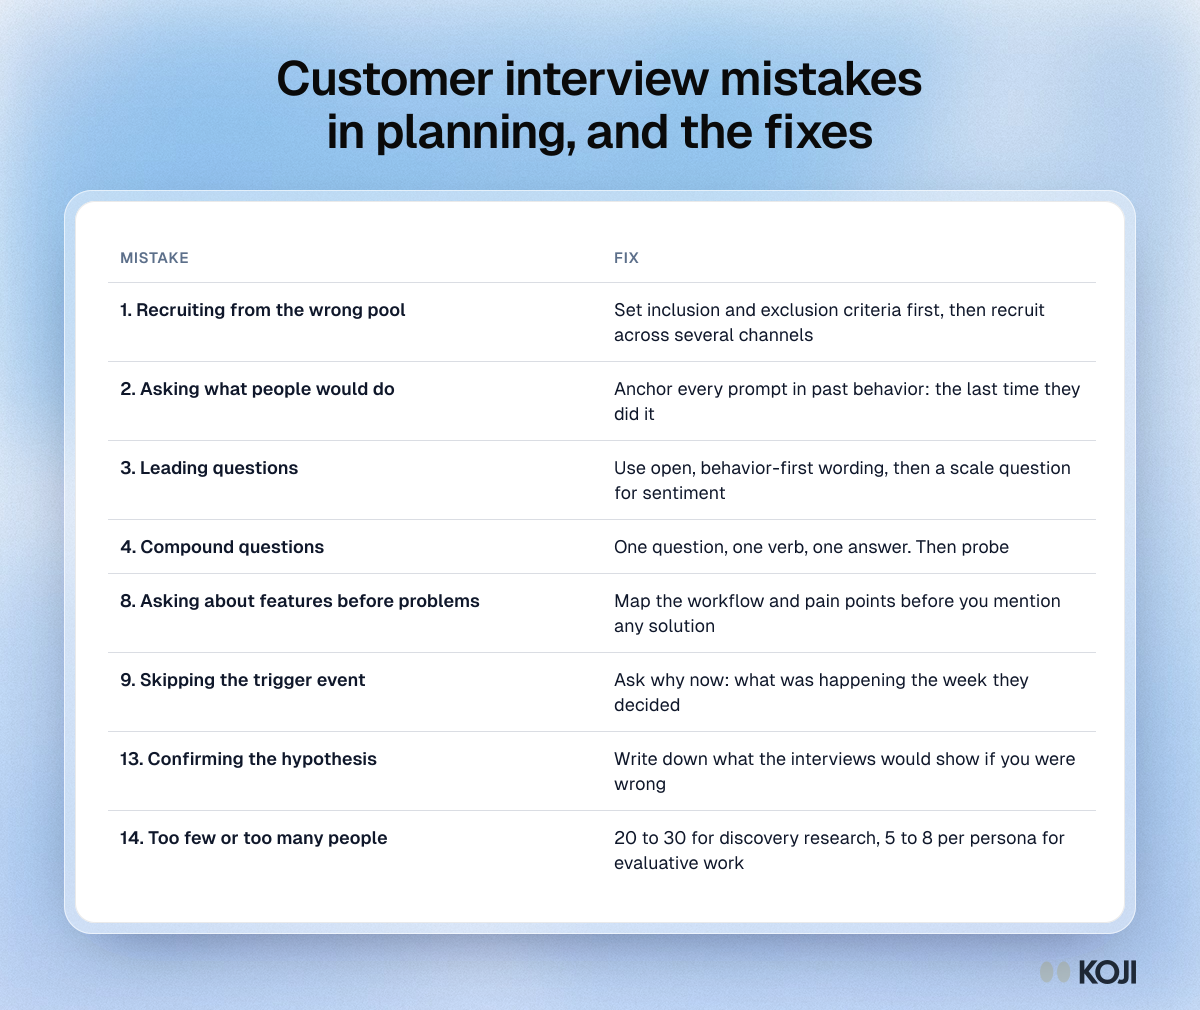
Table of eight customer interview mistakes made before the session, from recruiting the wrong pool to the wrong sample size, each with its fix.

Reference table

Customer interview mistakes in planning, and the fixes
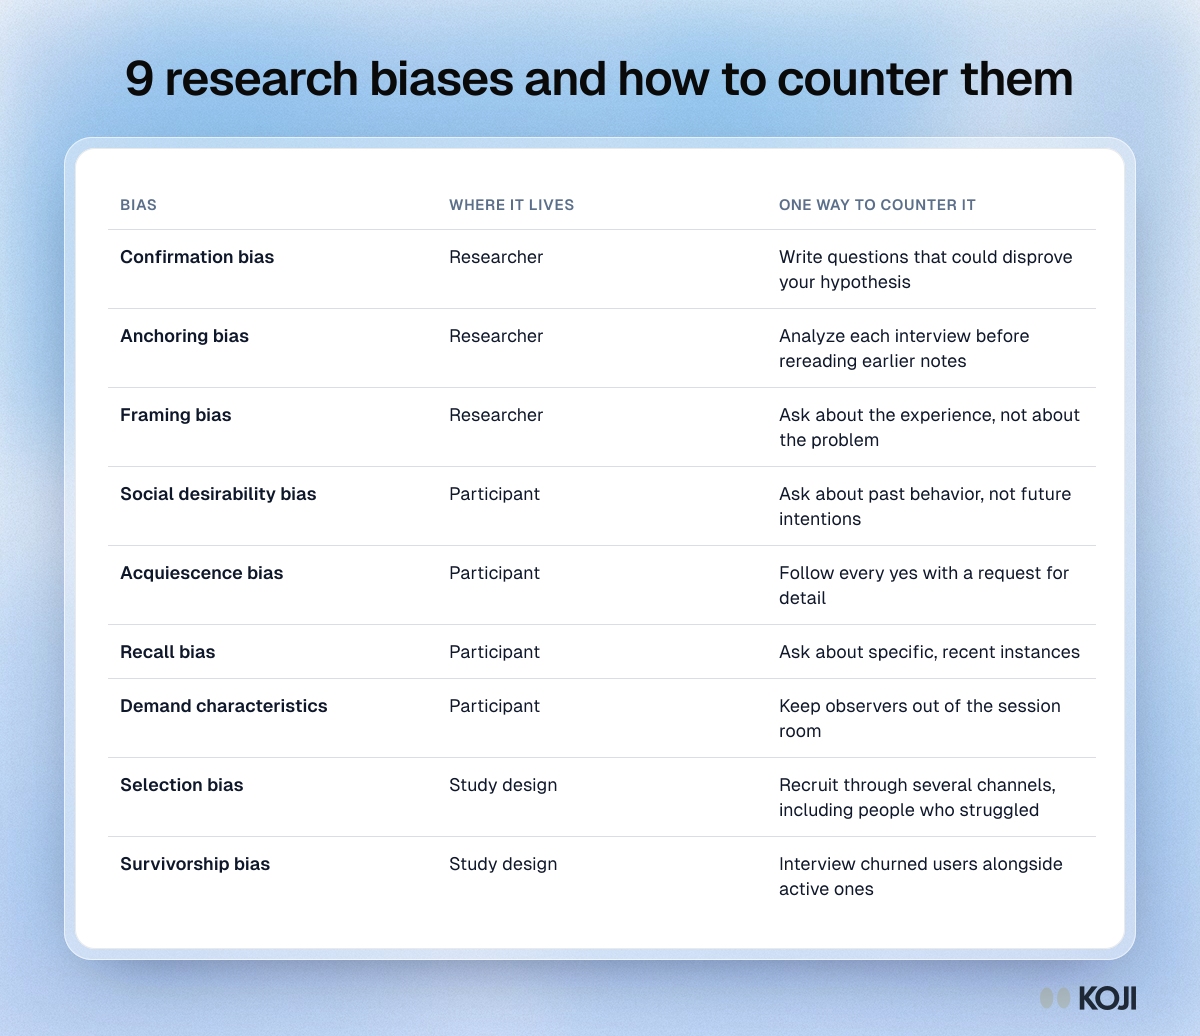
Table of nine research biases, grouped by researcher, participant and study design, with one way to counter each in user research.

Reference table

9 research biases and how to counter them
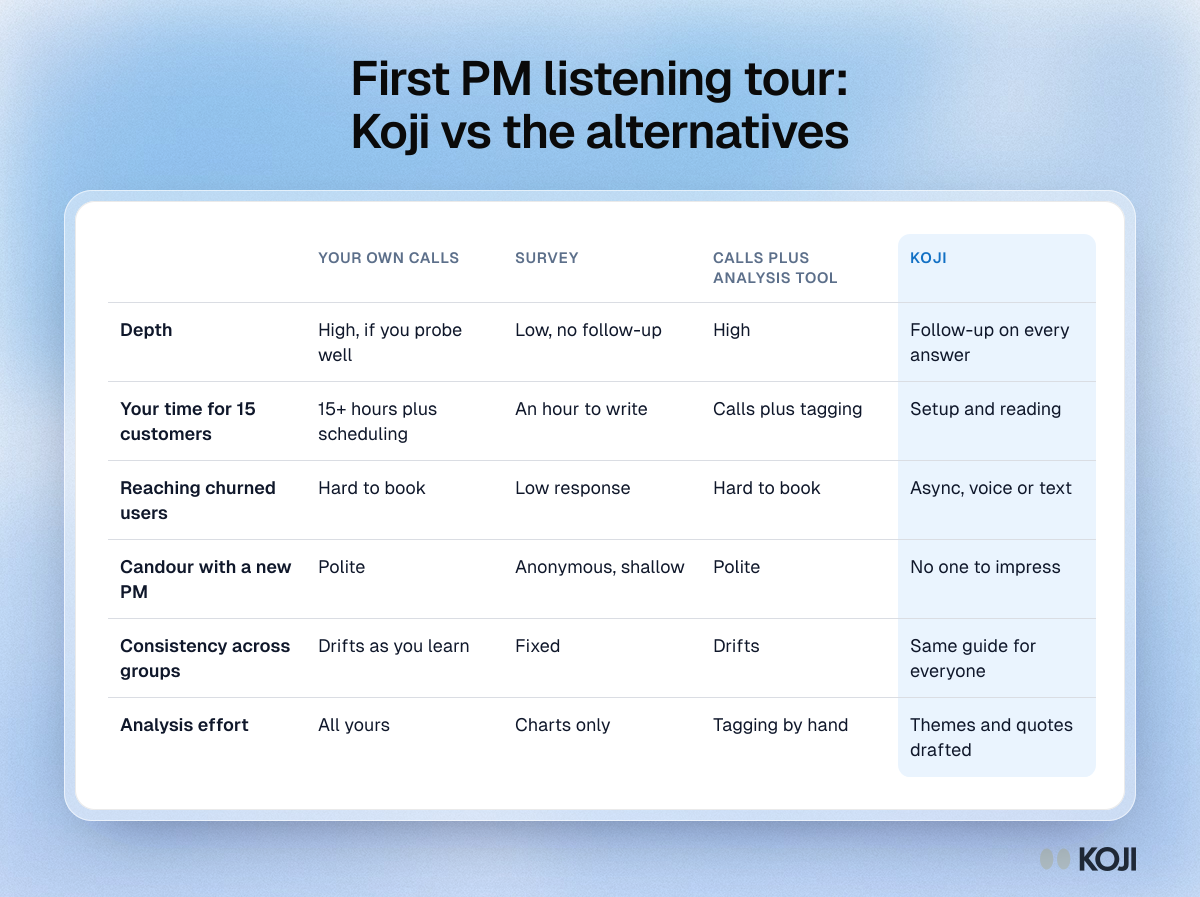
Comparison table of a first PM's listening tour options: own calls, survey, own calls plus an analysis tool, and Koji, on depth, time, reach and analysis

Reference table

First PM listening tour: Koji vs the alternatives
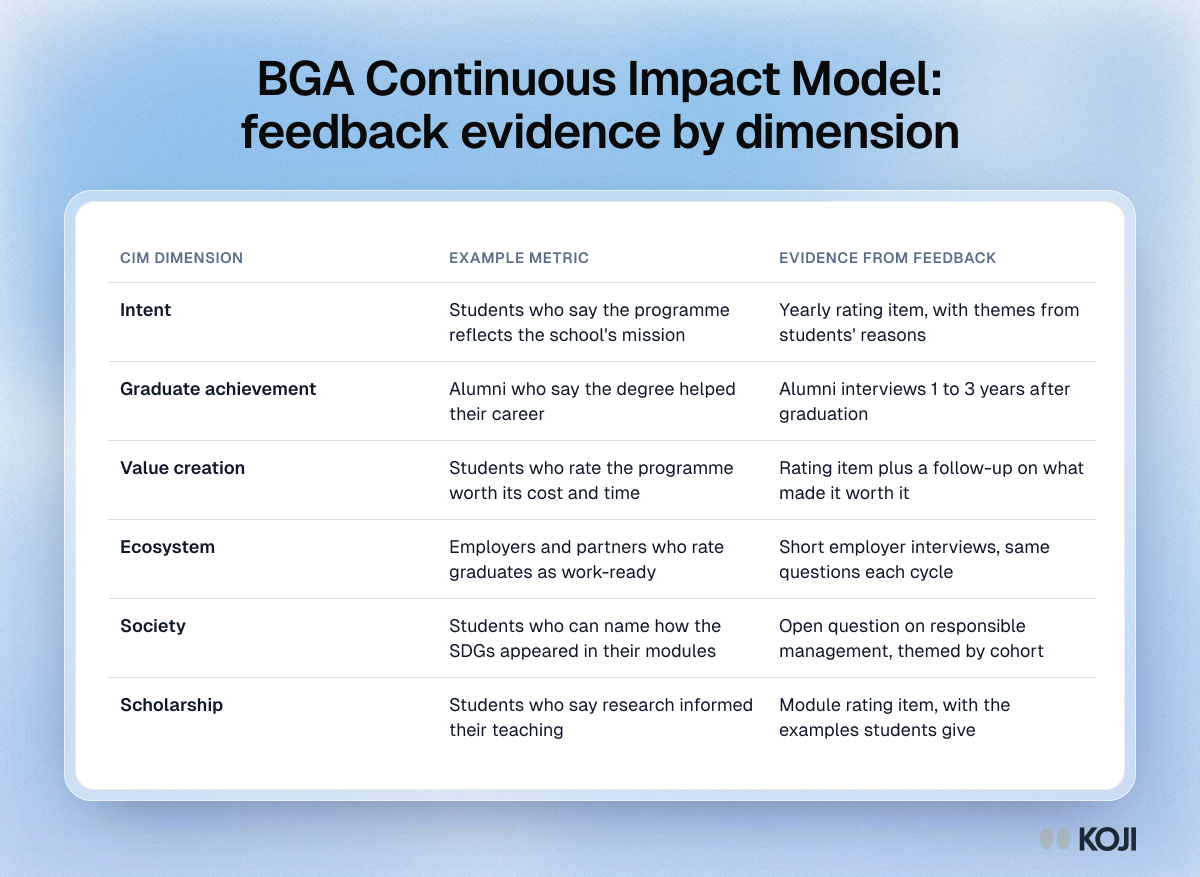
Table mapping the six BGA Continuous Impact Model dimensions to an example metric and the feedback evidence that supports each

Reference table

BGA Continuous Impact Model: feedback evidence by dimension
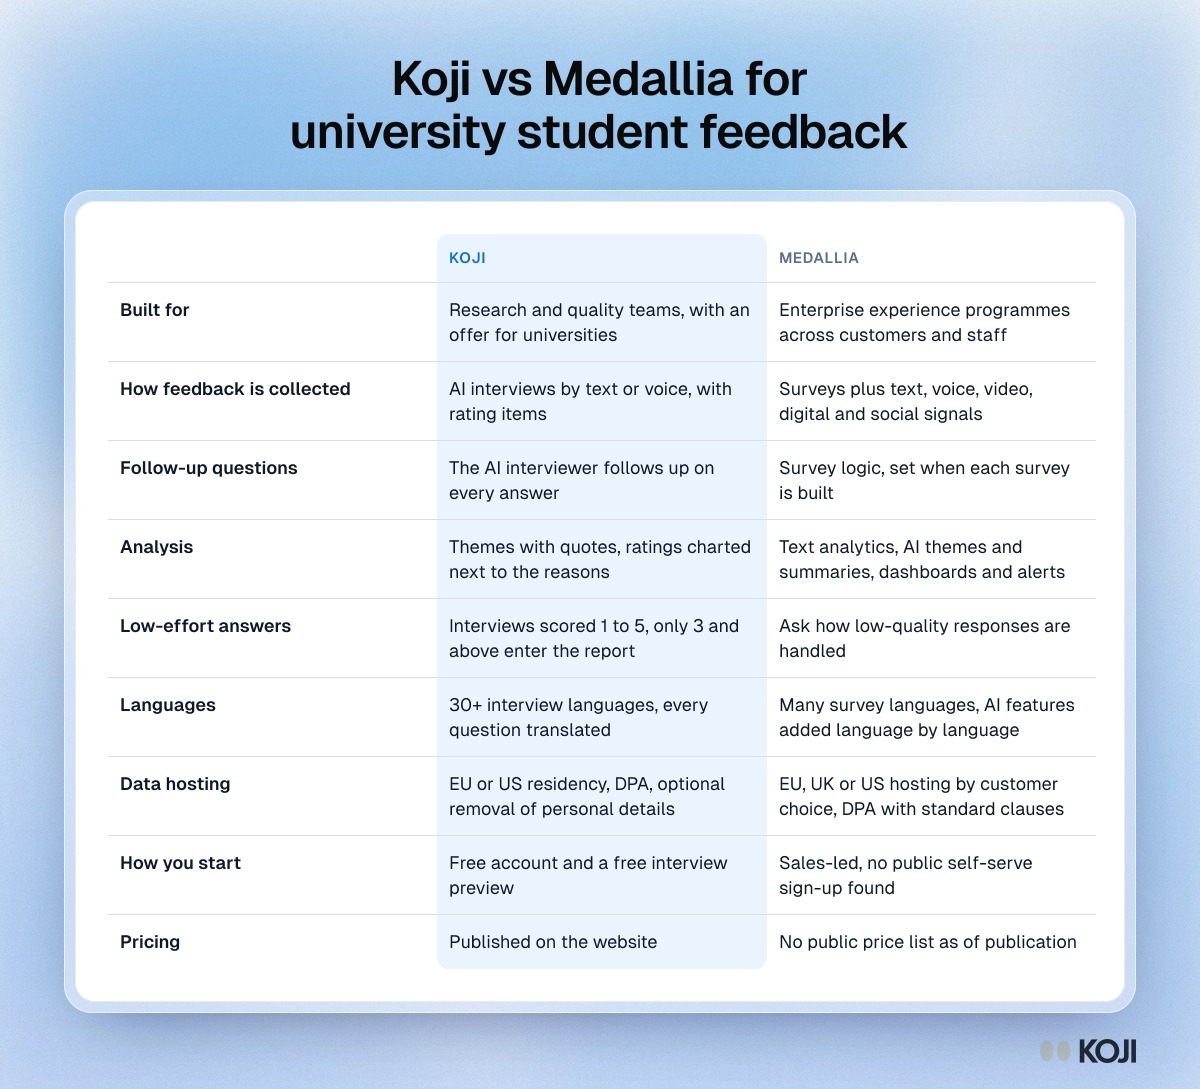
Table comparing Koji and Medallia for university feedback: collection, follow-up questions, analysis, data hosting, how you start and pricing

Reference table

Koji vs Medallia for university student feedback
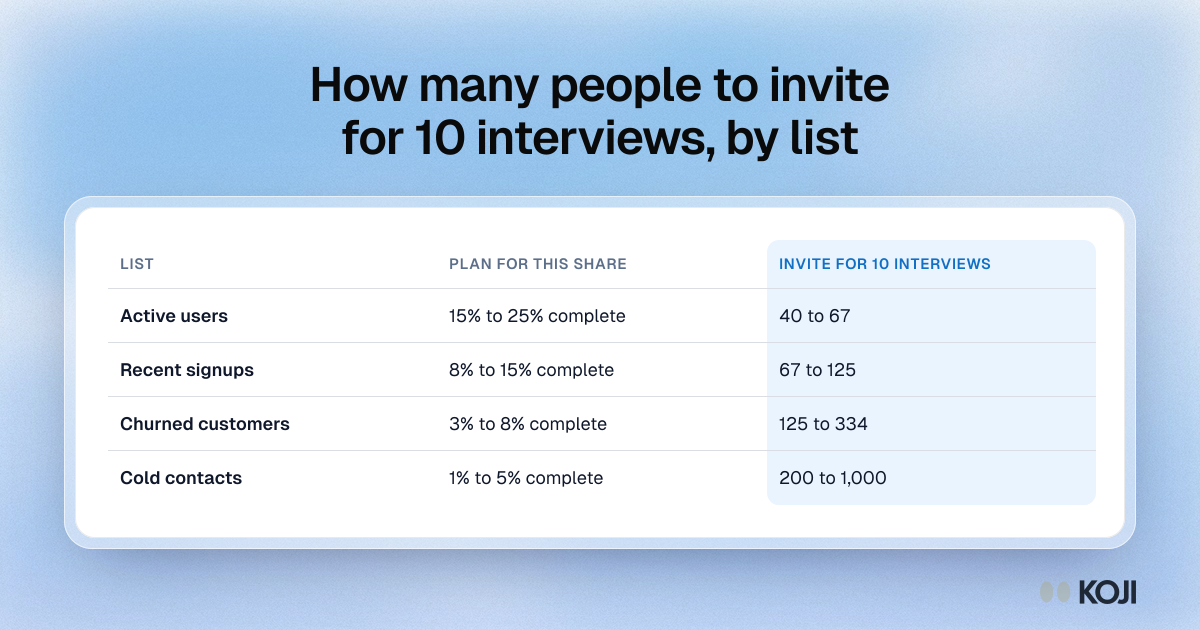
Table of invitations needed for 10 interviews by list: active users 40 to 67, recent signups 67 to 125, churned 125 to 334, cold 200 to 1,000.

Reference table

How many people to invite for 10 interviews, by list
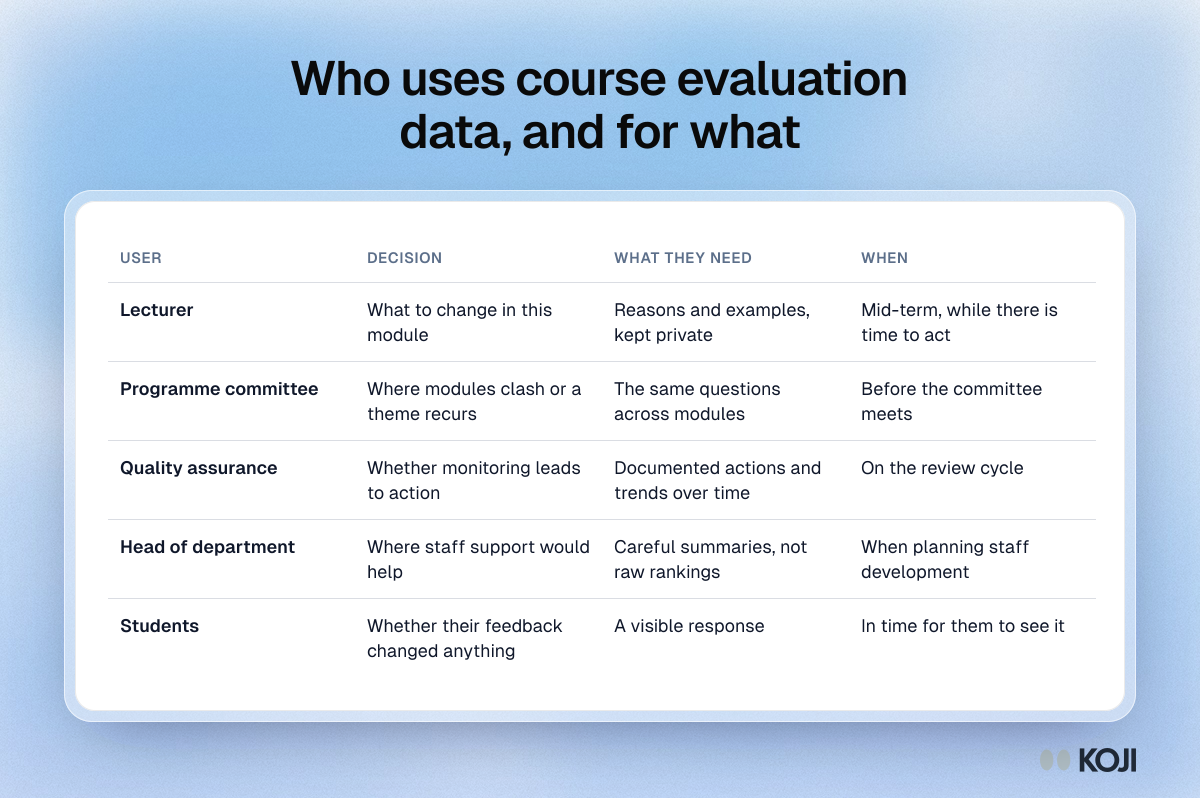
Table of five users of course evaluation data, from lecturers to students, with the decision each makes, what they need and when.

Reference table

Who uses course evaluation data, and for what
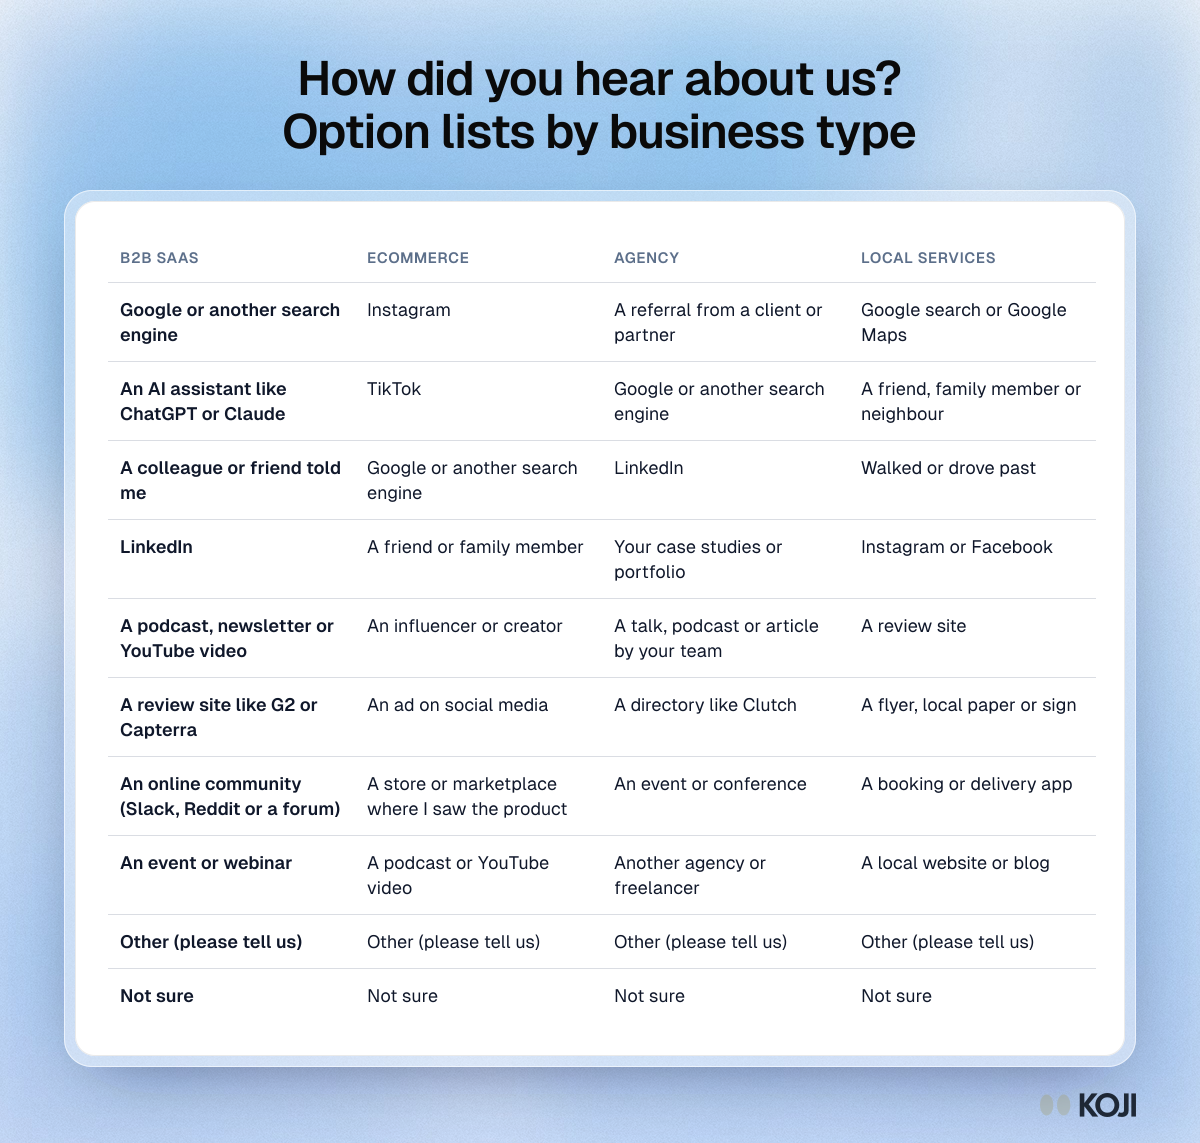
Table of how did you hear about us answer options for four business types: B2B SaaS, ecommerce, agencies and local services, ending with Other and Not sure.

Reference table

How did you hear about us? Option lists by business type
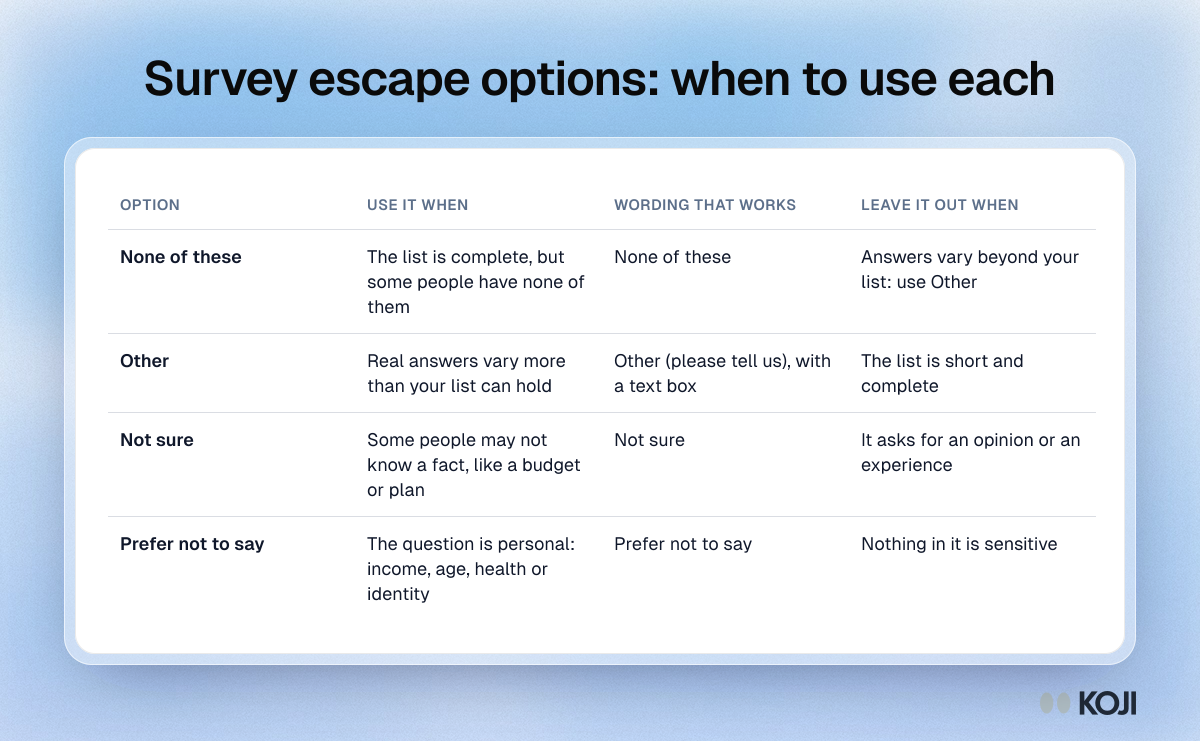
Table of four escape options: None of these, Other, Not sure and Prefer not to say, with when to use each, wording that works and when to leave it out.

Reference table

Survey escape options: when to use each
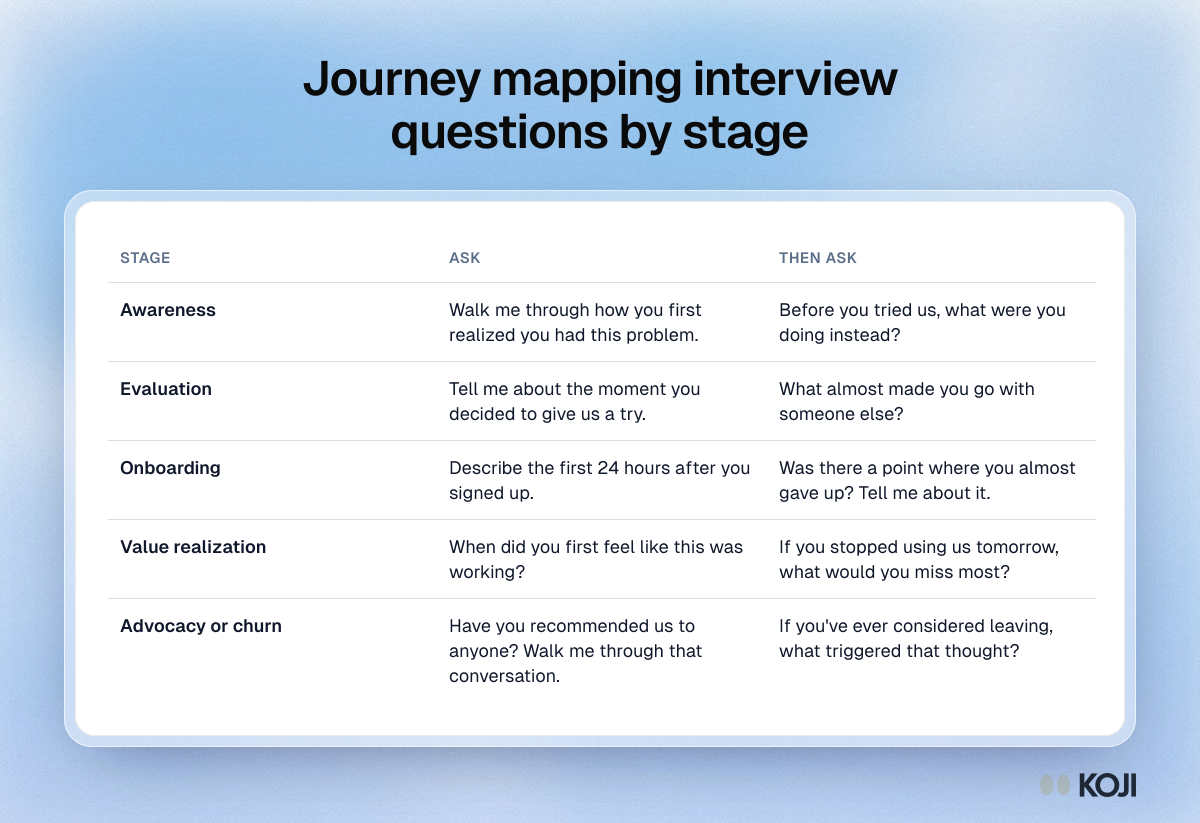
Table of ten journey mapping interview questions, two for each stage from awareness and evaluation to onboarding, value realization and churn.

Reference table

Journey mapping interview questions by stage
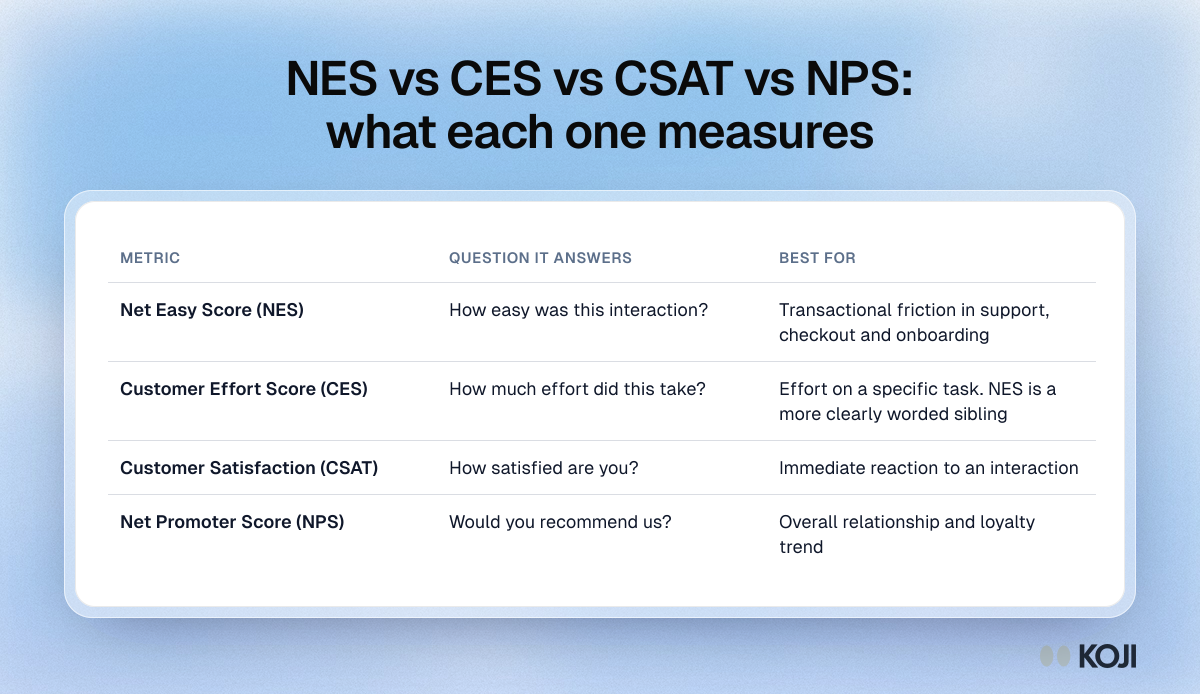
Table comparing four customer experience metrics, Net Easy Score, Customer Effort Score, CSAT and NPS, by the question each answers and its best use.

Reference table

NES vs CES vs CSAT vs NPS: what each one measures
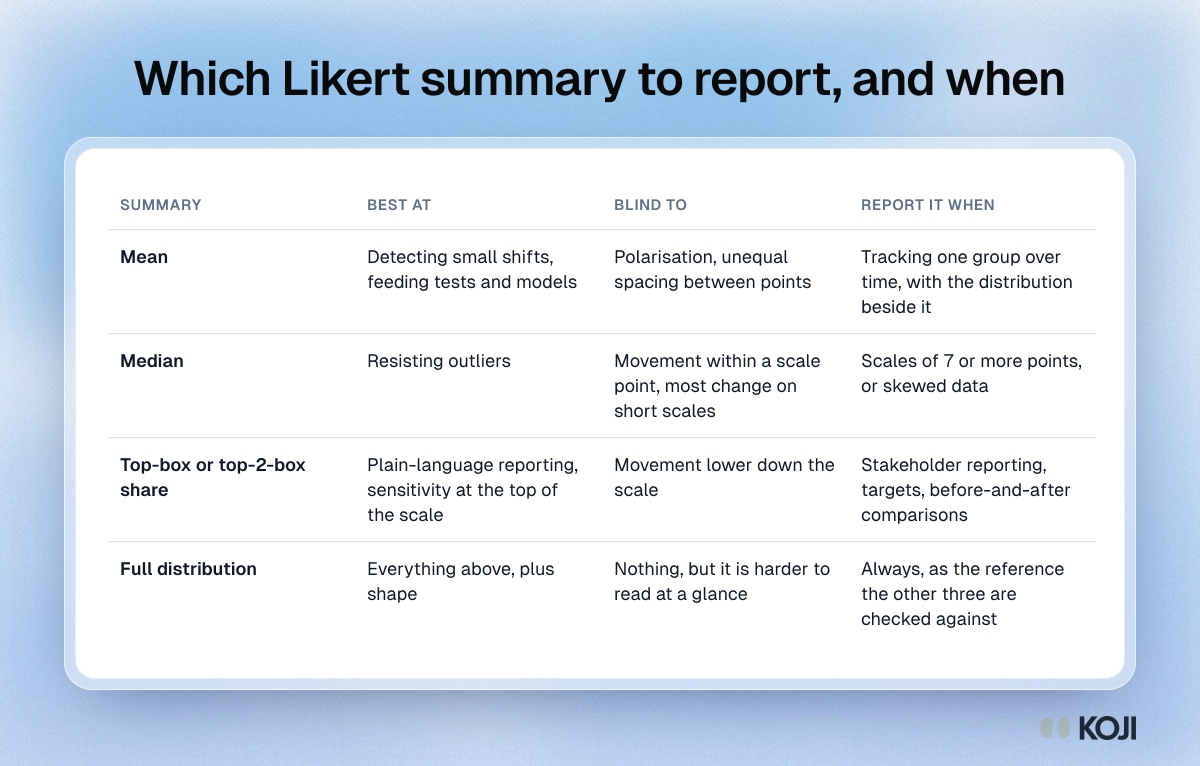
Table comparing four ways to summarise Likert data, the mean, median, top-box share and full distribution, by what each catches and misses.

Reference table

Which Likert summary to report, and when
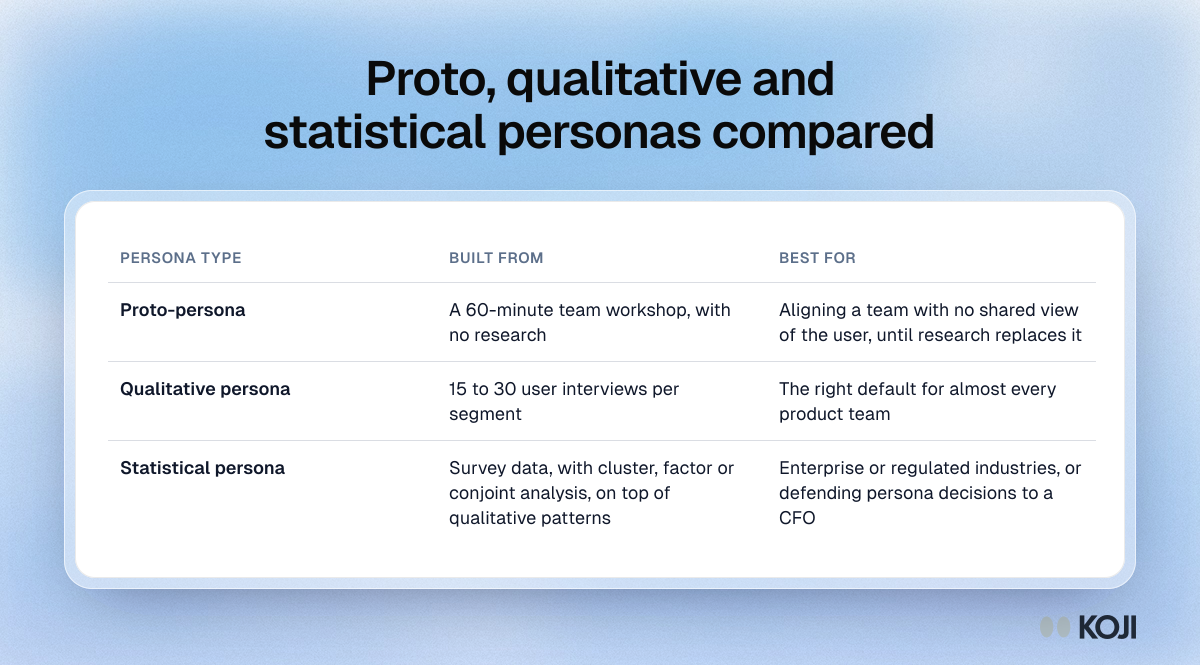
Table comparing three kinds of user persona, proto, qualitative and statistical, by what each is built from and when to use it.

Reference table

Proto, qualitative and statistical personas compared
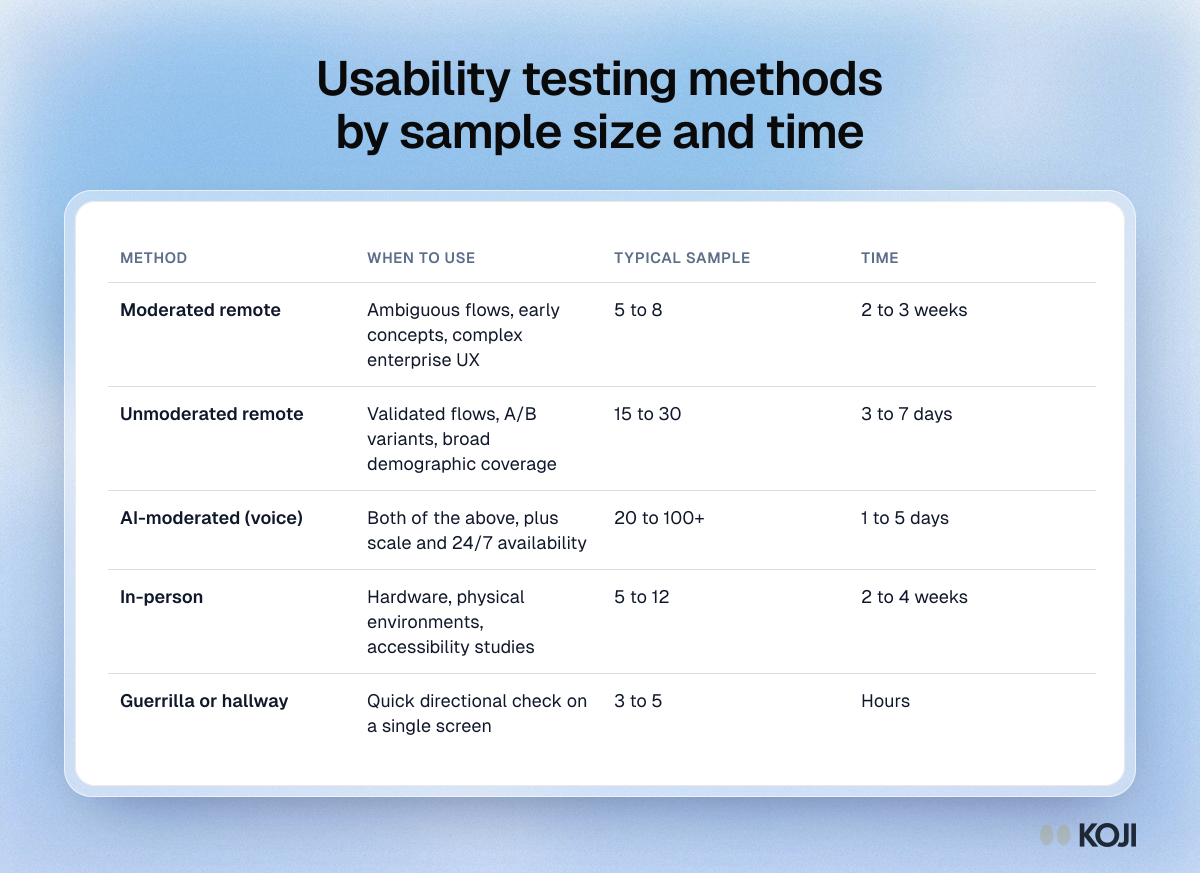
Table comparing five usability testing methods by when to use each, typical sample size and time, from moderated remote to hallway tests.

Reference table

Usability testing methods by sample size and time
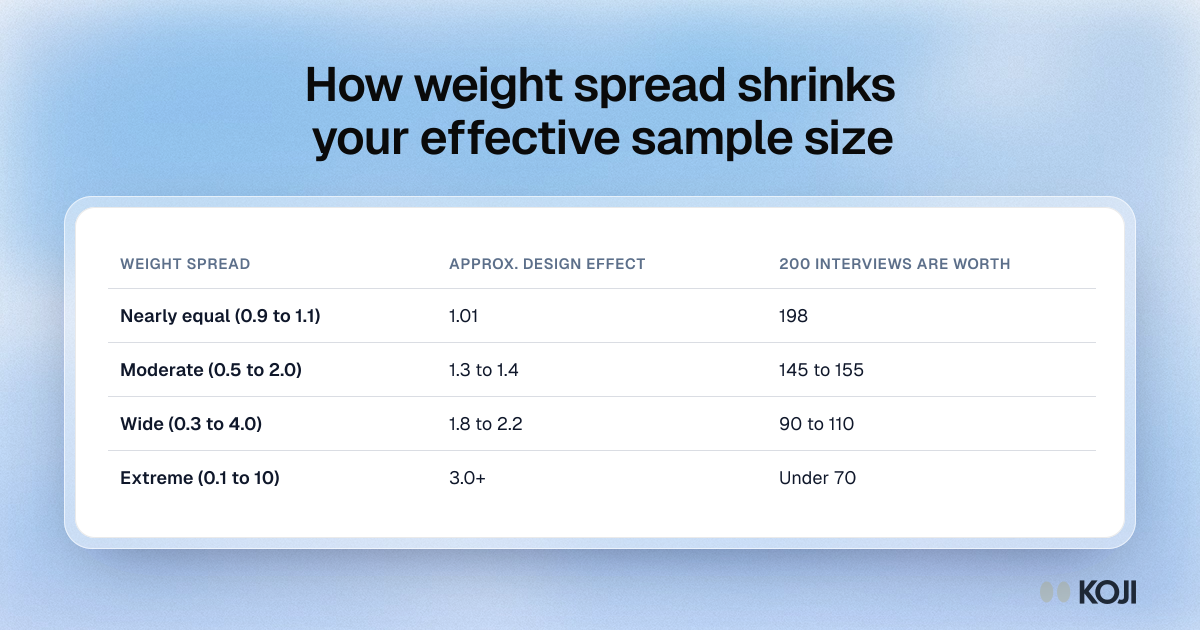
Table of weight spread against design effect: nearly equal weights keep 198 of 200 interviews, while extreme weights leave the precision of fewer than 70.

Reference table

How weight spread shrinks your effective sample size
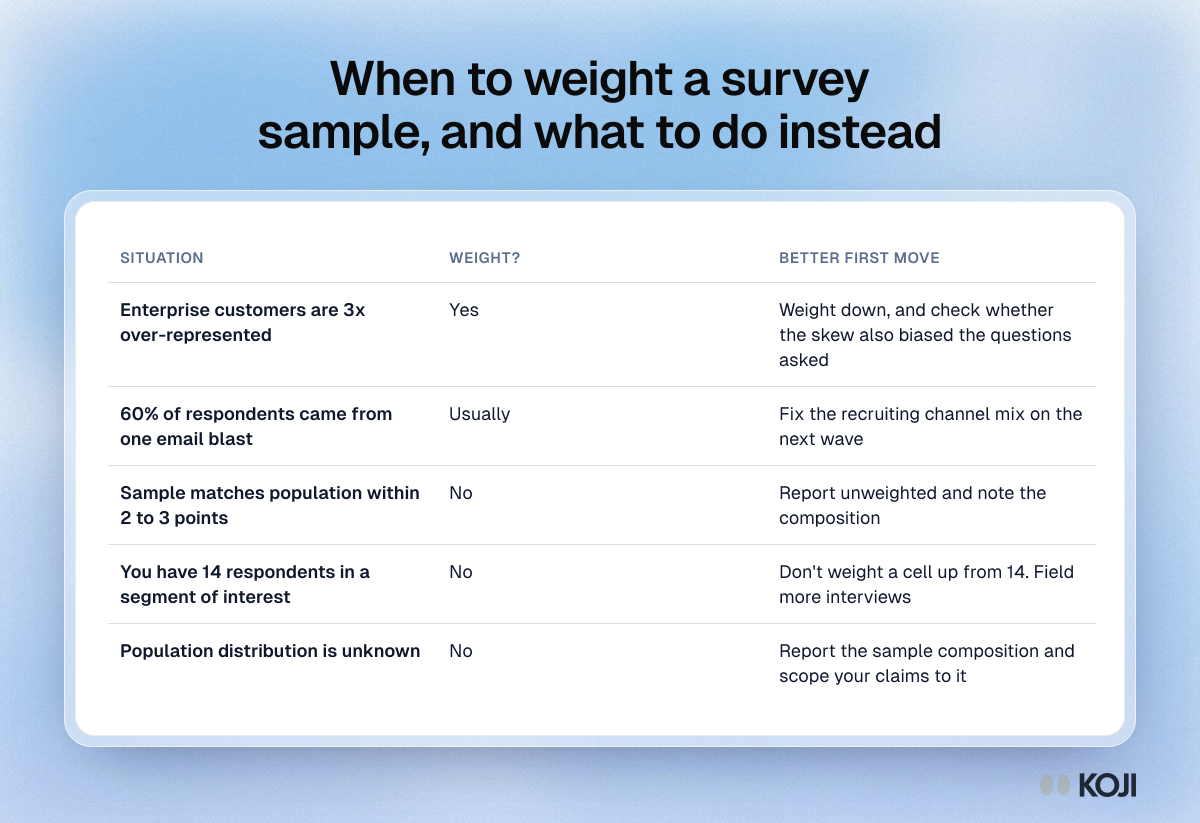
Table of five survey situations, from over-represented enterprise customers to an unknown population, with whether to weight and the better first move.

Reference table

When to weight a survey sample, and what to do instead
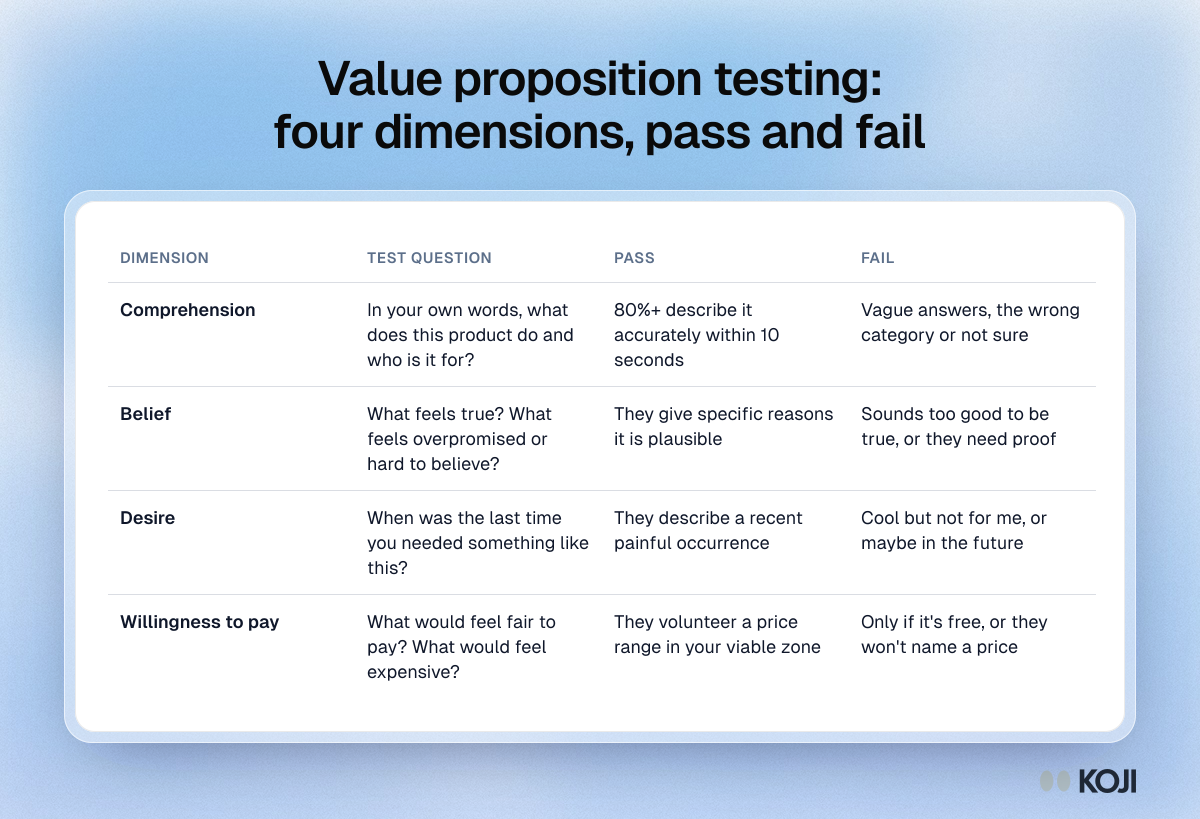
Table of four value proposition test dimensions, comprehension, belief, desire and willingness to pay, with a test question and pass and fail signs.

Reference table

Value proposition testing: four dimensions, pass and fail
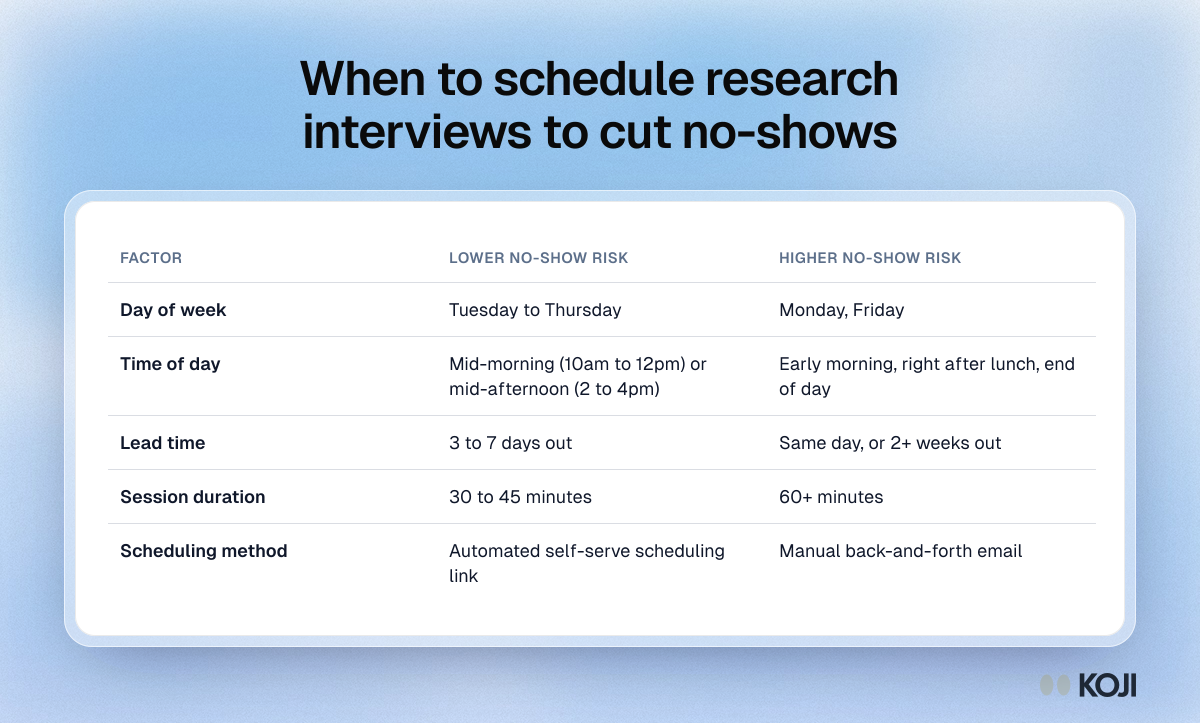
Table comparing lower and higher no-show risk for research interviews by day of week, time of day, lead time, session length and scheduling method.

Reference table

When to schedule research interviews to cut no-shows
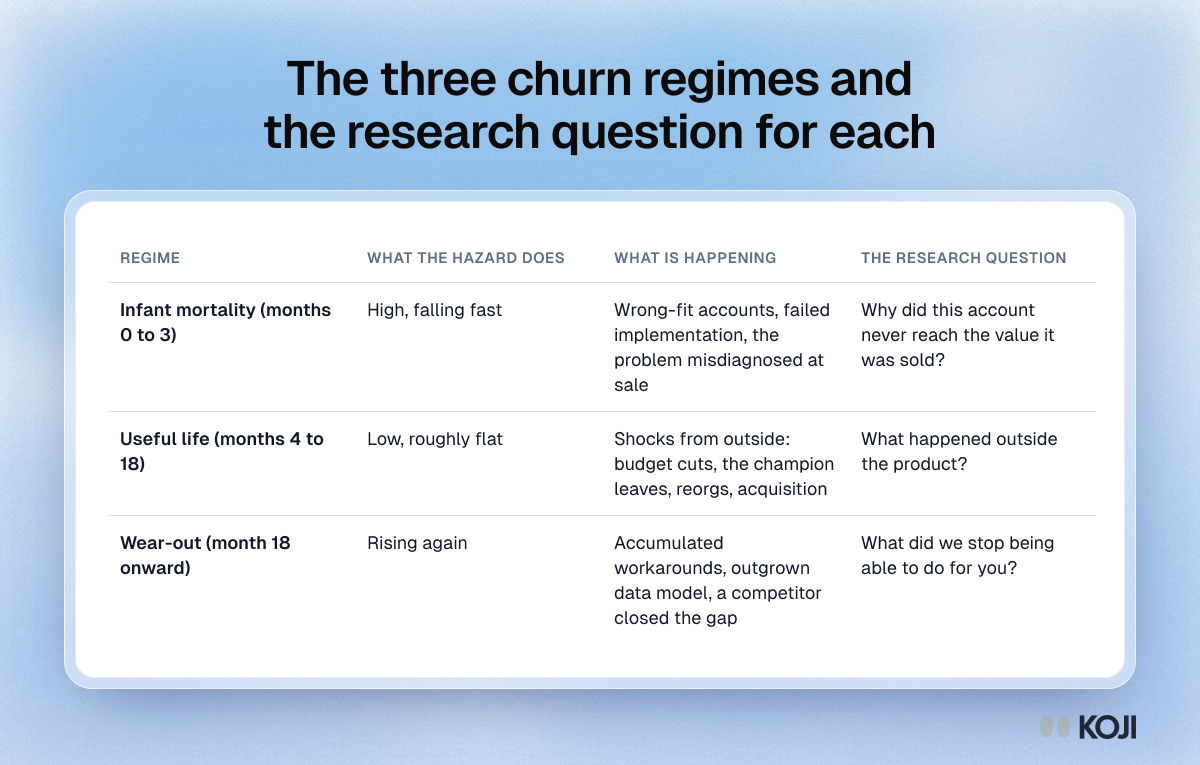
Table of three churn hazard regimes: infant mortality in months 0 to 3, useful life in months 4 to 18 and wear-out after 18, with causes and research questions.

Reference table

The three churn regimes and the research question for each
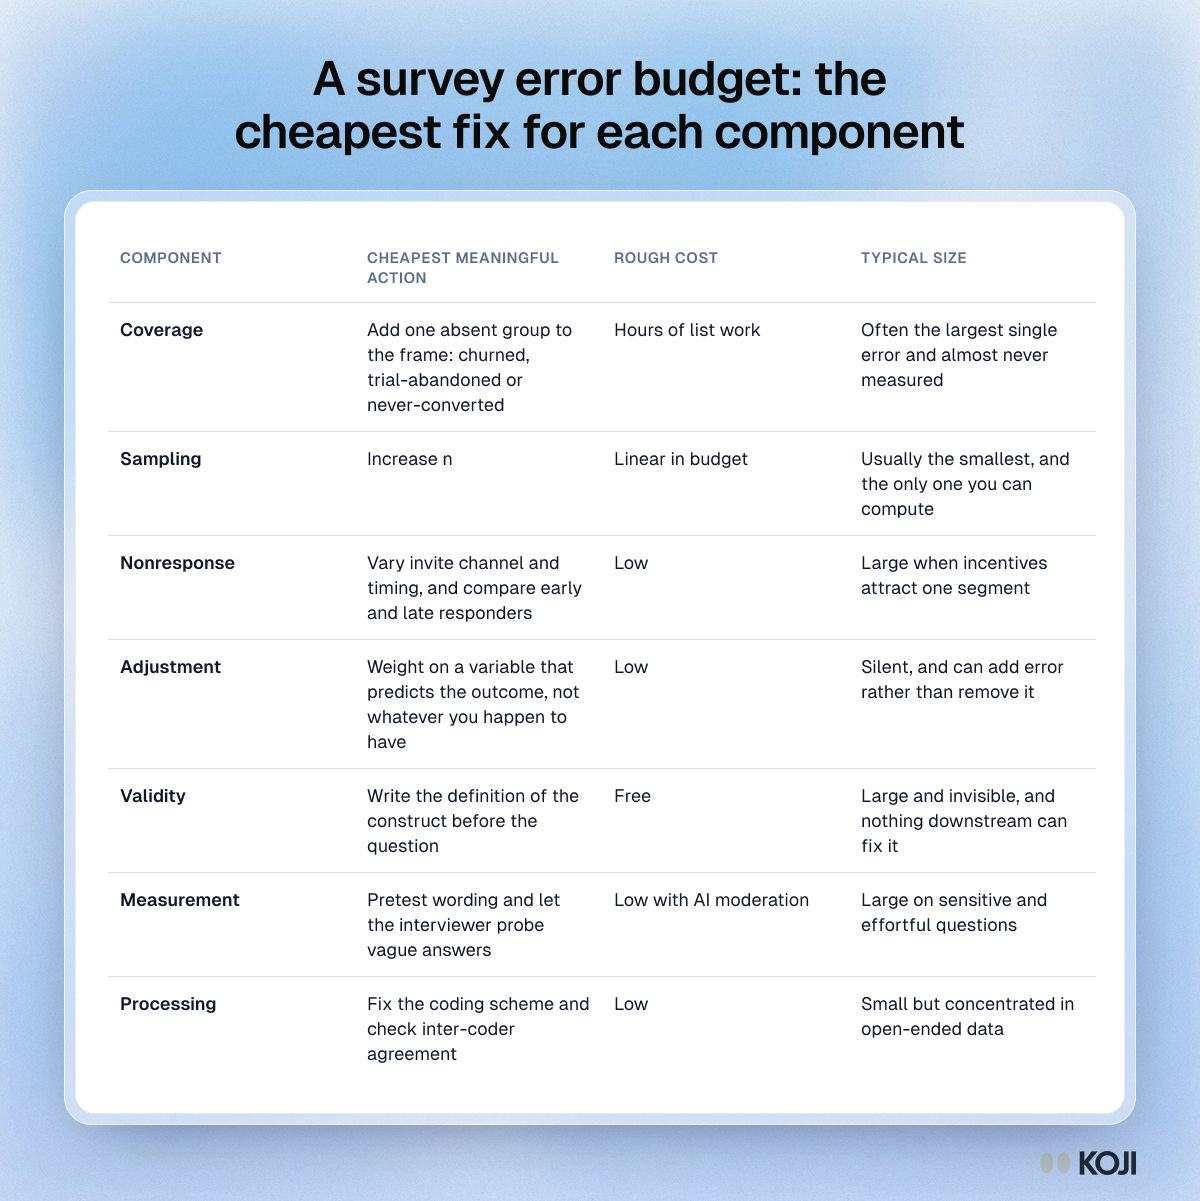
Table of a survey error budget listing the cheapest action, rough cost and typical size of each of the seven total survey error components in product research.

Reference table

A survey error budget: the cheapest fix for each component
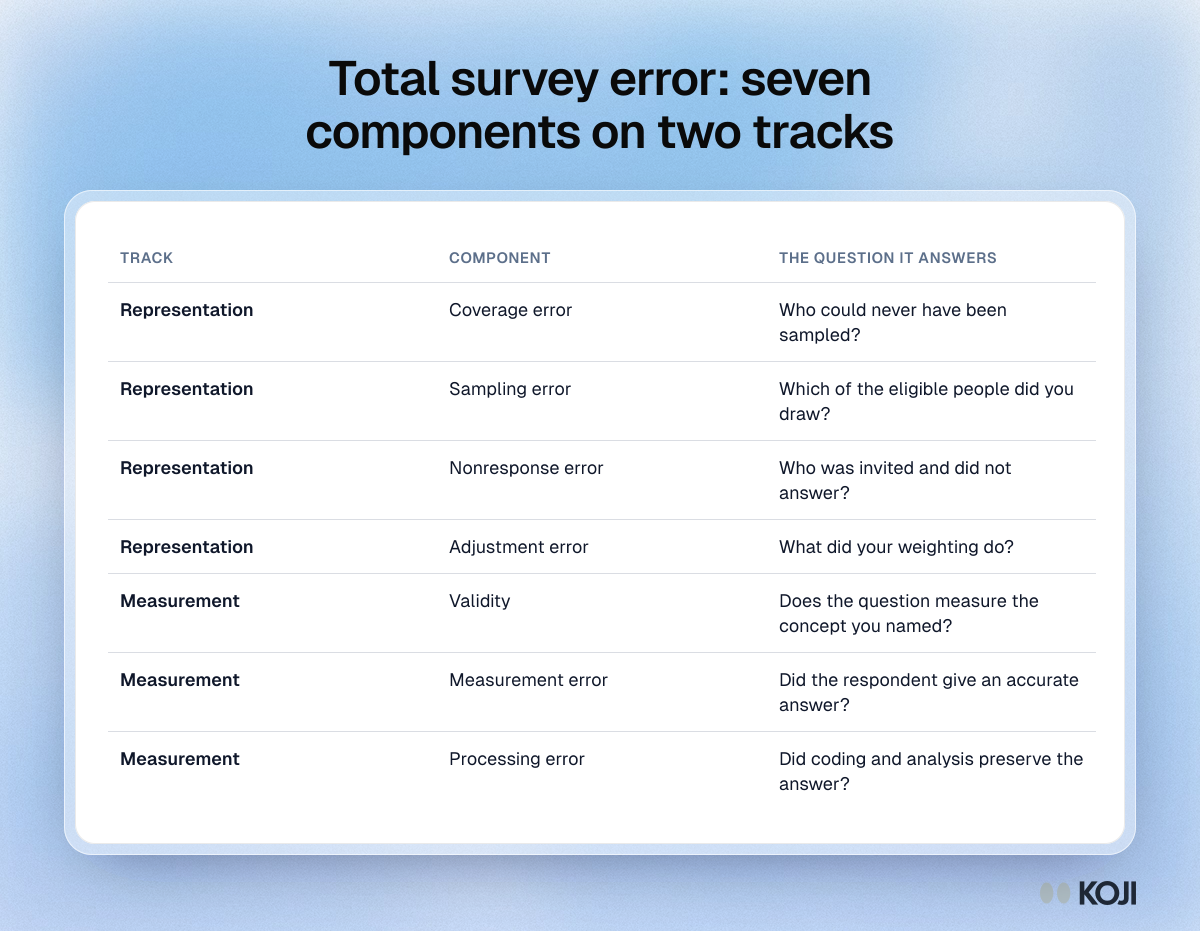
Table of the seven parts of total survey error: coverage, sampling, nonresponse and adjustment, then validity, measurement and processing.

Reference table

Total survey error: seven components on two tracks
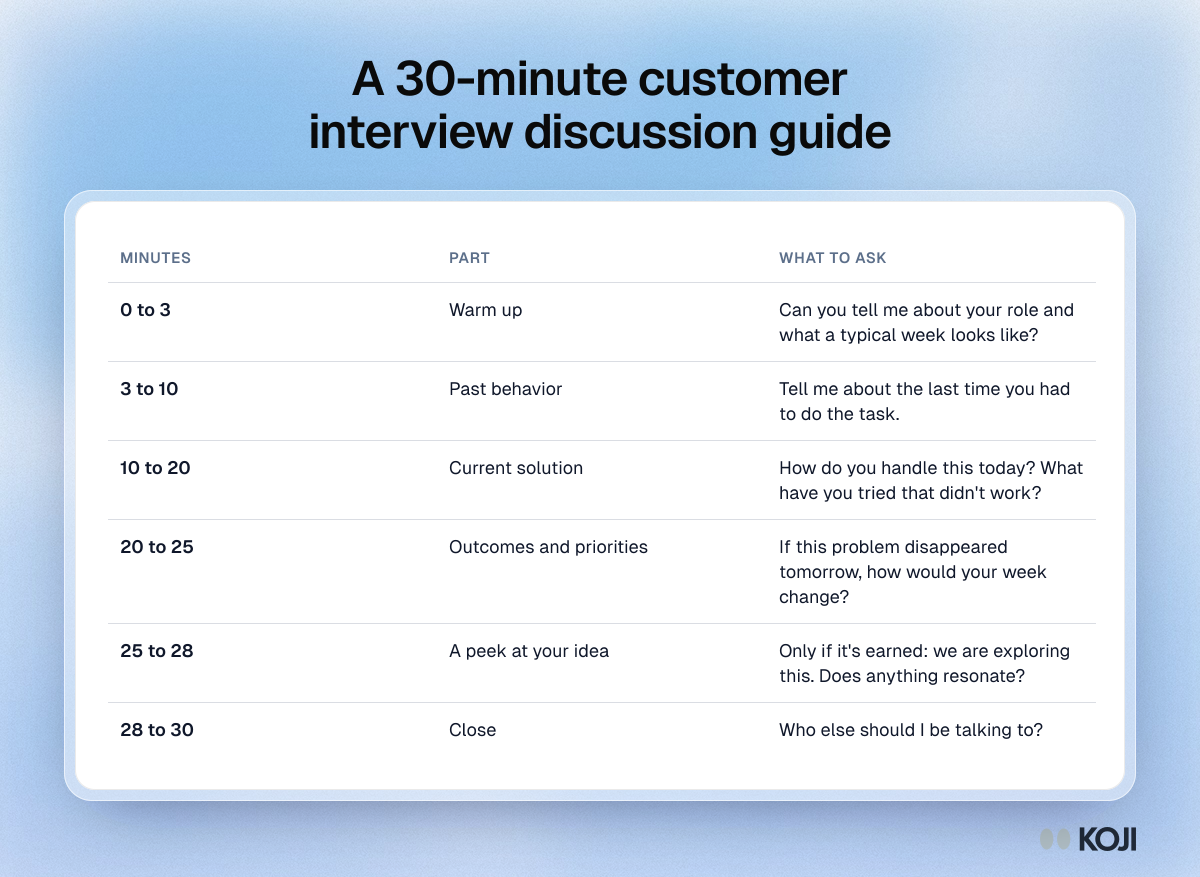
Table of a 30-minute customer interview guide with timings: warm up, past behavior, current solution, outcomes, a peek at your idea and the close.

Reference table

A 30-minute customer interview discussion guide
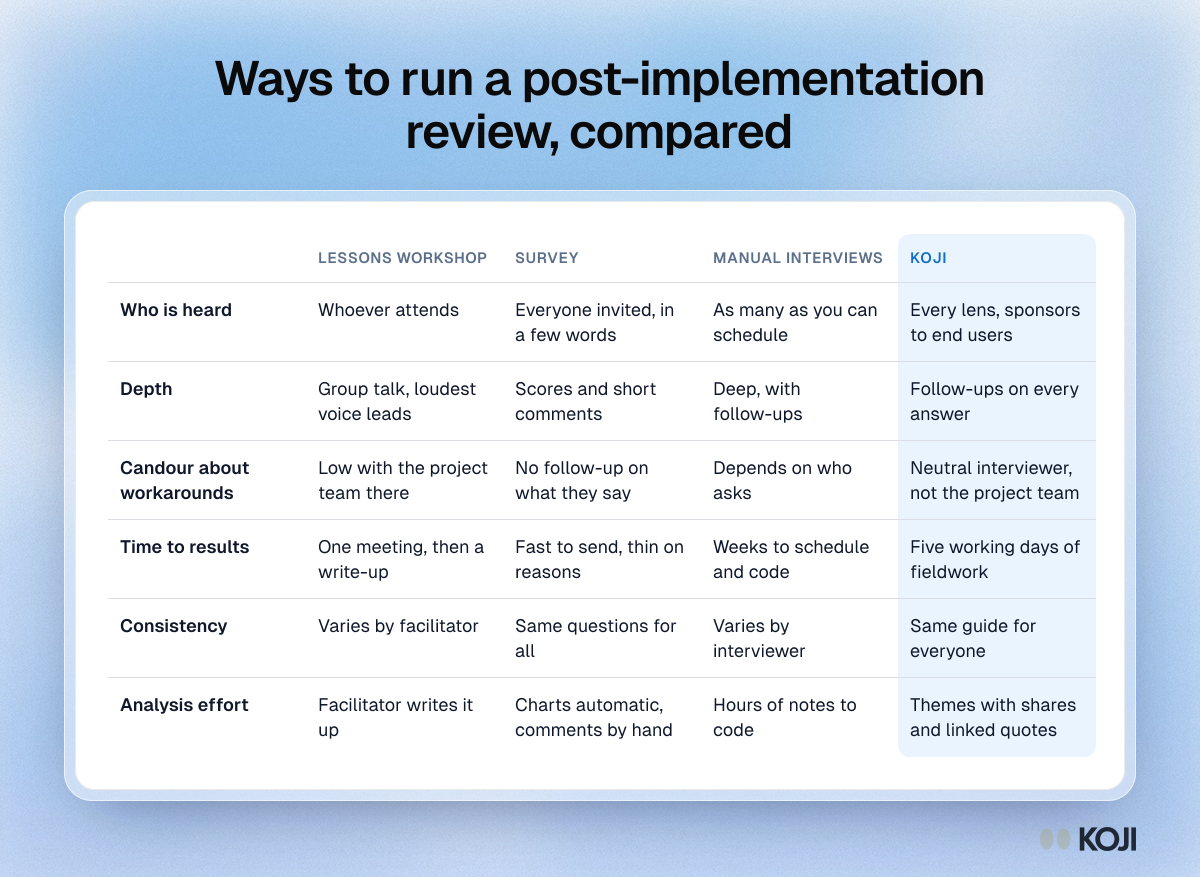
Table comparing a lessons-learned workshop, a survey, manual interviews and Koji for a post-implementation review on reach, depth, candour and analysis effort.

Reference table

Ways to run a post-implementation review, compared
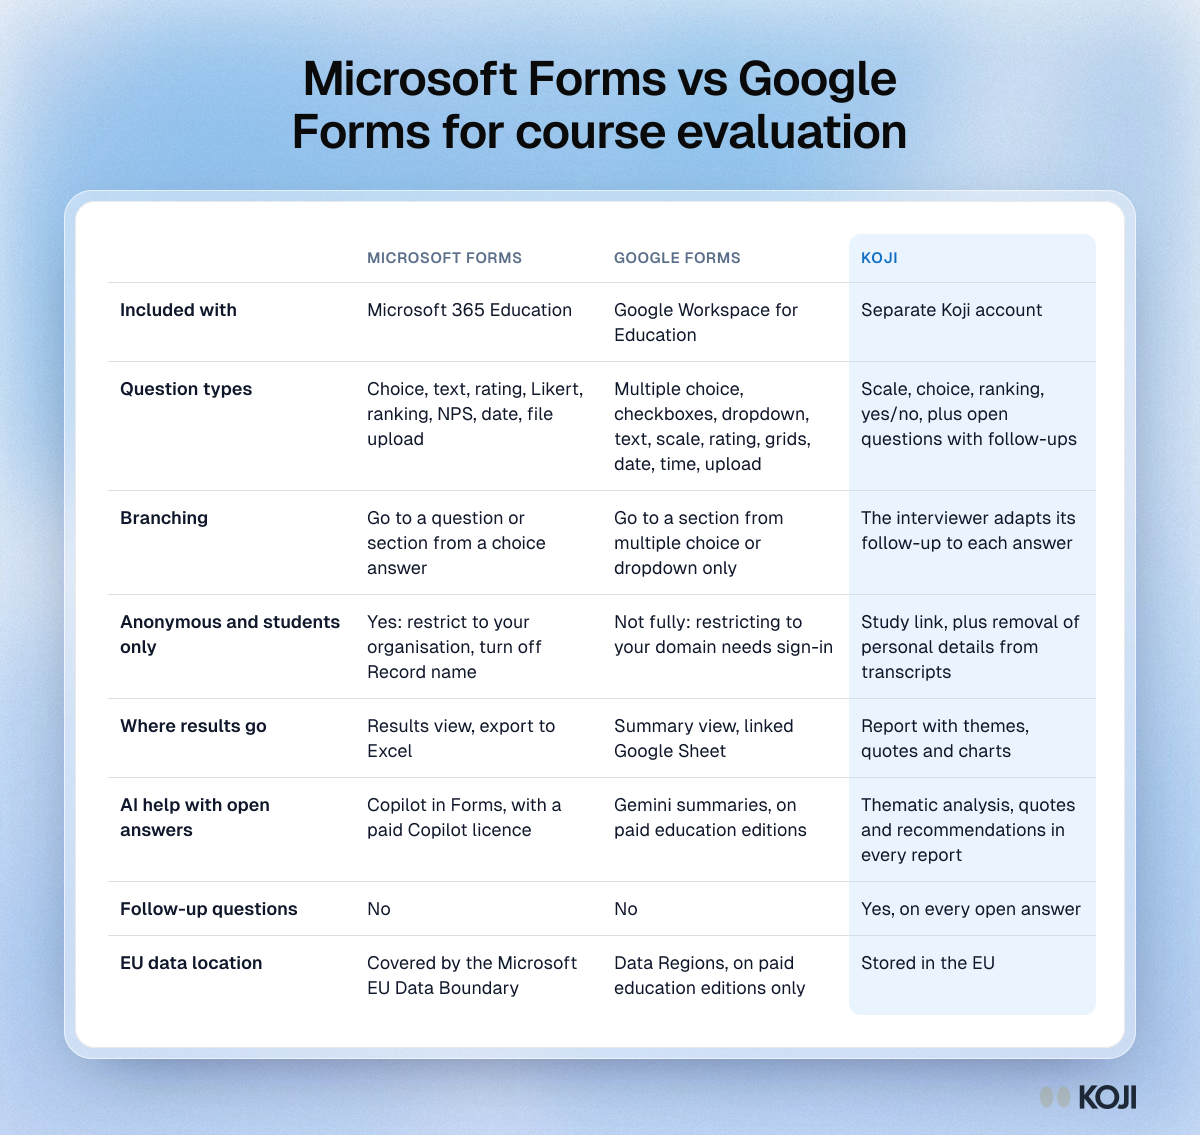
Table comparing Microsoft Forms, Google Forms and Koji for course evaluation on eight points, from question types to EU data location.

Reference table

Microsoft Forms vs Google Forms for course evaluation
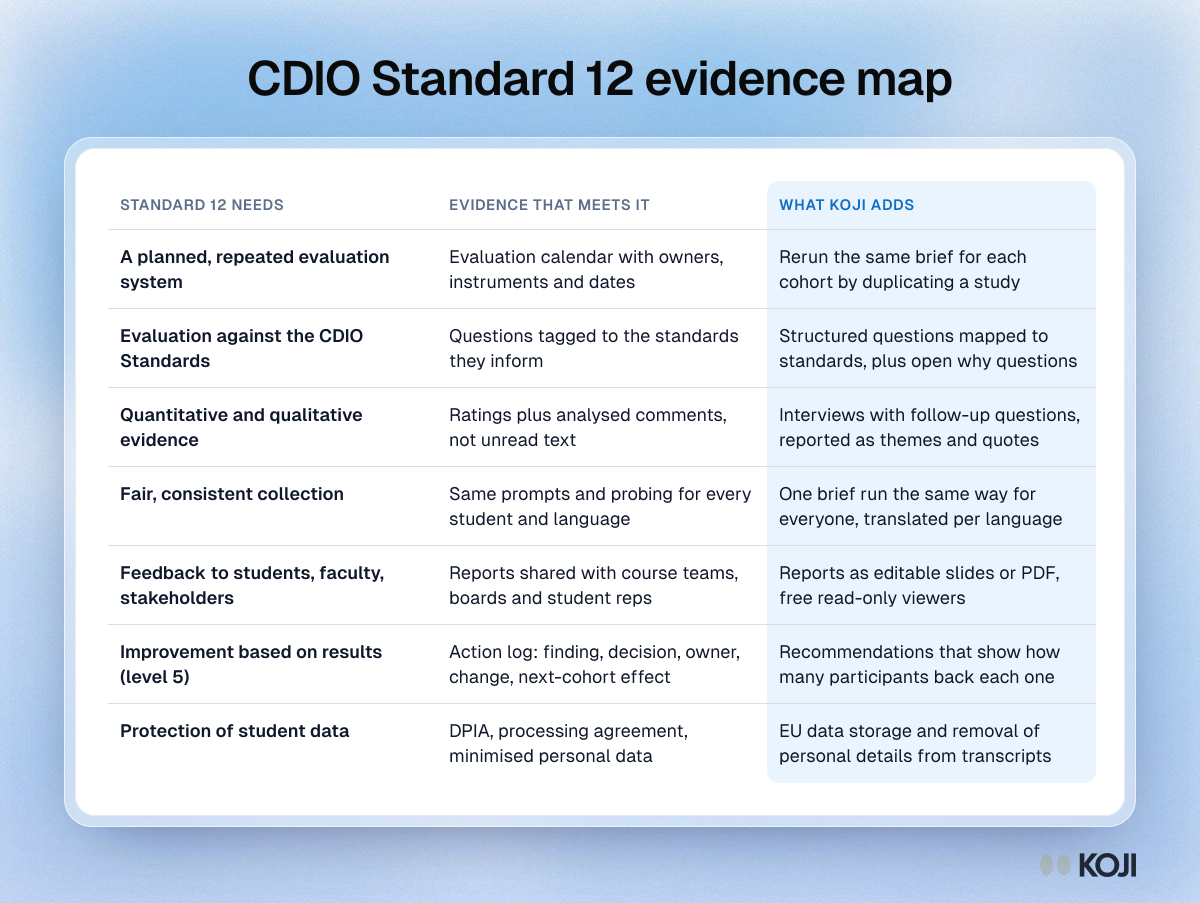
Table mapping seven CDIO Standard 12 requirements to the evidence that meets each one and what Koji adds, ending with an action log.

Reference table

CDIO Standard 12 evidence map
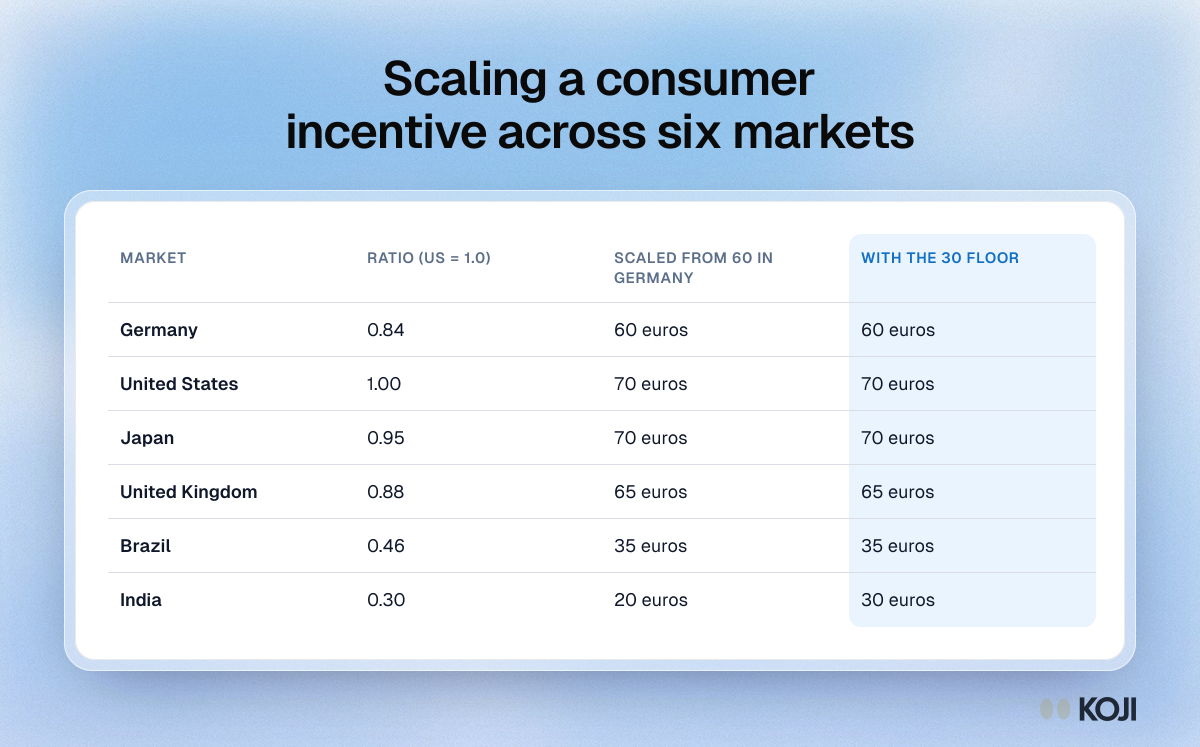
Table showing a worked example of scaling a 60 euro German consumer interview incentive to the US, Japan, UK, Brazil and India with a 30 euro floor

Reference table

Scaling a consumer incentive across six markets
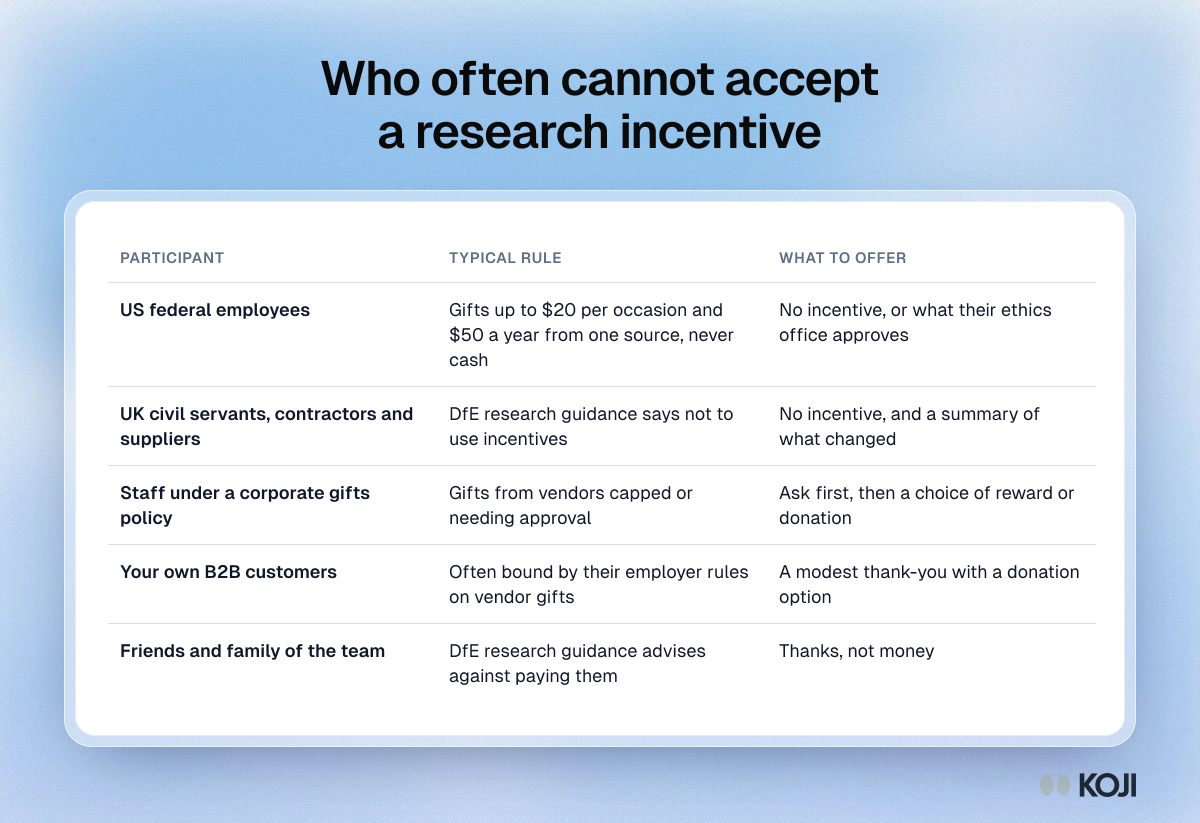
Table of participants who often cannot accept a personal research incentive, the typical rule that applies to them and what to offer instead

Reference table

Who often cannot accept a research incentive
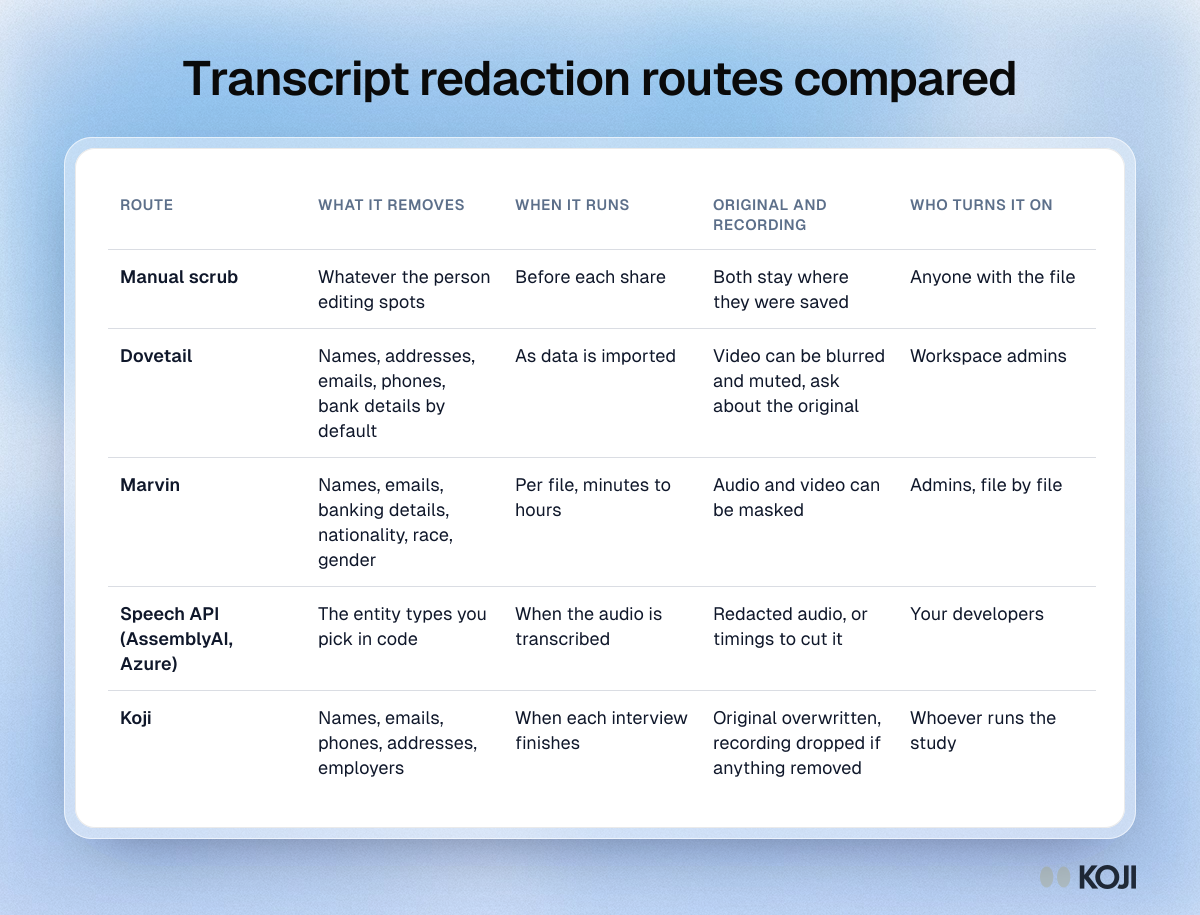
Table comparing manual scrubbing, Dovetail, Marvin, speech APIs and Koji by what each removes, when it runs and what happens to the original

Reference table

Transcript redaction routes compared
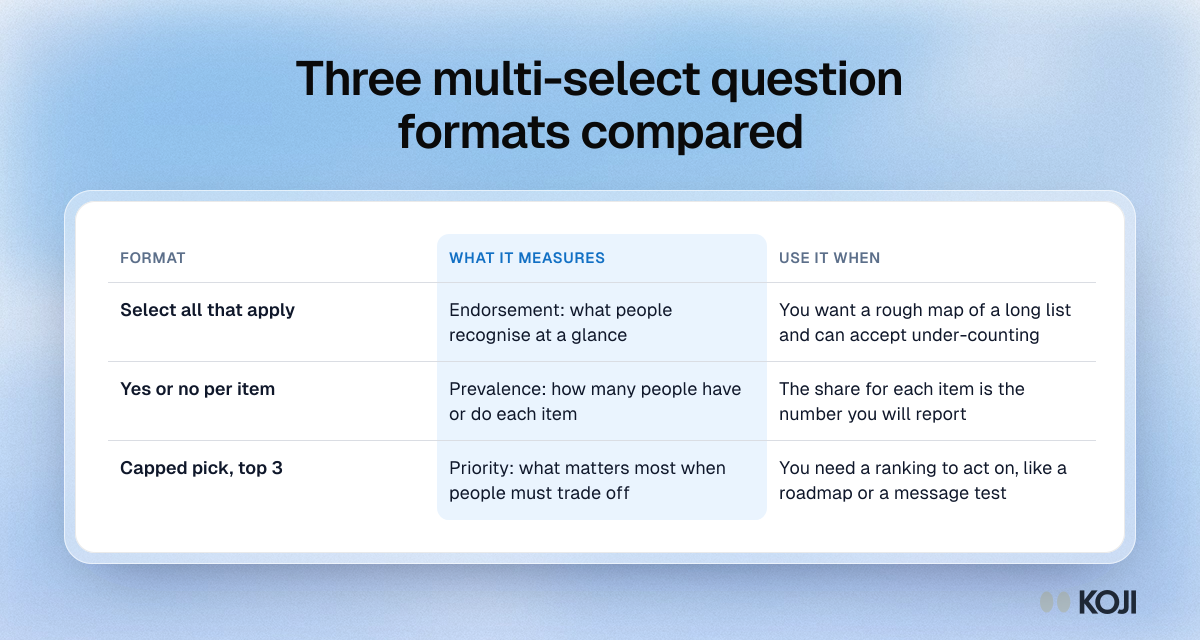
Table comparing three multi-select formats: select all measures endorsement, yes/no per item measures prevalence, a capped top 3 measures priority.

Reference table

Three multi-select question formats compared
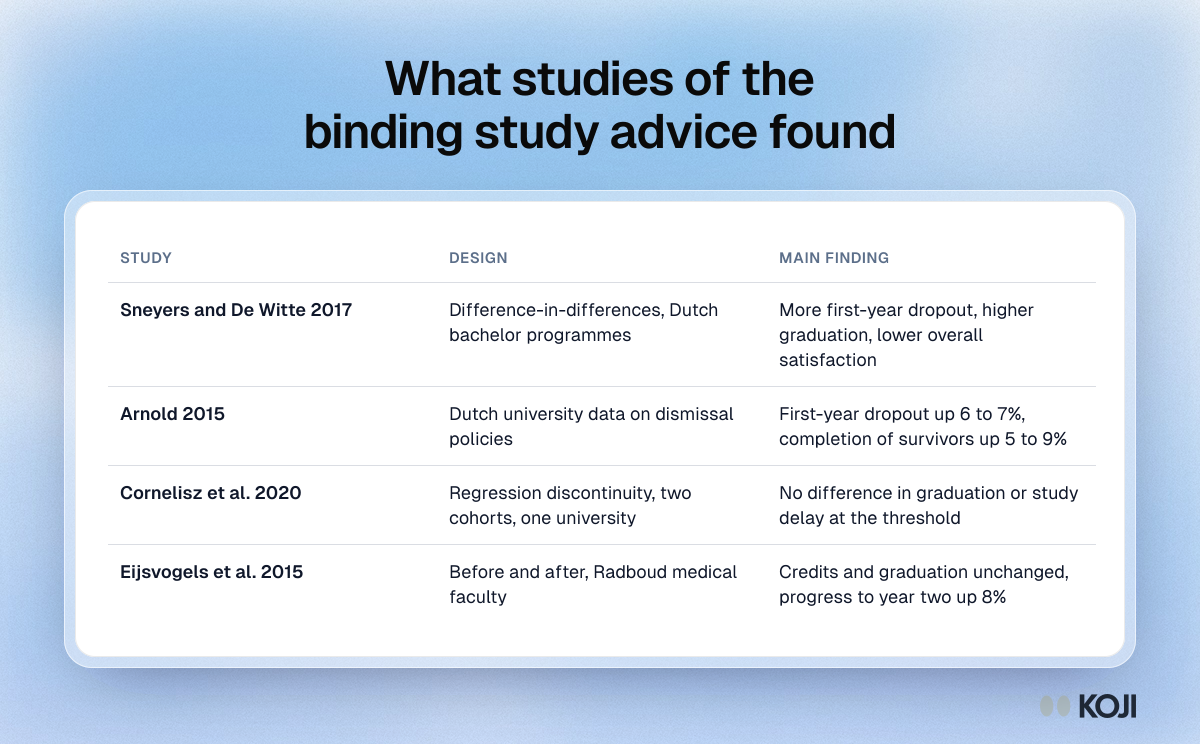
Table comparing four studies of binding study advice in the Netherlands, their designs and their main findings on dropout, graduation and satisfaction.

Reference table

What studies of the binding study advice found
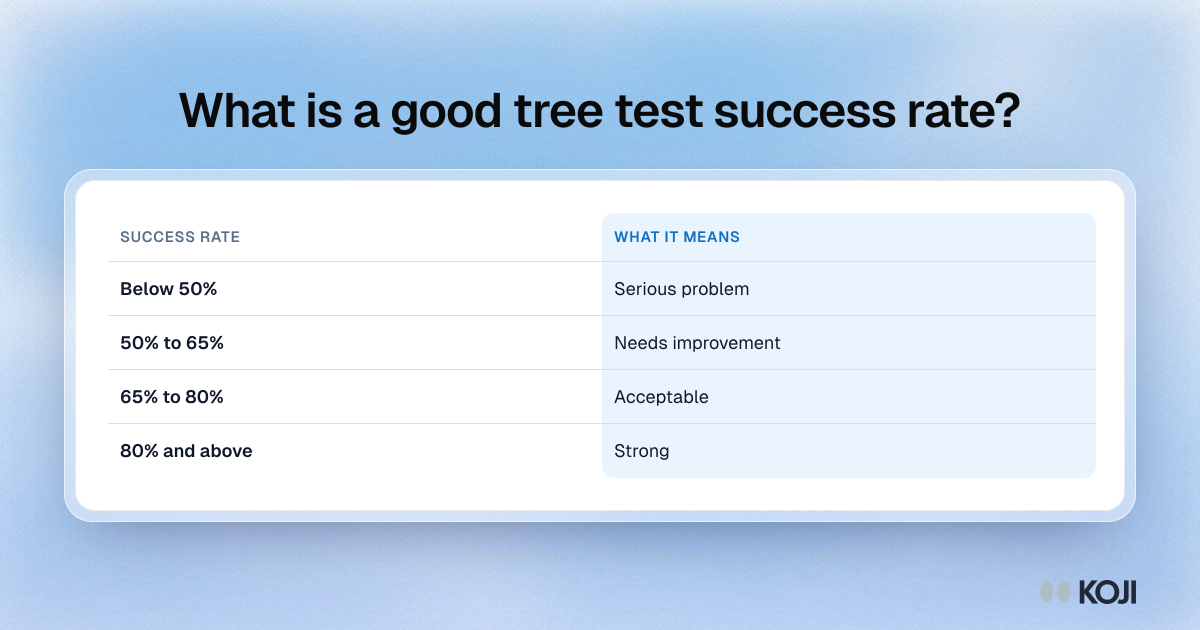
Table of tree test success rate benchmarks: below 50% is a serious problem, 50 to 65% needs work, 65 to 80% is acceptable and 80% or more is strong.

Reference table

What is a good tree test success rate?
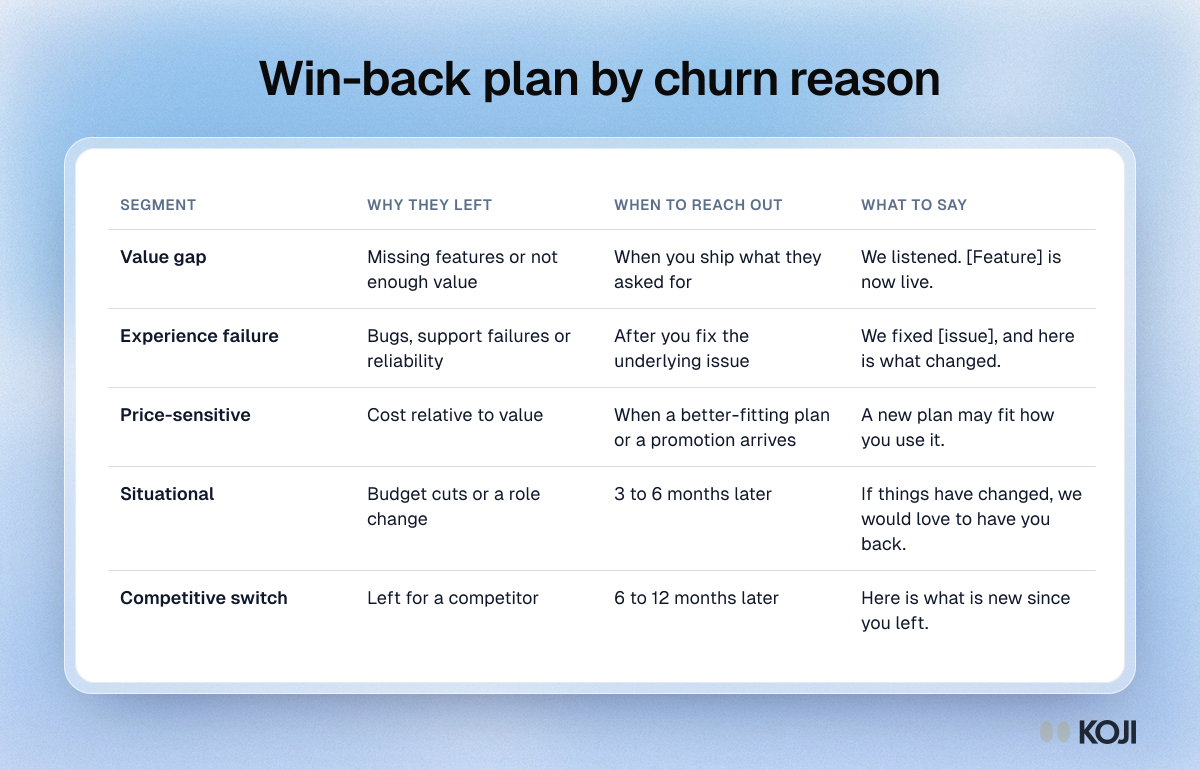
Table of a win-back plan for five churn segments, with why each left, when to reach out and what to say, from value gap to competitive switchers.

Reference table

Win-back plan by churn reason
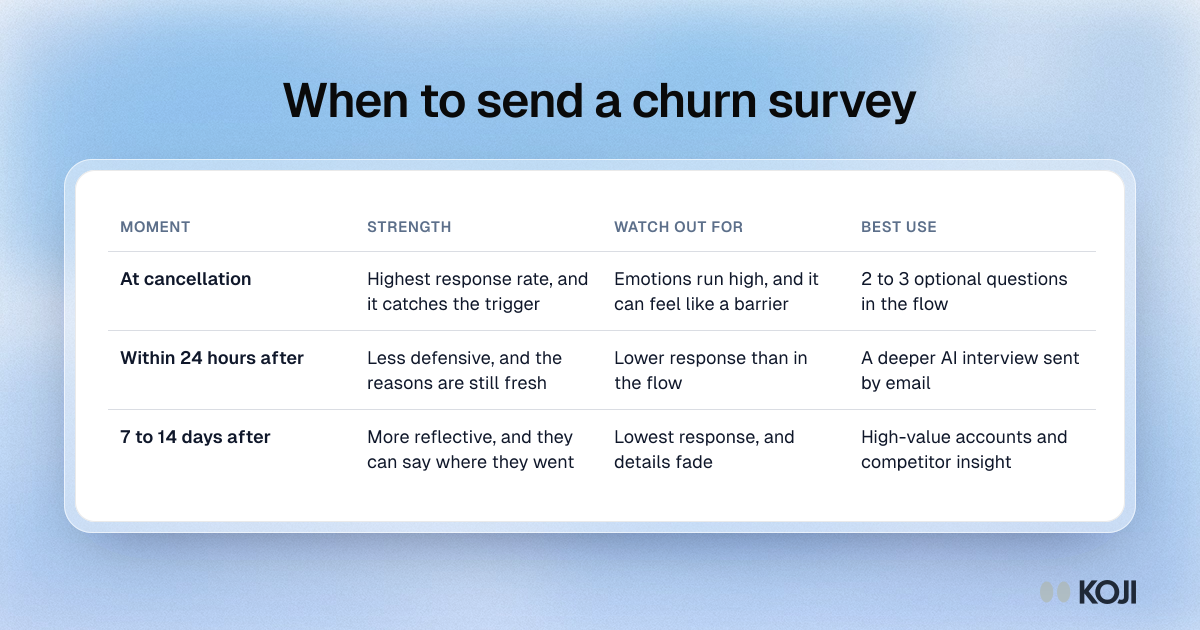
Table comparing three times to send a churn survey: at cancellation, within 24 hours and 7 to 14 days later, with the strength and trade-off of each.

Reference table

When to send a churn survey