Free to save and share

Frameworks and cheat sheets for customer research

Every framework, checklist and comparison from our guides, as an image you can download, drop into a deck or share with your team.
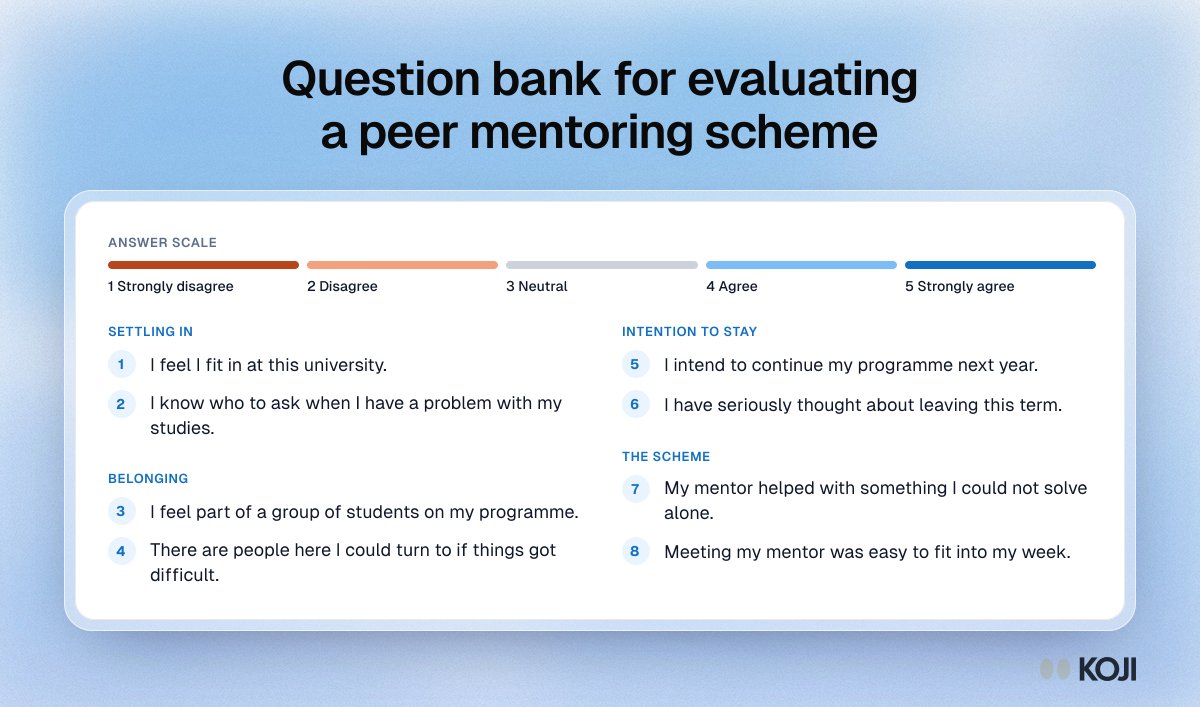
Question bank for evaluating a peer mentoring scheme, in four sections: settling in, belonging, intention to stay and the scheme itself.

Question bank

Question bank for evaluating a peer mentoring scheme
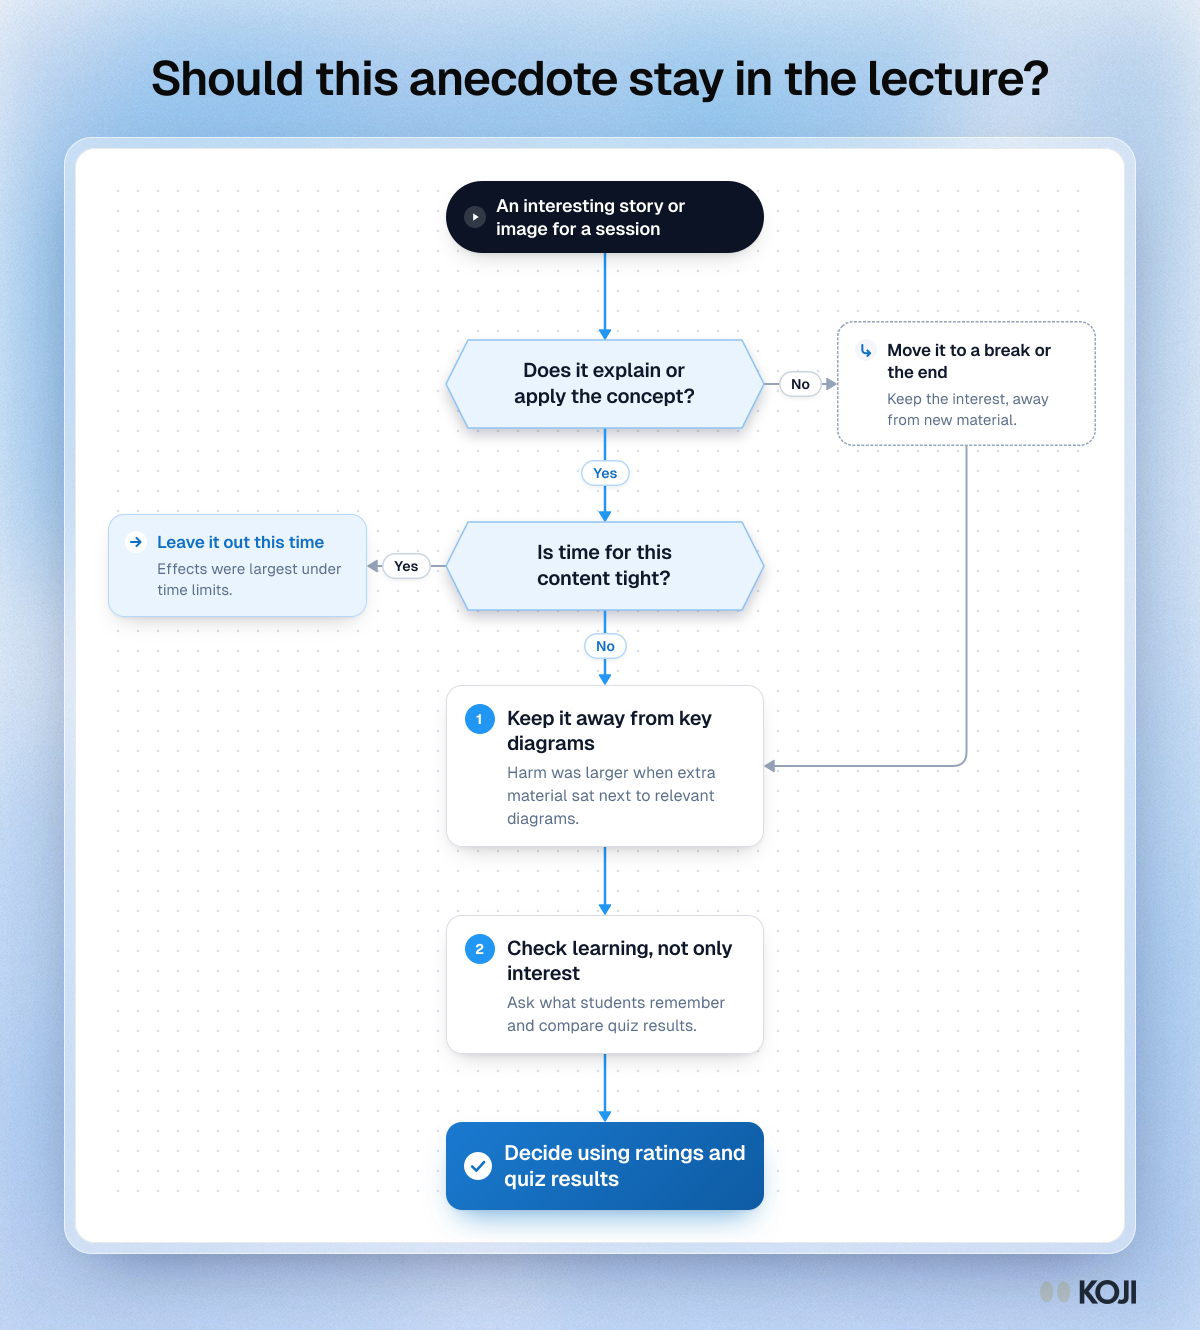
Flowchart for deciding whether to keep an interesting story in a lecture: two questions, a side step, one exit and two checks.

Flowchart

Should this anecdote stay in the lecture?
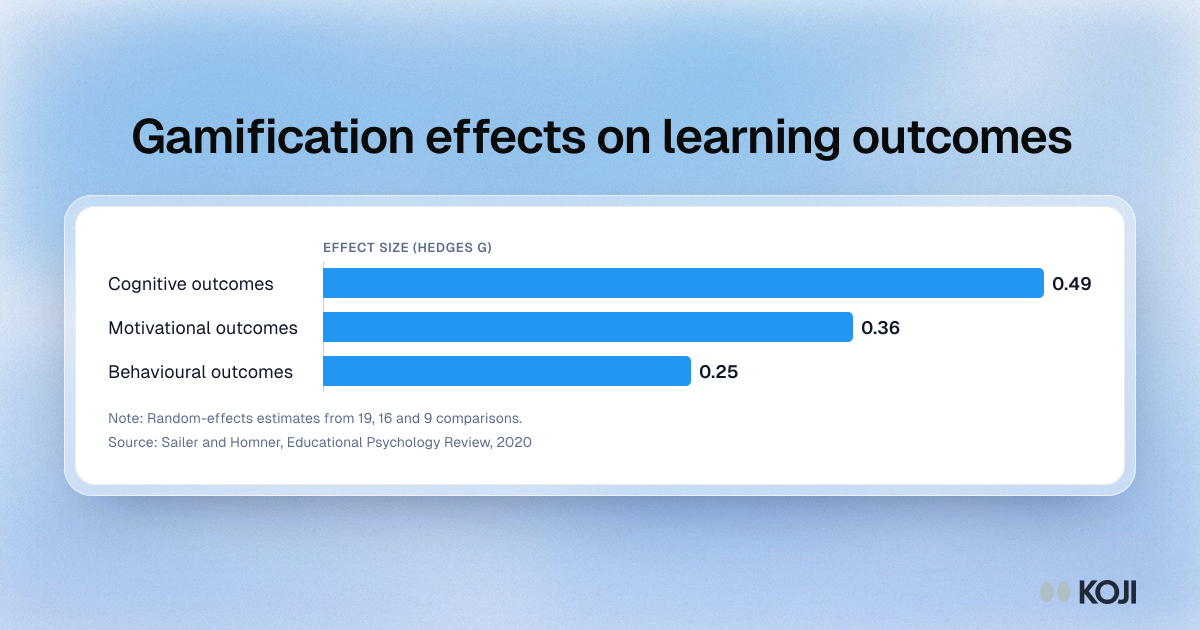
Bar chart of gamification effects on learning outcomes: cognitive g 0.49, motivational g 0.36, behavioural g 0.25.

Bar chart

Gamification effects on learning outcomes
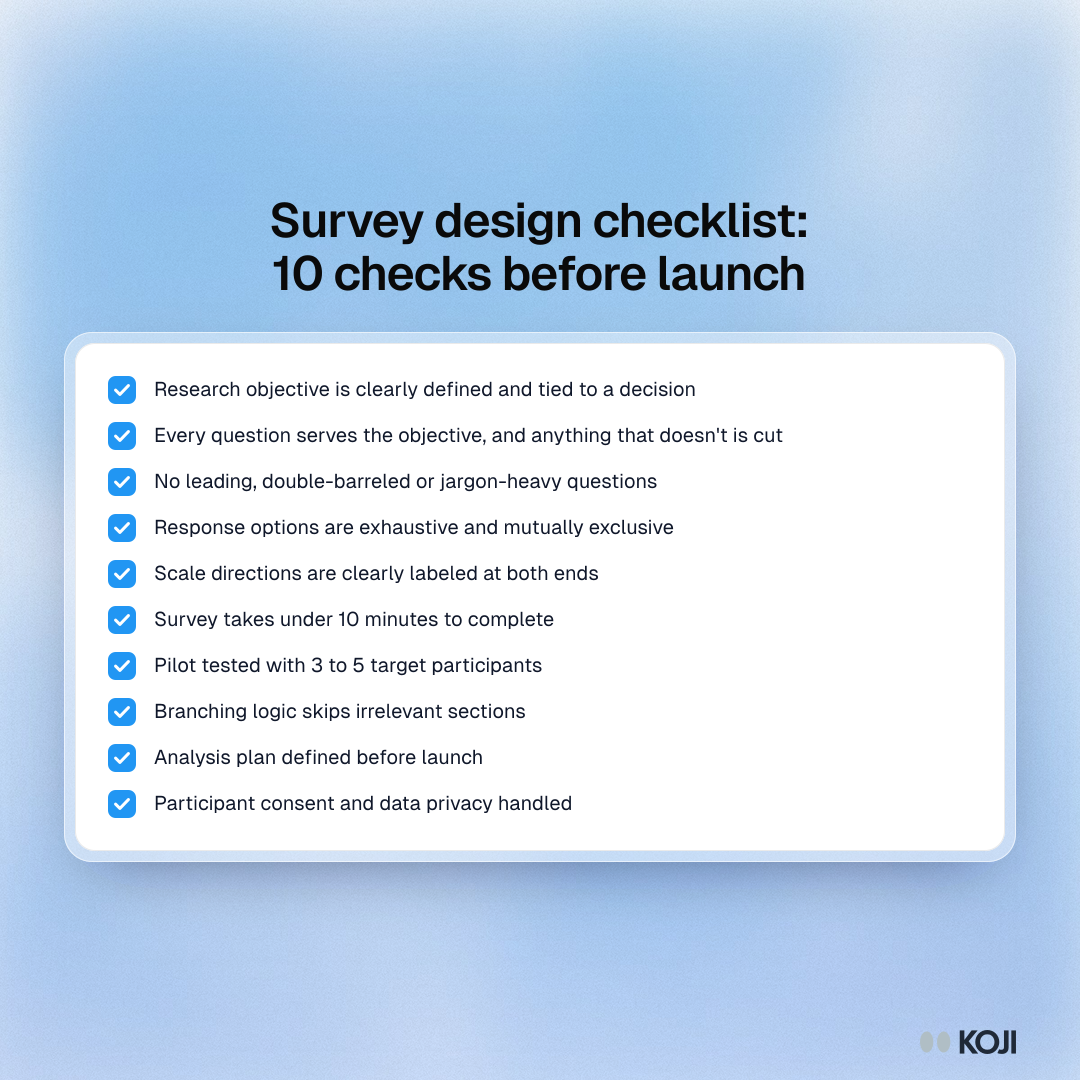
Checklist of ten survey design checks before launch, from a clear objective and neutral wording to a pilot test, branching logic and consent.

Checklist

Survey design checklist: 10 checks before launch
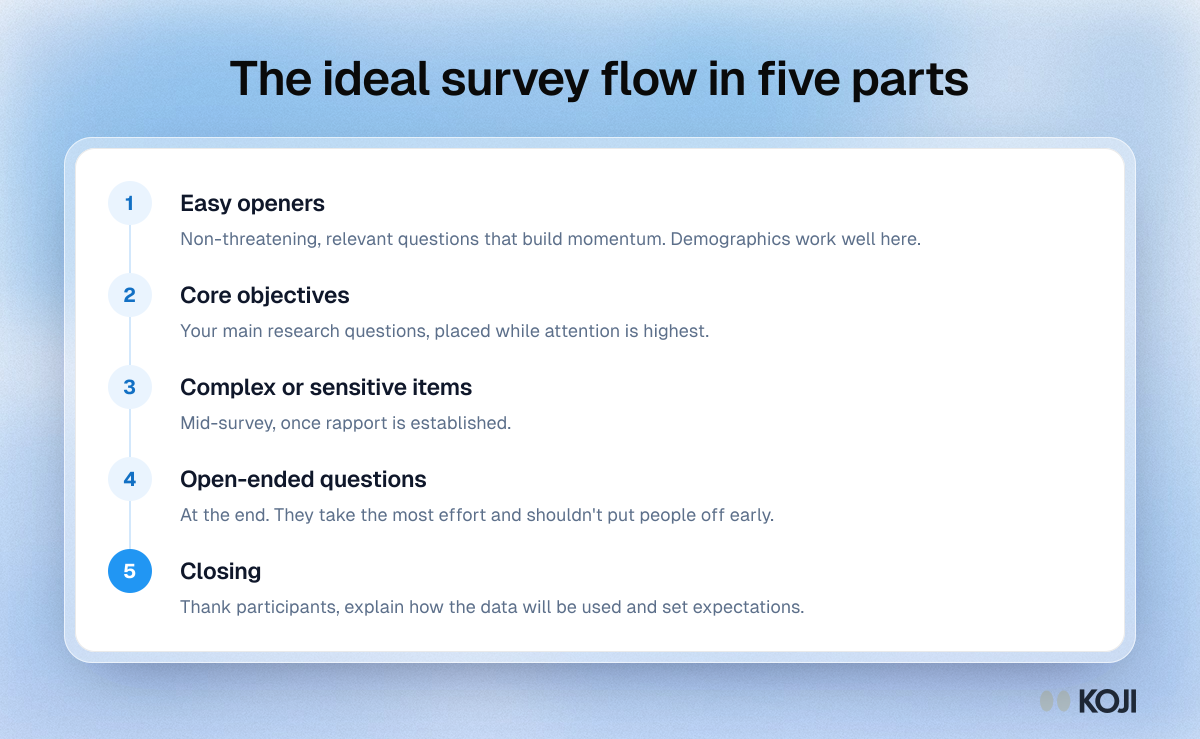
Process showing the five-part order for a survey: easy openers, core objectives, complex or sensitive items, open-ended questions and a closing.

Process

The ideal survey flow in five parts
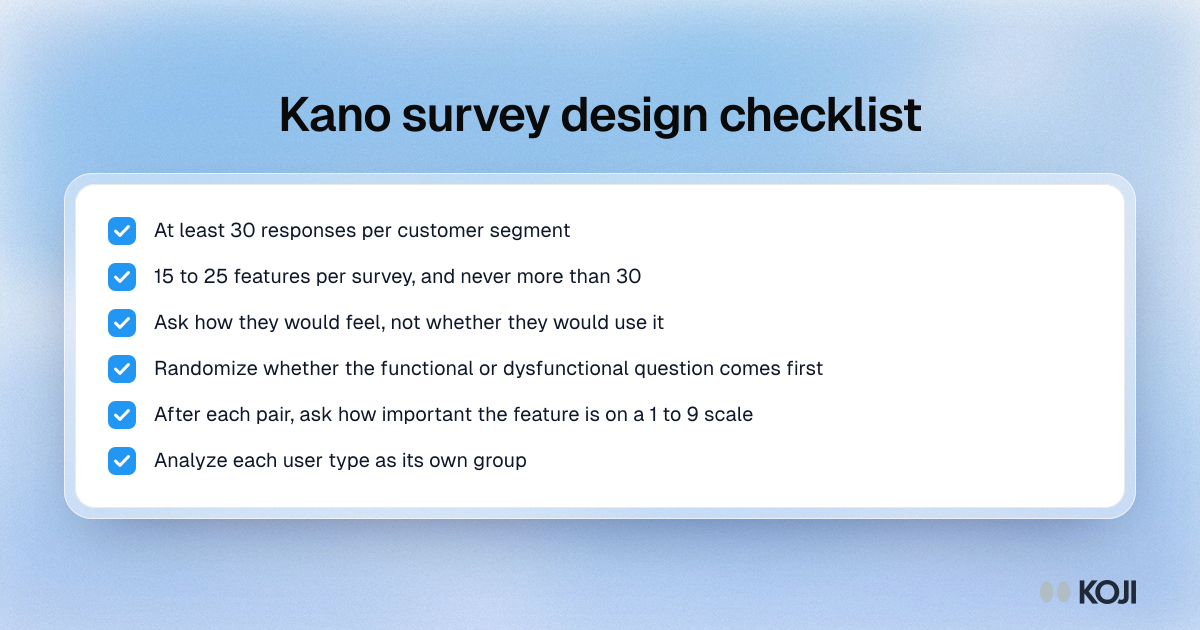
Checklist for designing a Kano survey: sample size per segment, number of features, feelings-based wording, randomized order, importance ratings and segments.

Checklist

Kano survey design checklist
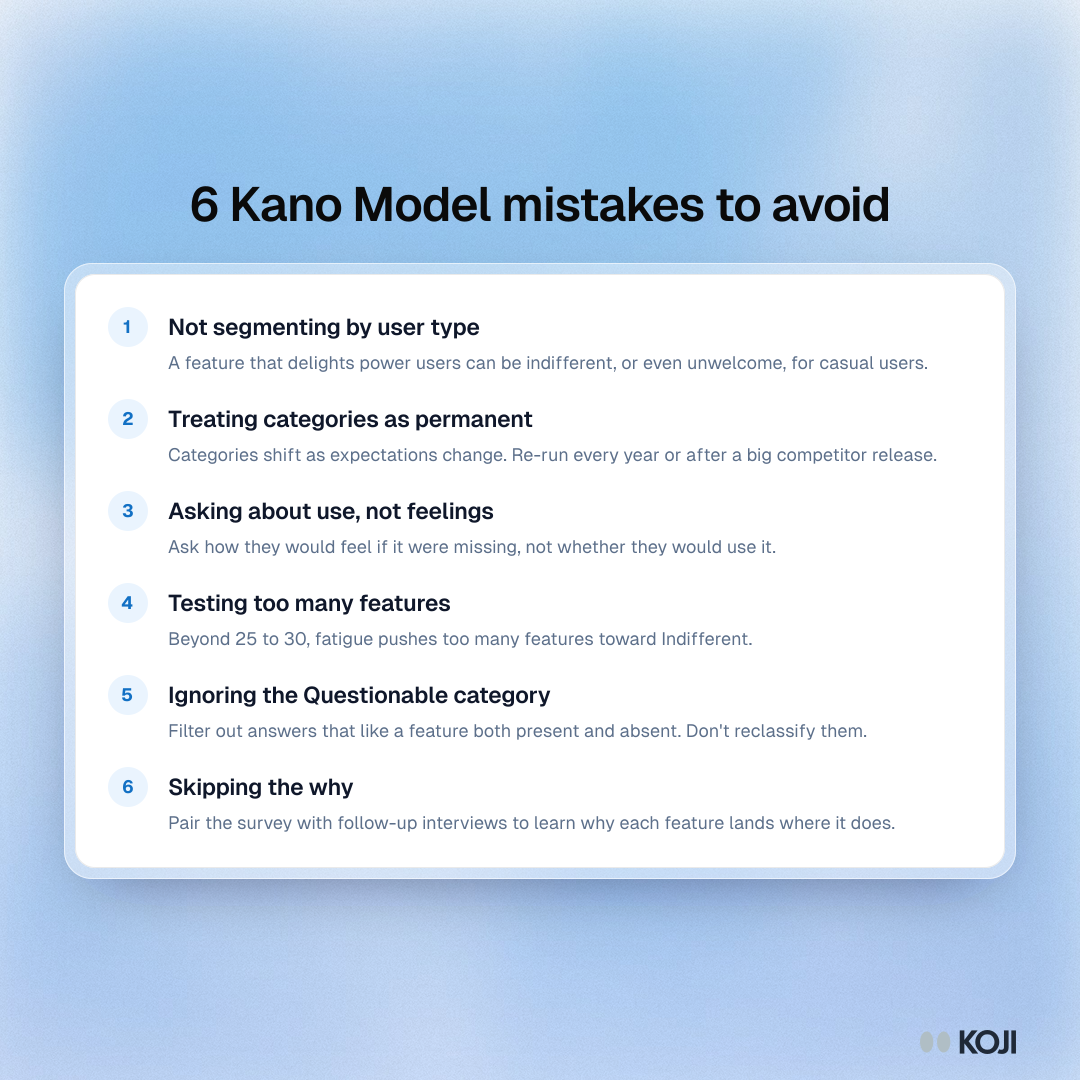
List of six Kano Model mistakes, from not segmenting users and treating categories as permanent to testing too many features and skipping the why.

Guide

6 Kano Model mistakes to avoid

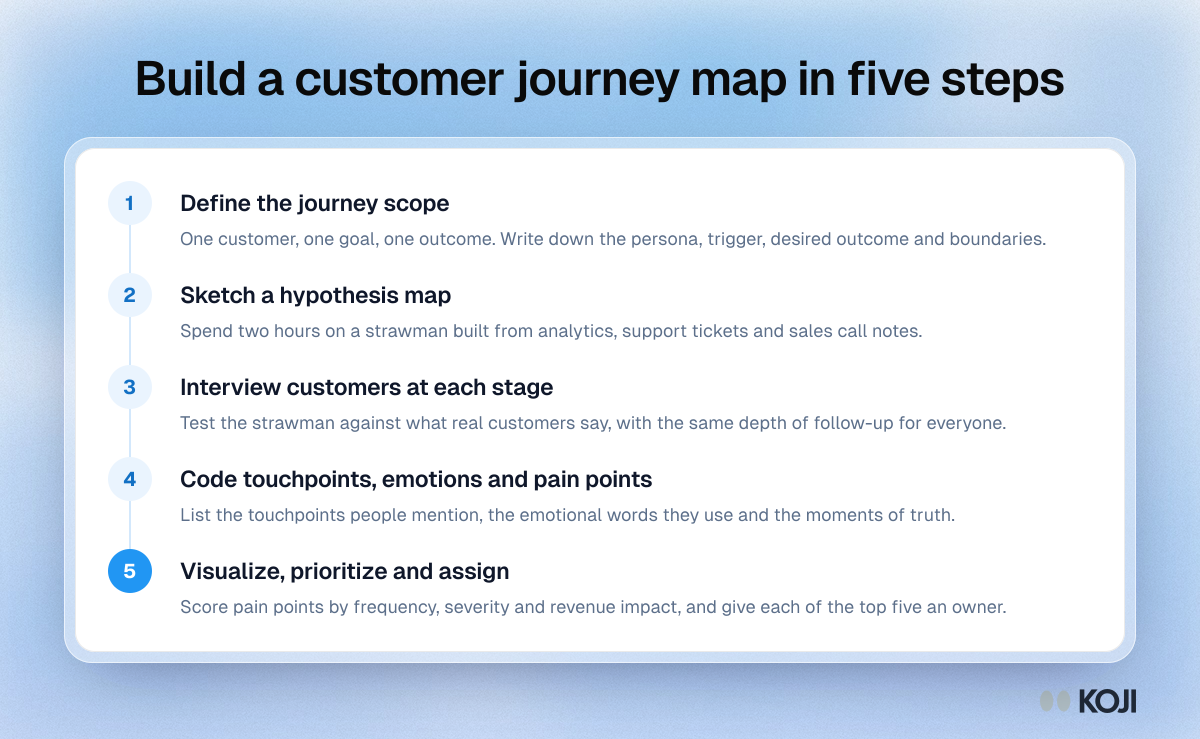
Process showing five steps to build a customer journey map: define the scope, sketch a hypothesis, interview customers, code the findings and assign owners.

Process

Build a customer journey map in five steps
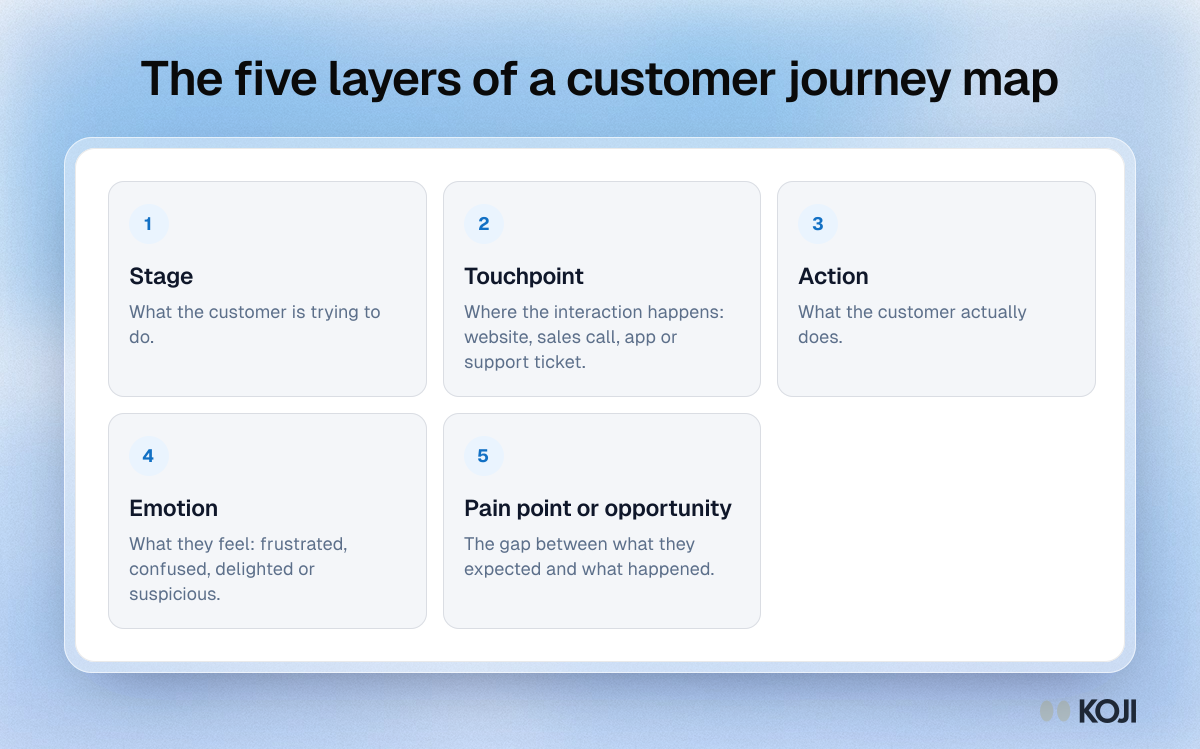
Framework showing the five layers to capture at each stage of a customer journey map: stage, touchpoint, action, emotion and pain point or opportunity.

Framework

The five layers of a customer journey map
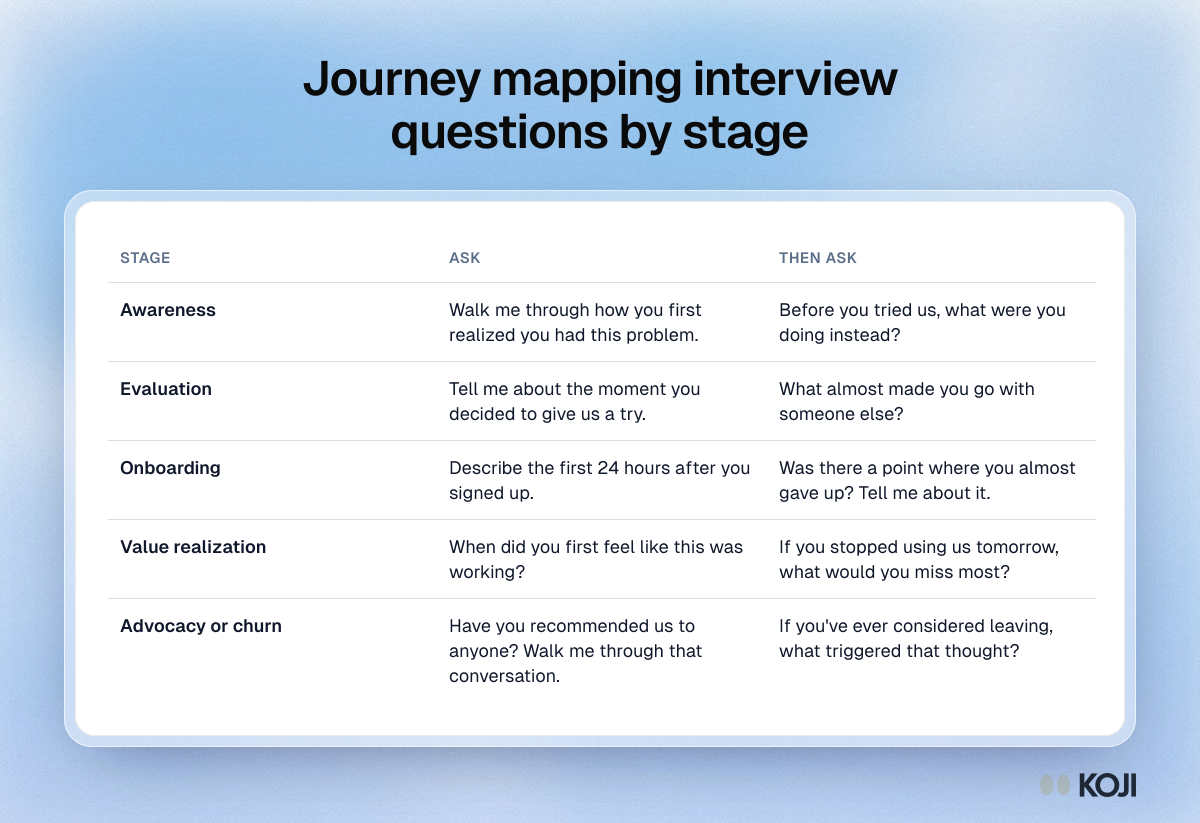
Table of ten journey mapping interview questions, two for each stage from awareness and evaluation to onboarding, value realization and churn.

Reference table

Journey mapping interview questions by stage
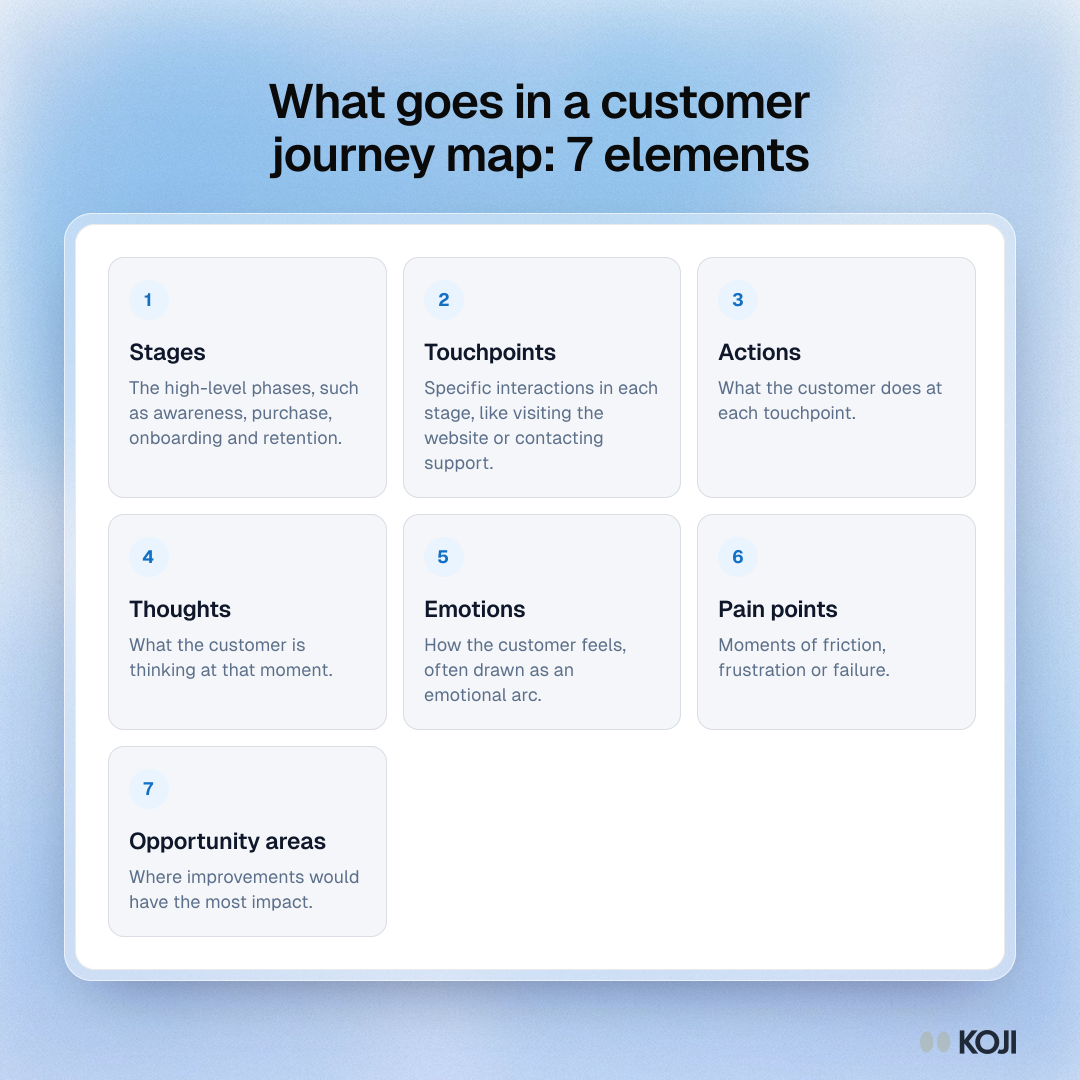
Framework showing the seven elements of a customer journey map: stages, touchpoints, actions, thoughts, emotions, pain points and opportunity areas.

Framework

What goes in a customer journey map: 7 elements
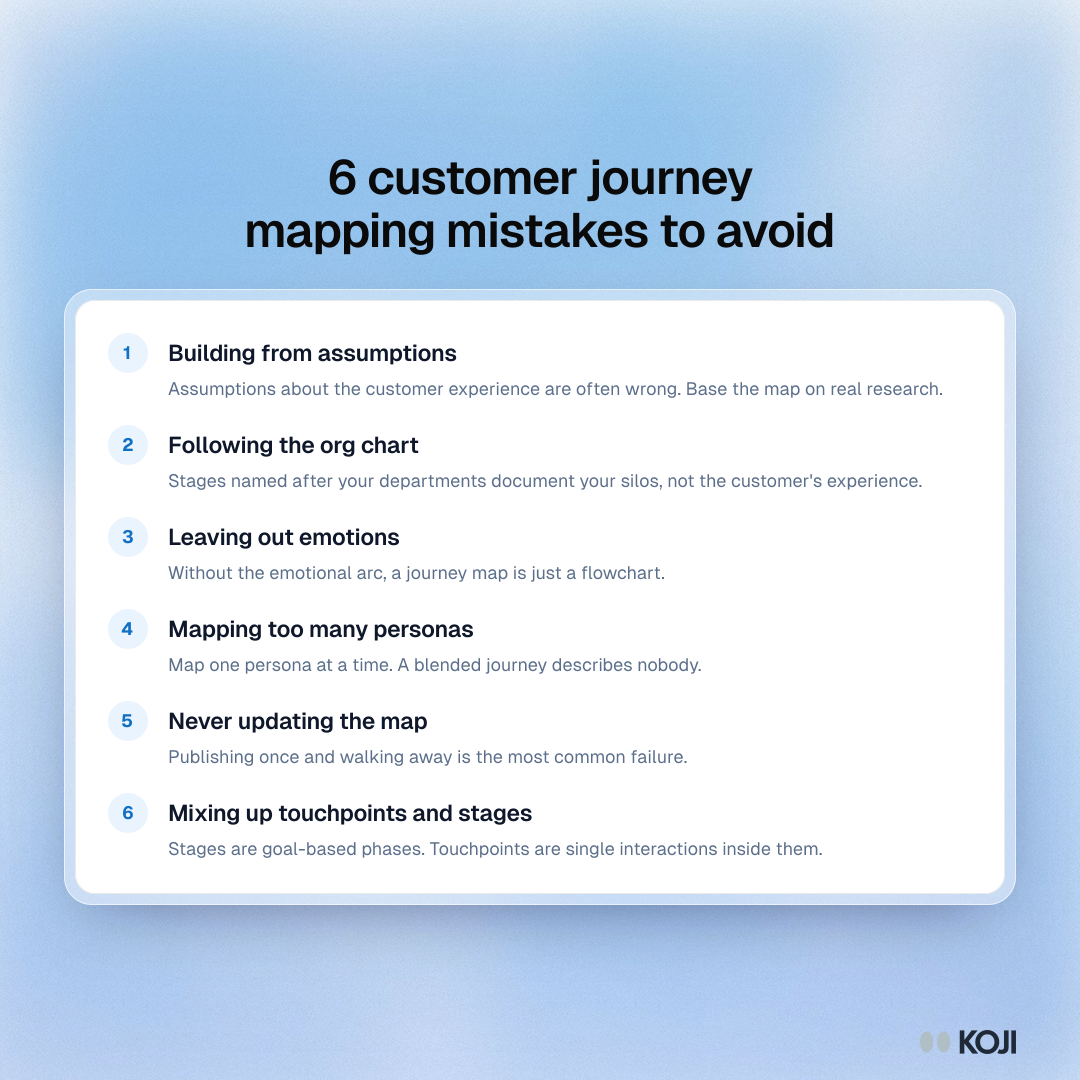
List of six customer journey mapping mistakes, including building from assumptions, following the org chart and never updating the map.

Guide

6 customer journey mapping mistakes to avoid
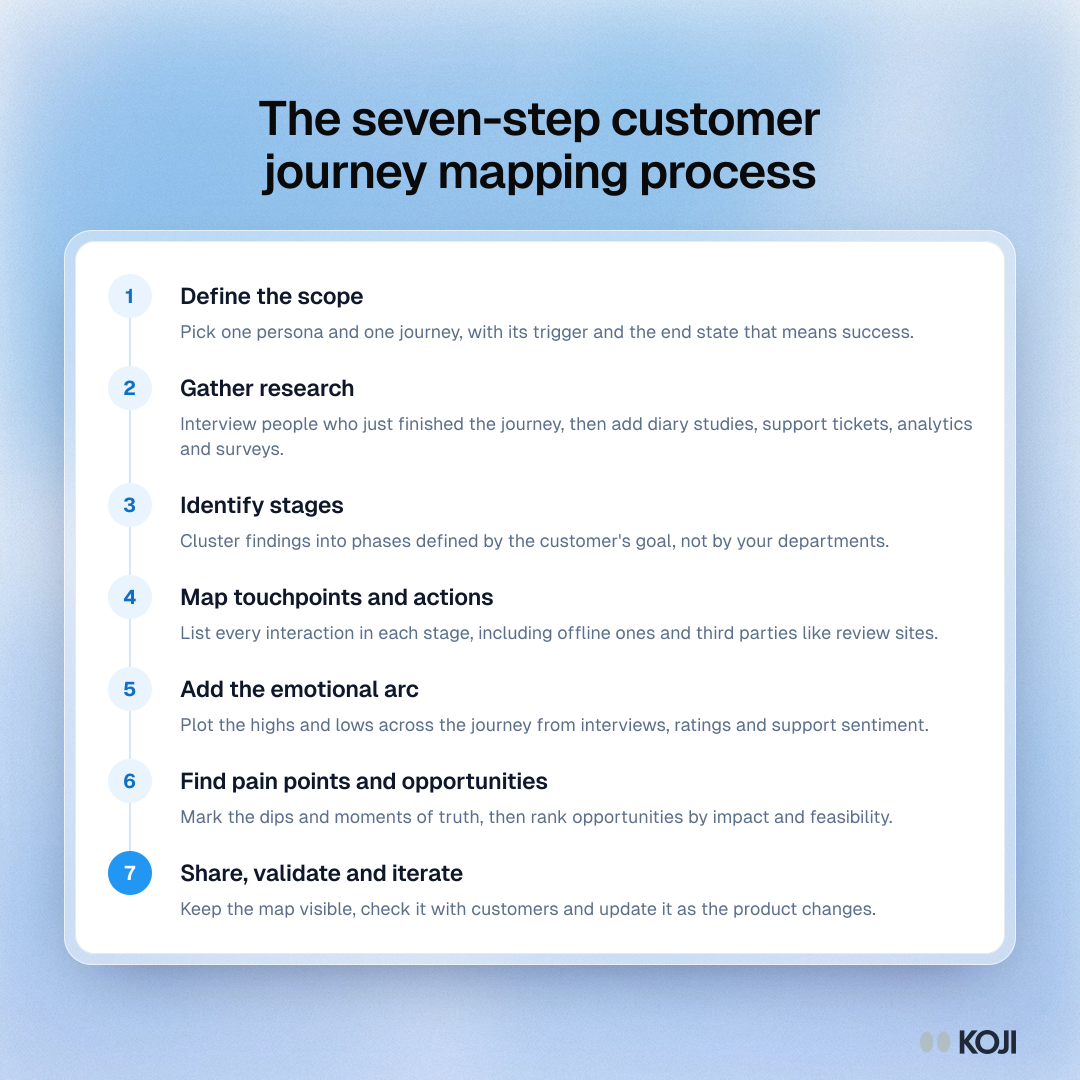
Process showing seven steps to map a customer journey, from defining the scope and gathering research to adding the emotional arc and iterating.

Process

The seven-step customer journey mapping process
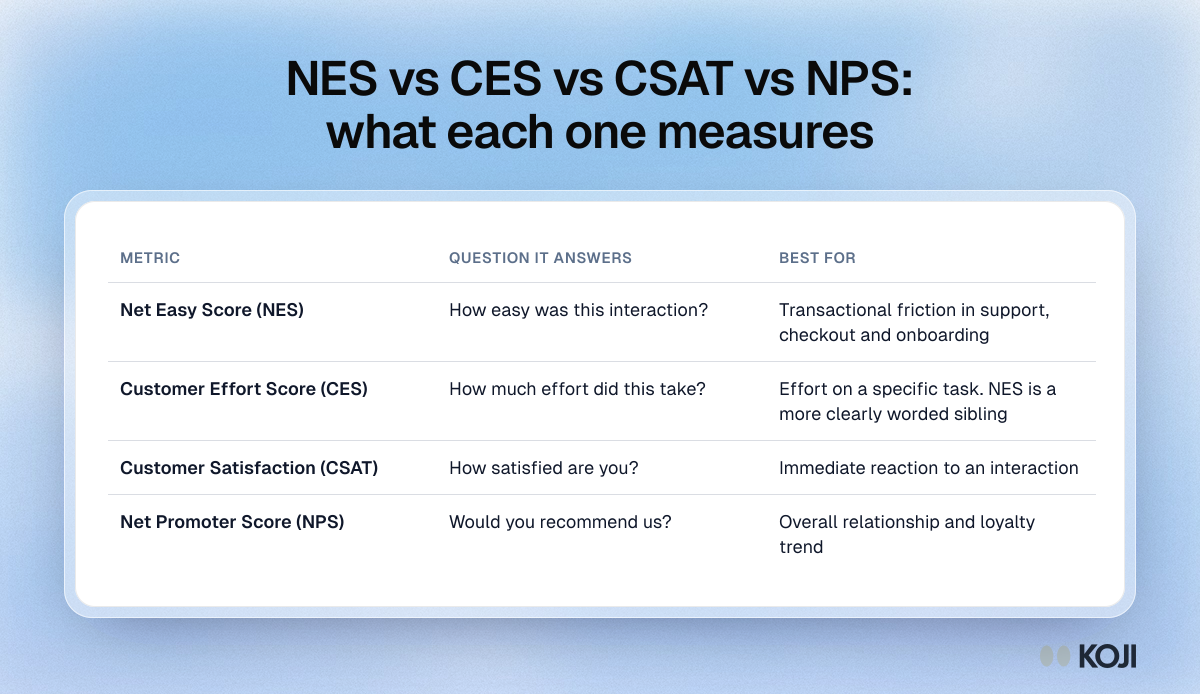
Table comparing four customer experience metrics, Net Easy Score, Customer Effort Score, CSAT and NPS, by the question each answers and its best use.

Reference table

NES vs CES vs CSAT vs NPS: what each one measures
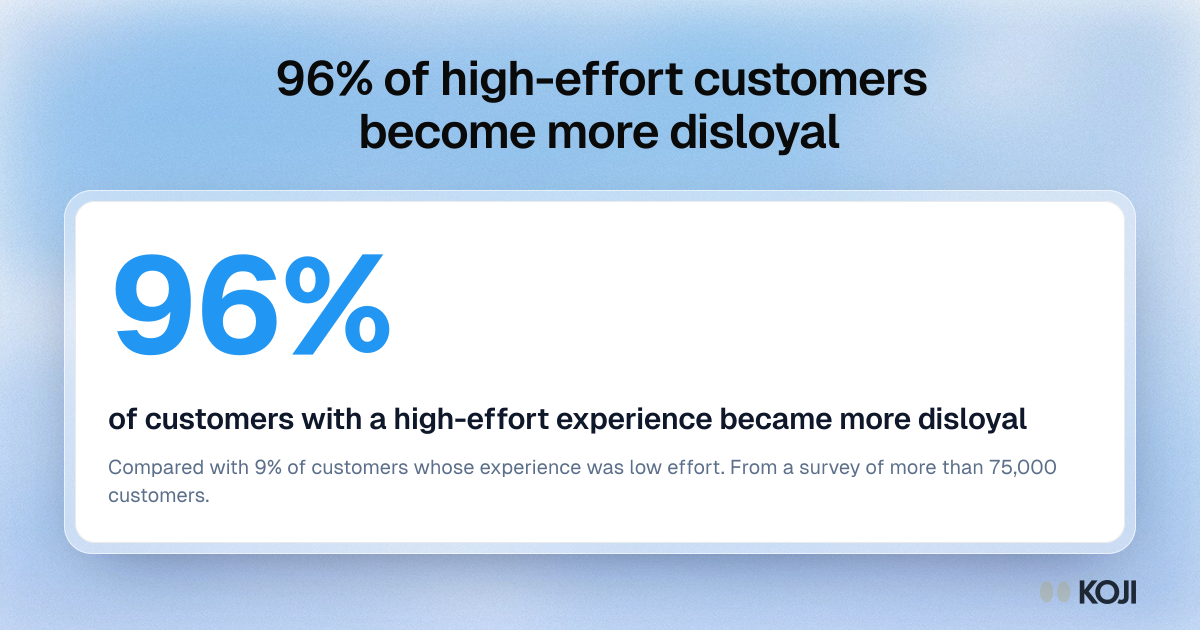
Stat card: 96% of customers who had a high-effort experience became more disloyal, compared with 9% after a low-effort one.

Key figure

96% of high-effort customers become more disloyal
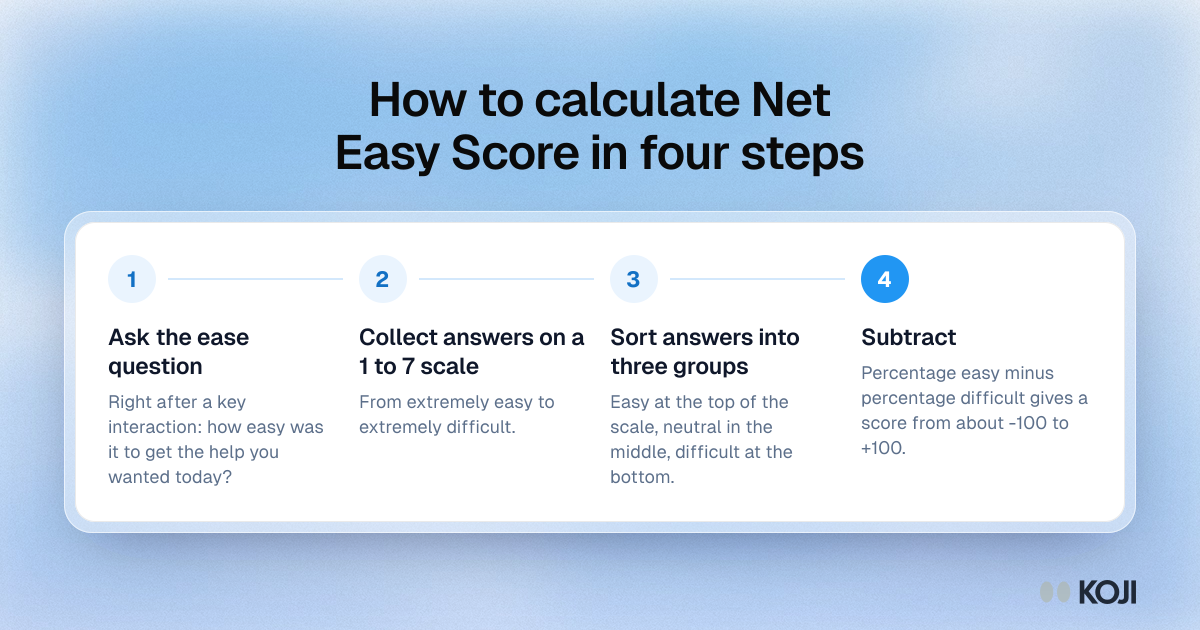
Process showing how to calculate Net Easy Score: ask the ease question, collect 1 to 7 answers, group them and subtract difficult from easy.

Process

How to calculate Net Easy Score in four steps
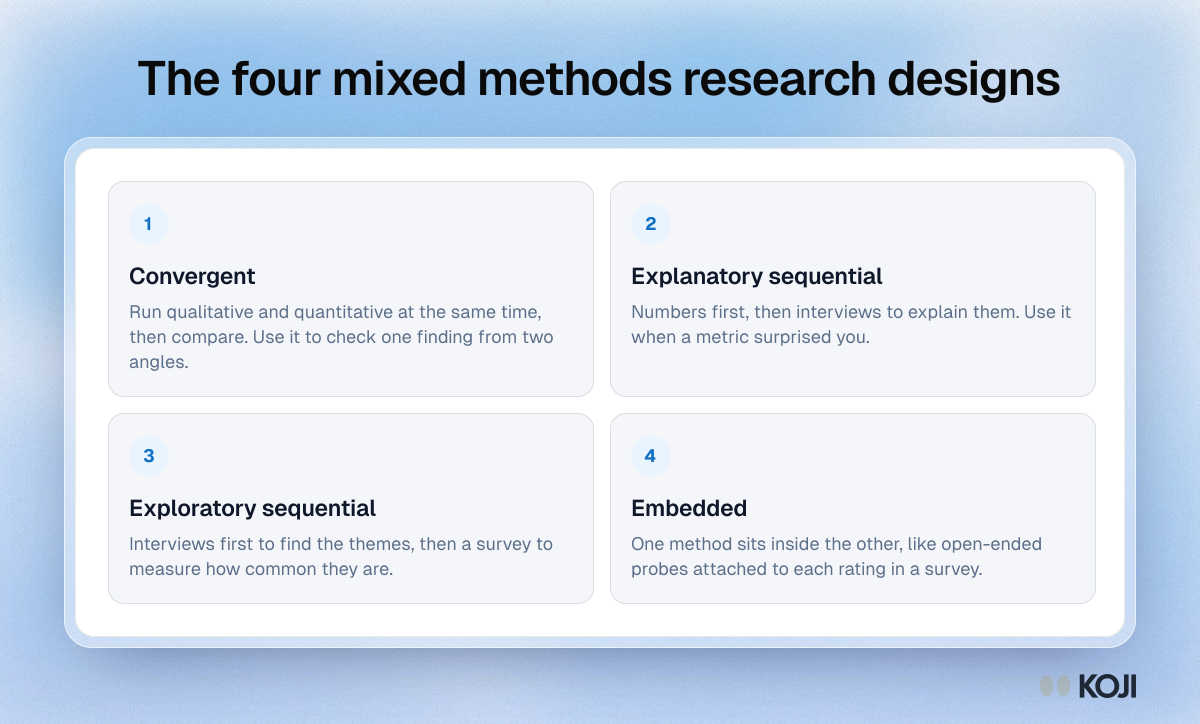
Framework showing the four mixed methods research designs: convergent, explanatory sequential, exploratory sequential and embedded, with when to use each.

Framework

The four mixed methods research designs
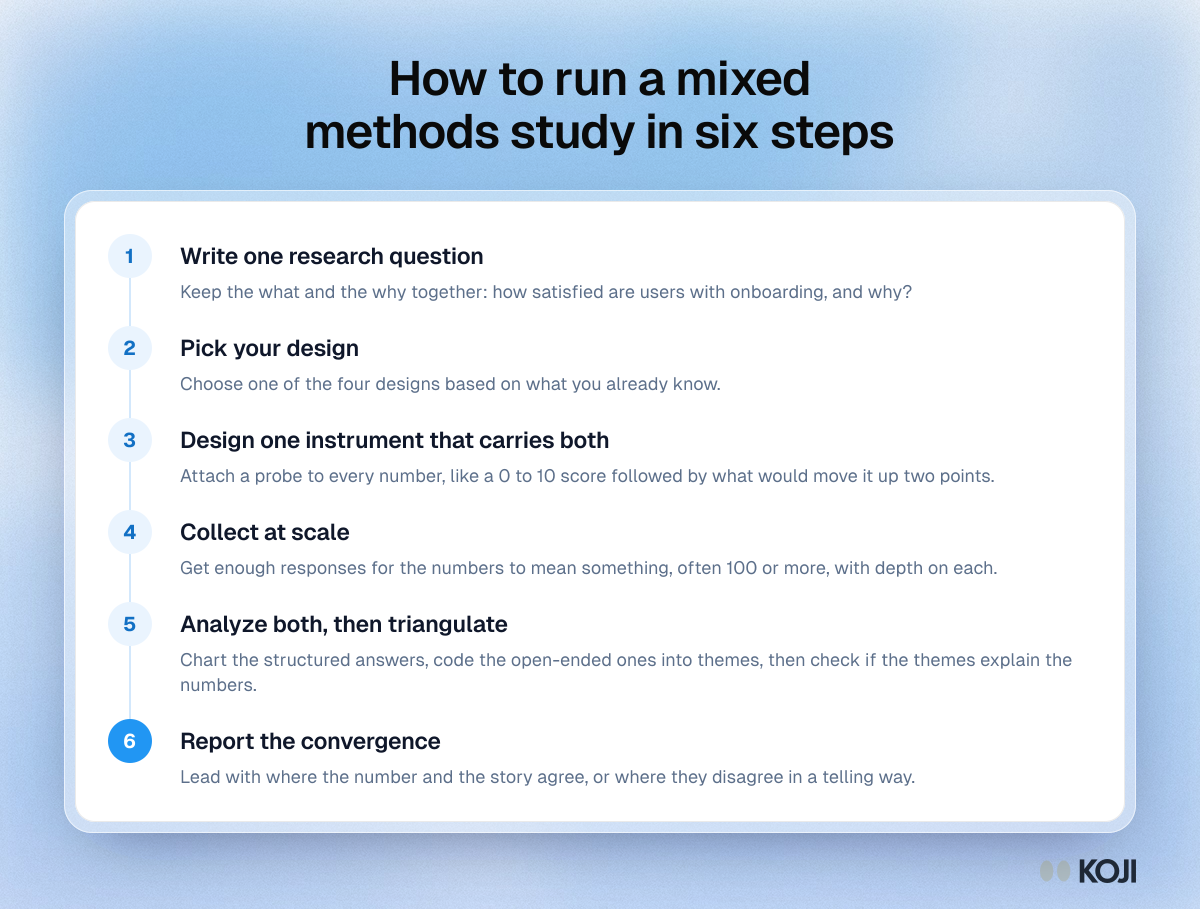
Process showing six steps to run a mixed methods study, from writing one research question to reporting where the numbers and the stories agree.

Process

How to run a mixed methods study in six steps
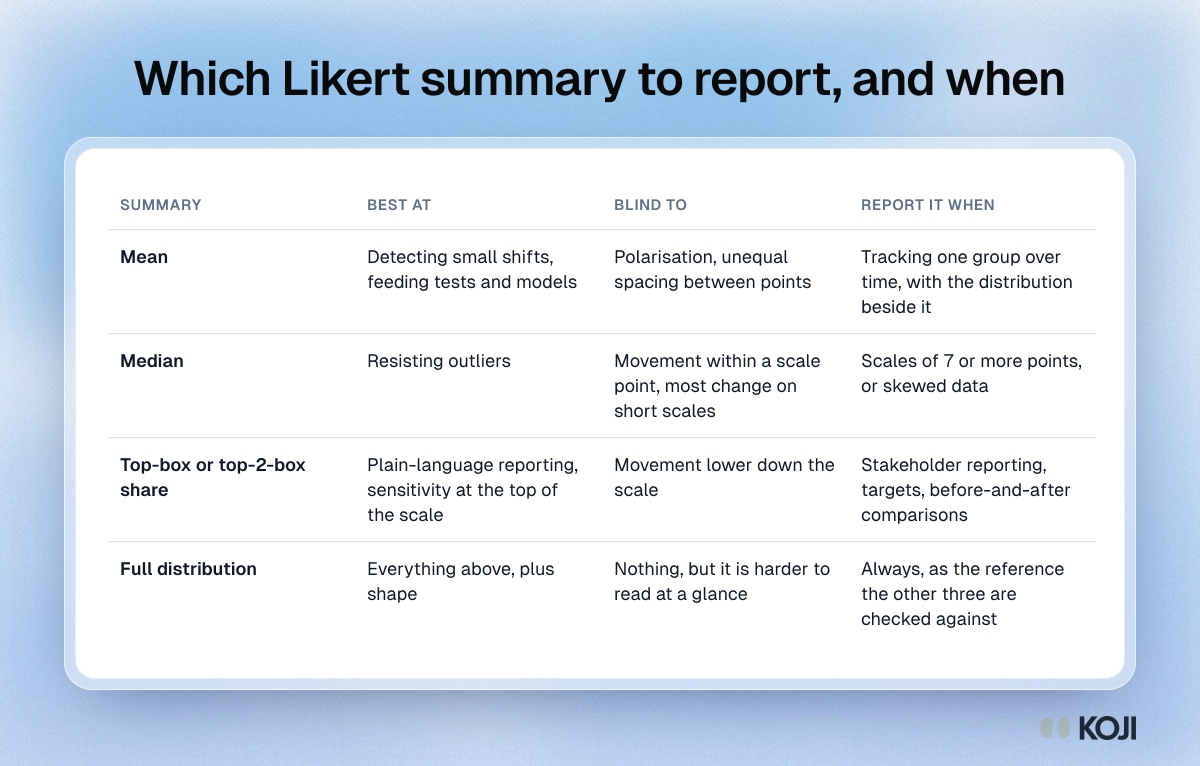
Table comparing four ways to summarise Likert data, the mean, median, top-box share and full distribution, by what each catches and misses.

Reference table

Which Likert summary to report, and when
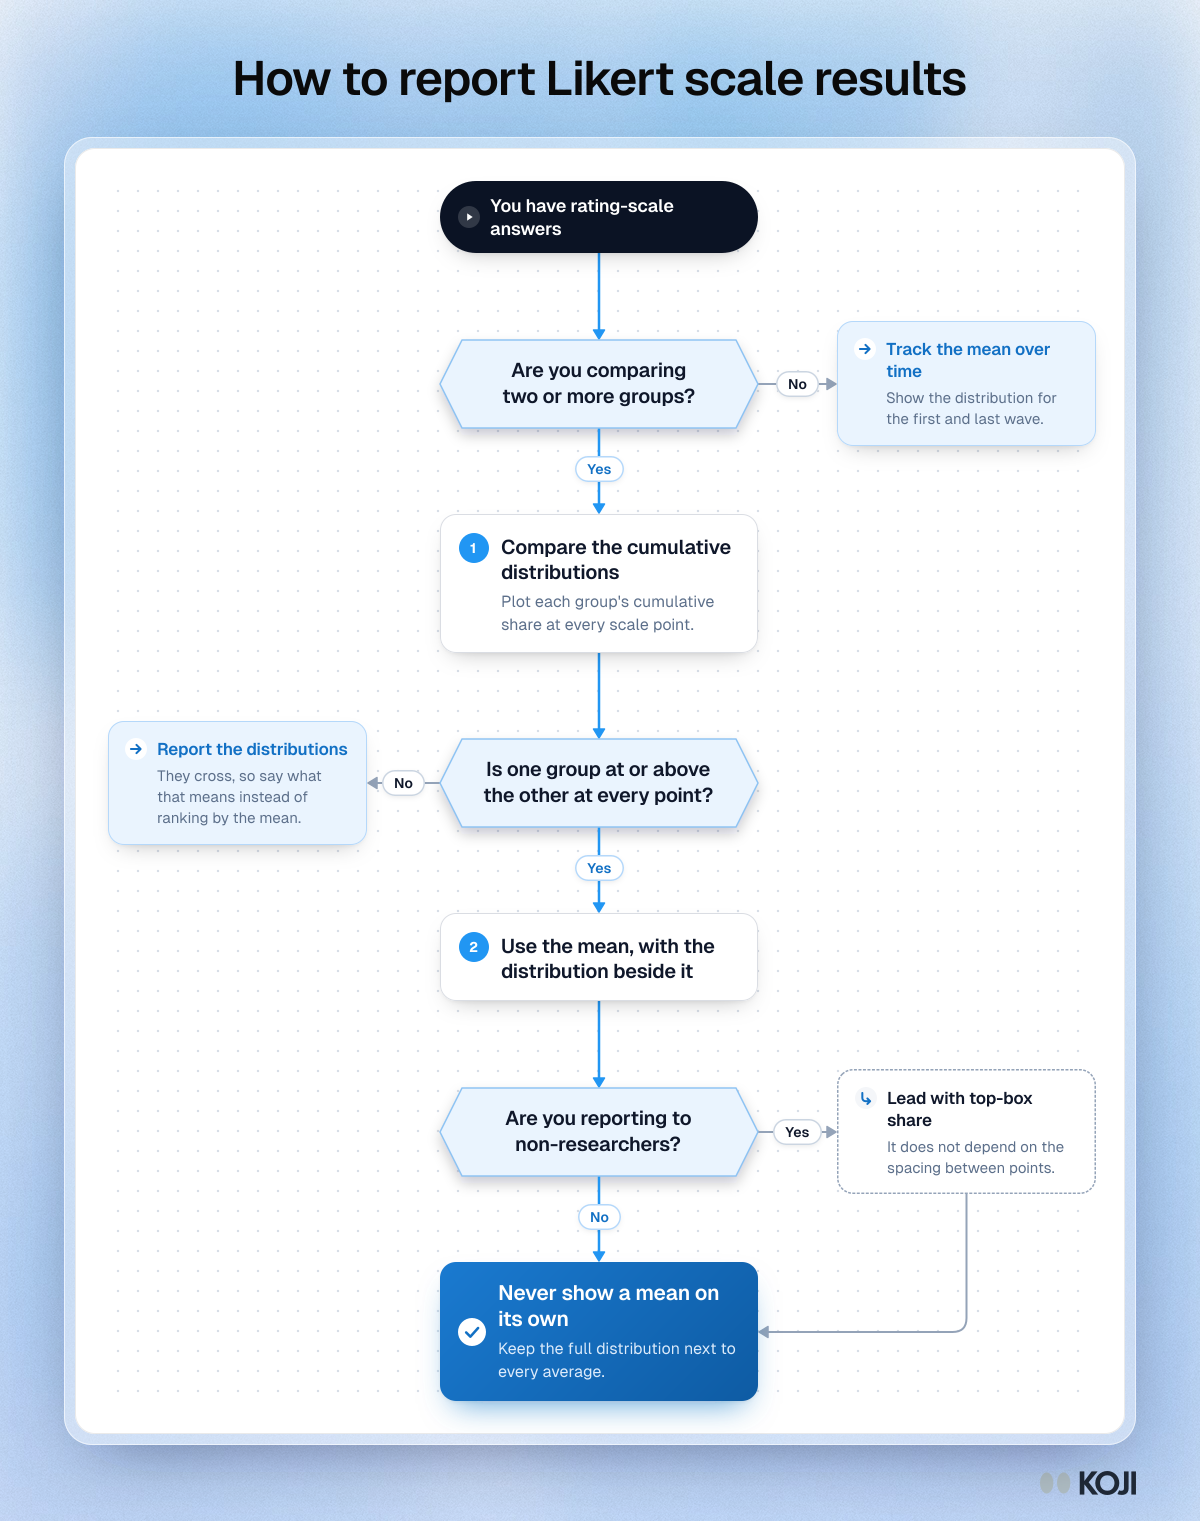
Flowchart for reporting Likert results: three questions on groups, crossing distributions and audience, ending with the mean shown beside its distribution.

Flowchart

How to report Likert scale results
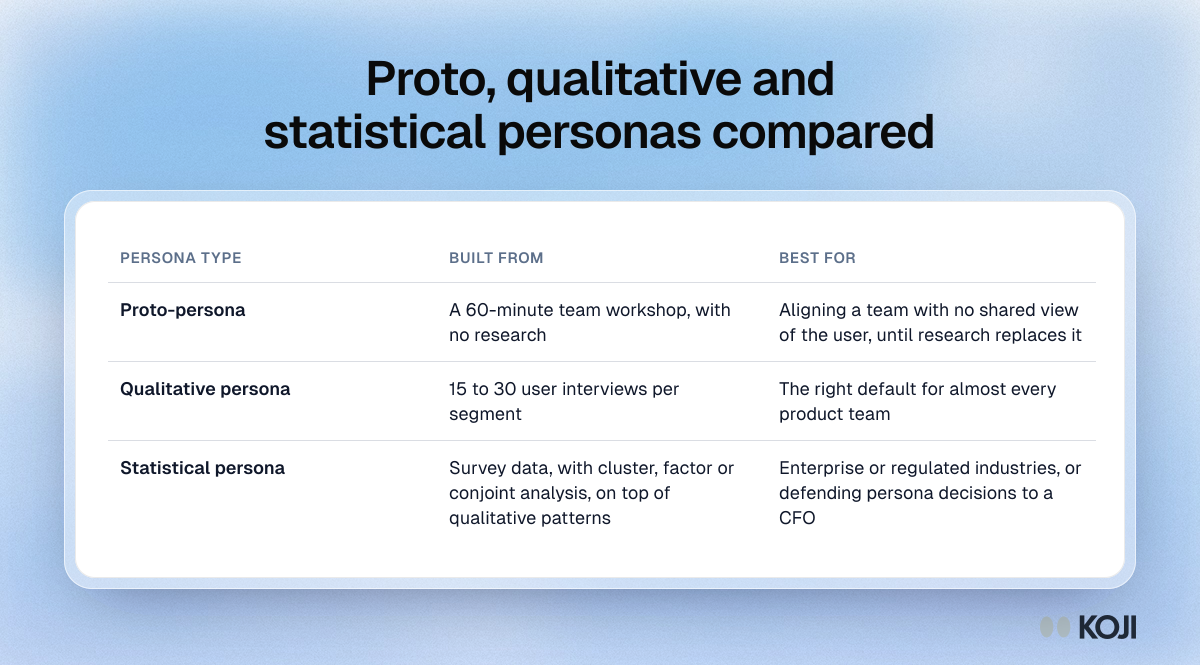
Table comparing three kinds of user persona, proto, qualitative and statistical, by what each is built from and when to use it.

Reference table

Proto, qualitative and statistical personas compared
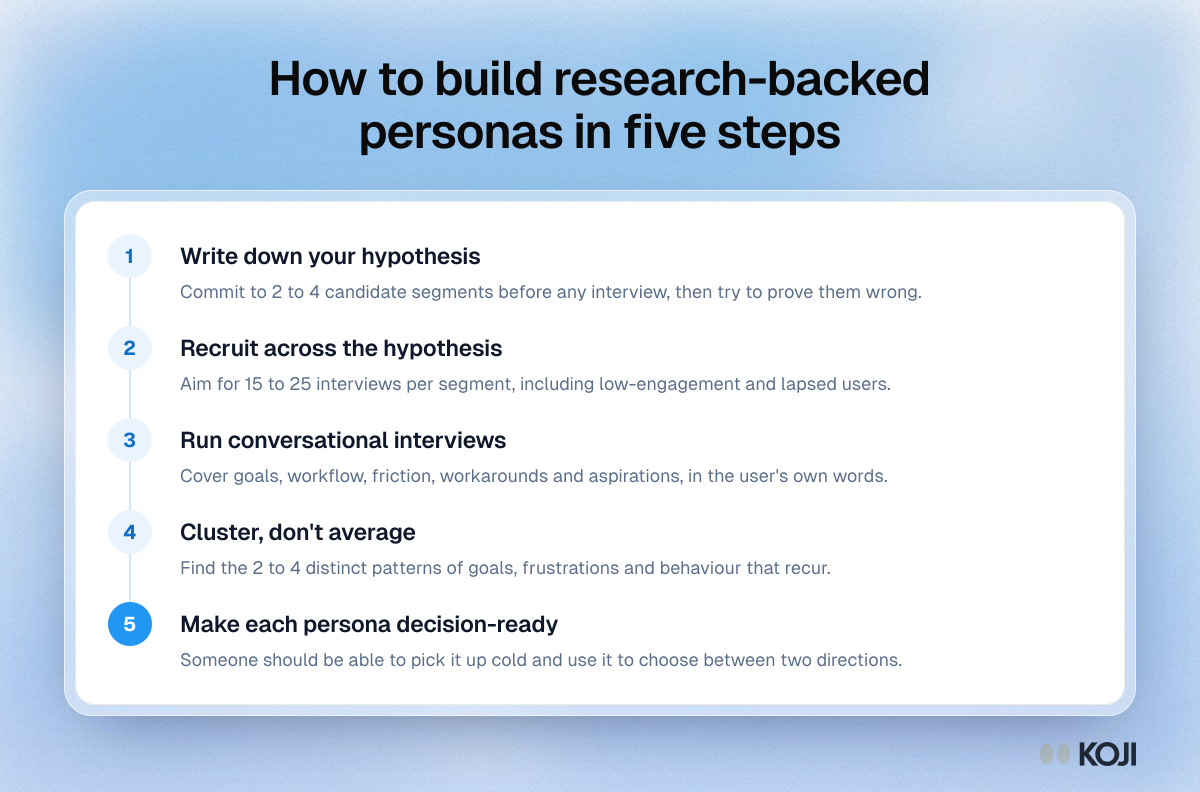
Process showing five steps to build research-backed personas, from writing a hypothesis and recruiting to interviewing, clustering and finishing them.

Process

How to build research-backed personas in five steps
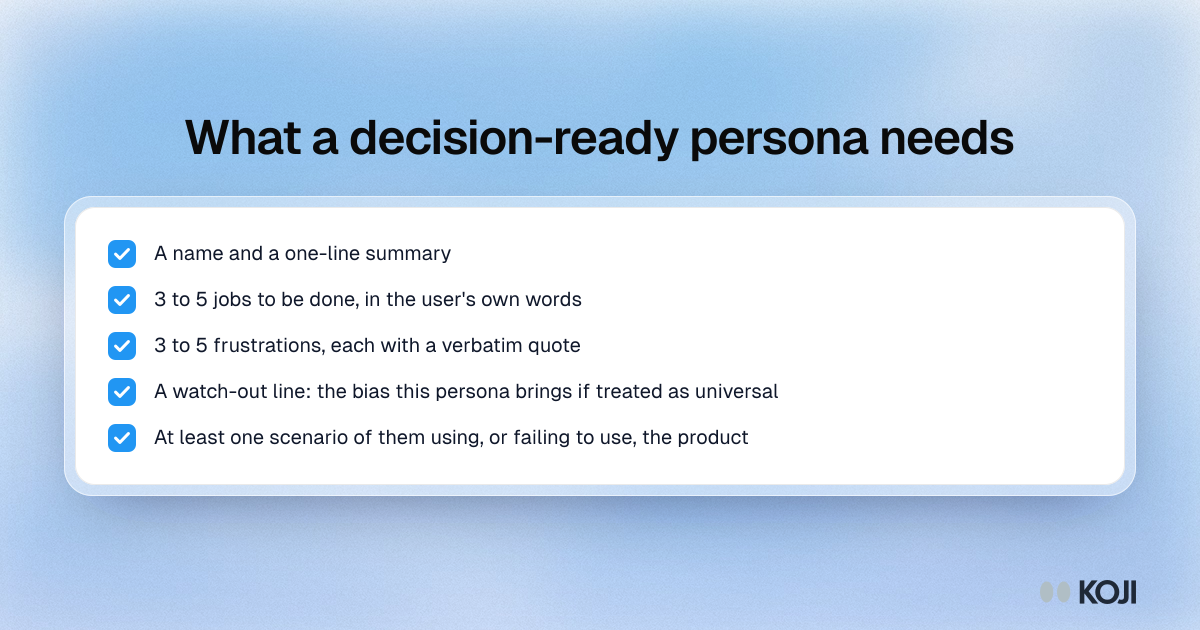
Checklist of five things a decision-ready user persona needs, including a one-line summary, jobs to be done, quoted frustrations and a watch-out line.

Checklist

What a decision-ready persona needs
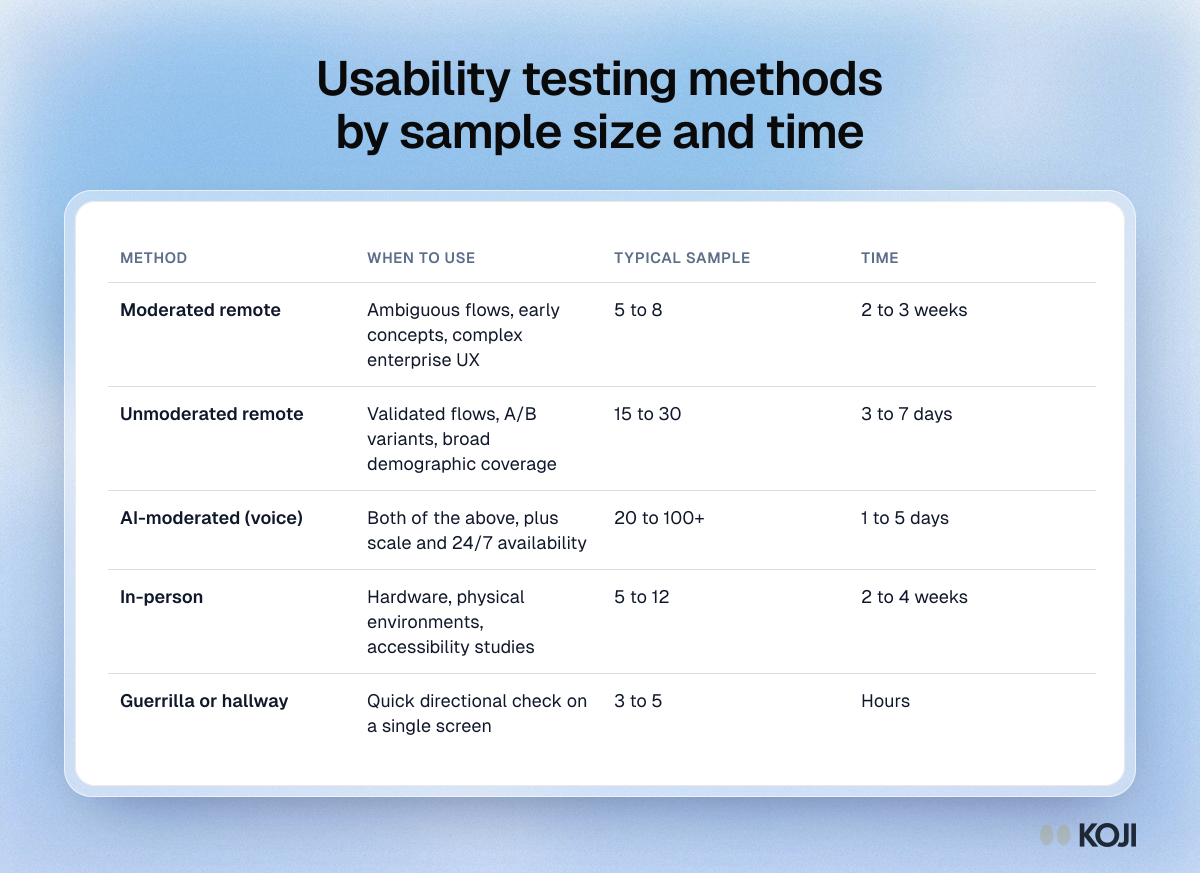
Table comparing five usability testing methods by when to use each, typical sample size and time, from moderated remote to hallway tests.

Reference table

Usability testing methods by sample size and time
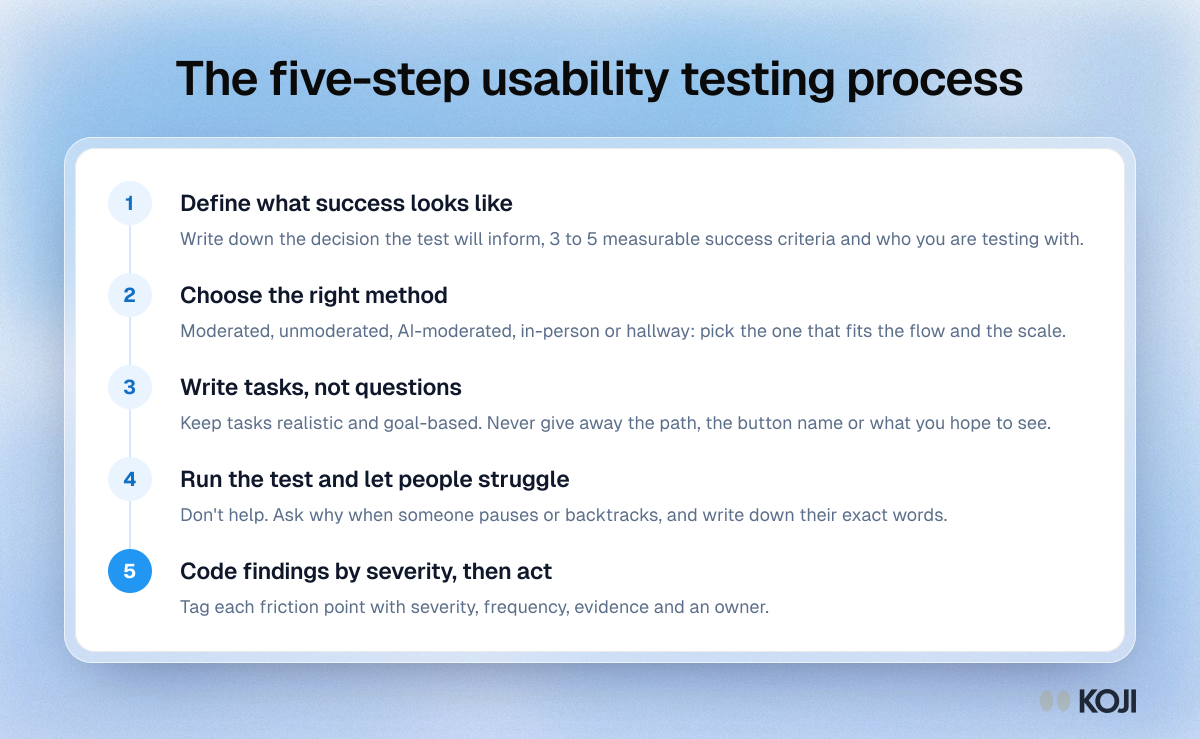
Process showing the five steps of a usability test: define success, choose a method, write tasks, run the test and code findings by severity.

Process

The five-step usability testing process
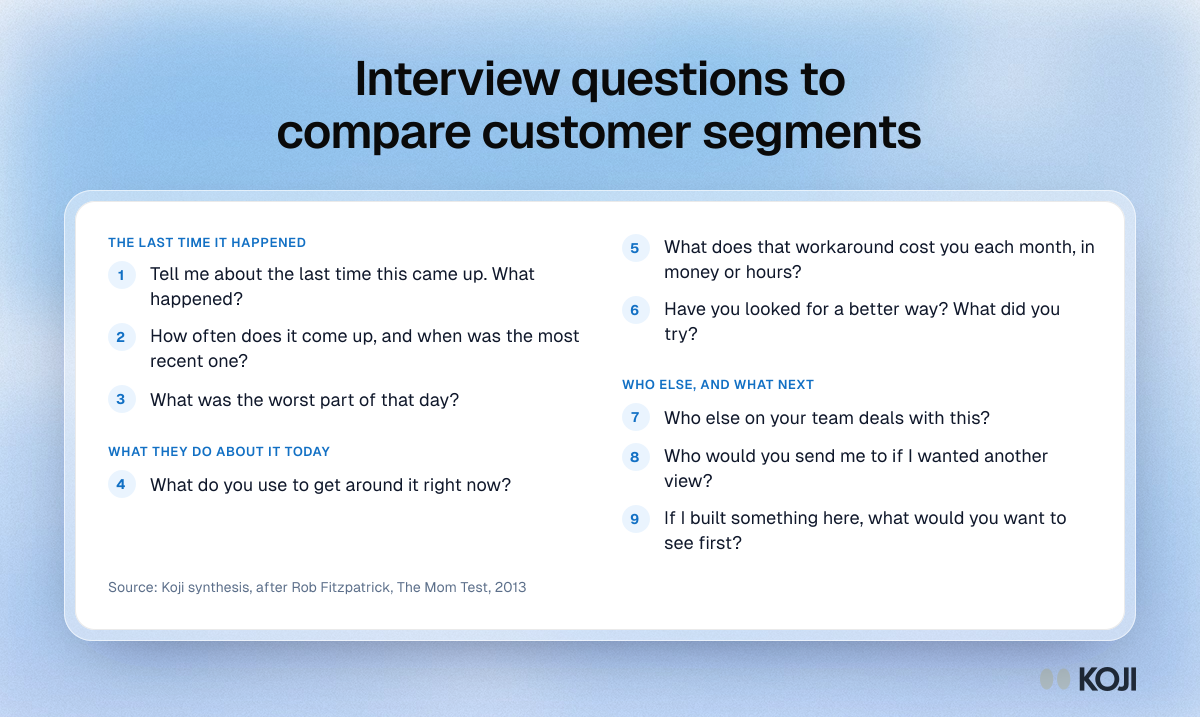
Question bank of nine questions for comparing customer segments: the last time it happened, current workarounds, and referrals.

Question bank

Interview questions to compare customer segments
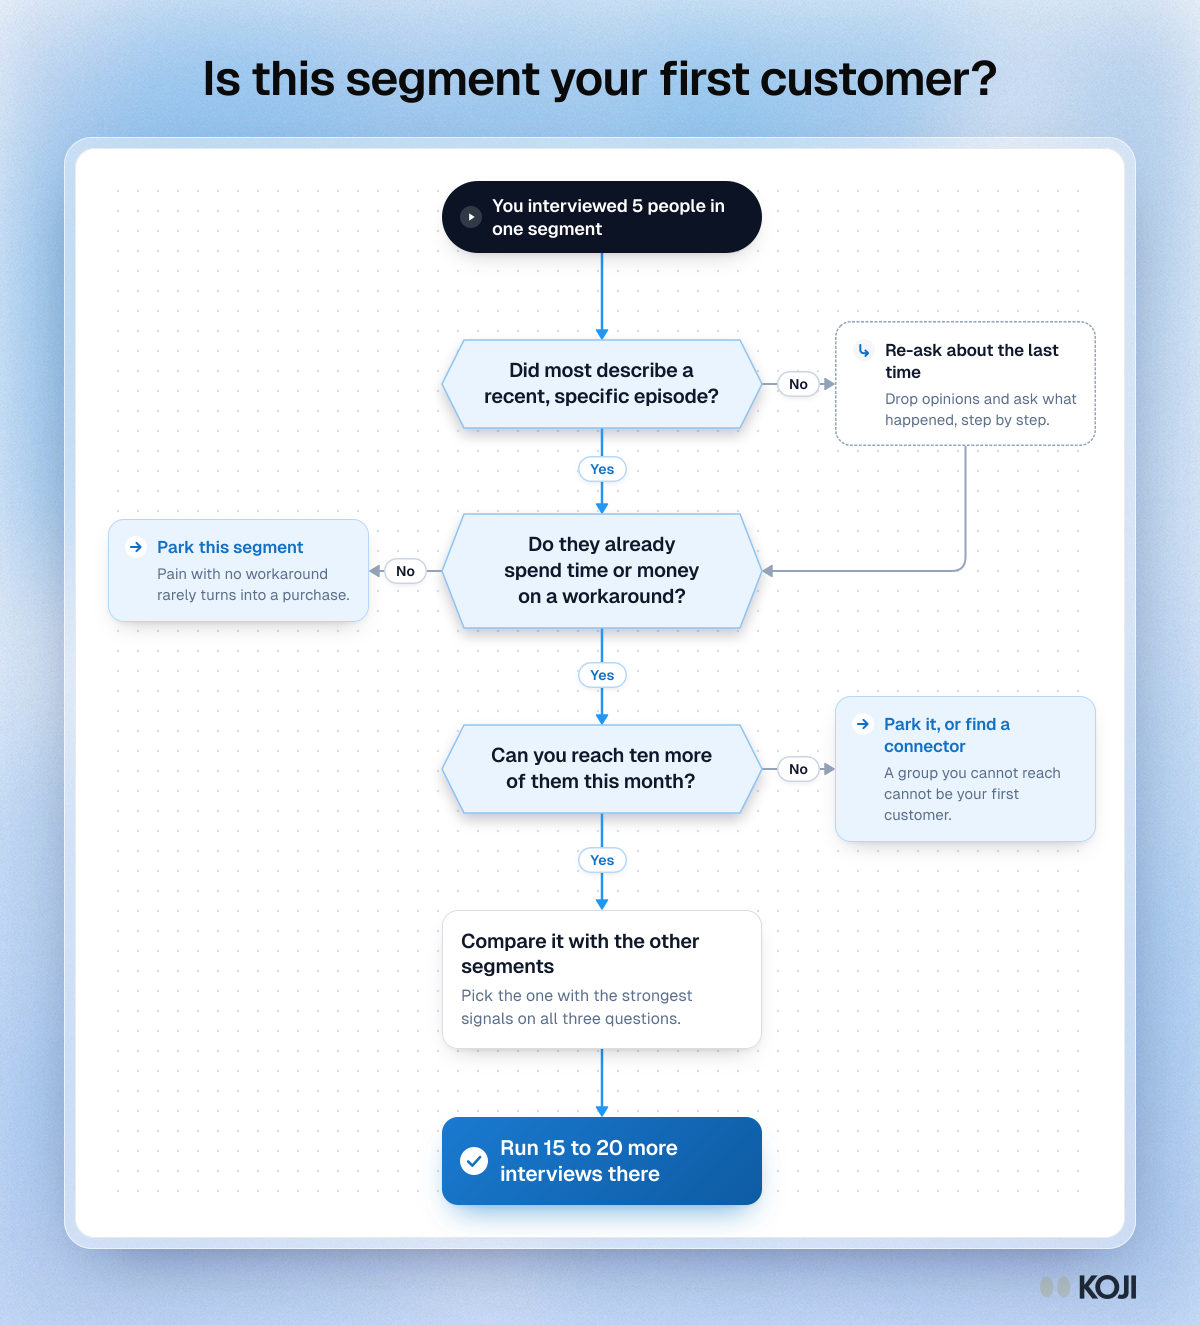
Flowchart for deciding whether a customer segment is your first customer: three questions on recent episodes, paid workarounds and reach, one side step.

Flowchart

Is this segment your first customer?
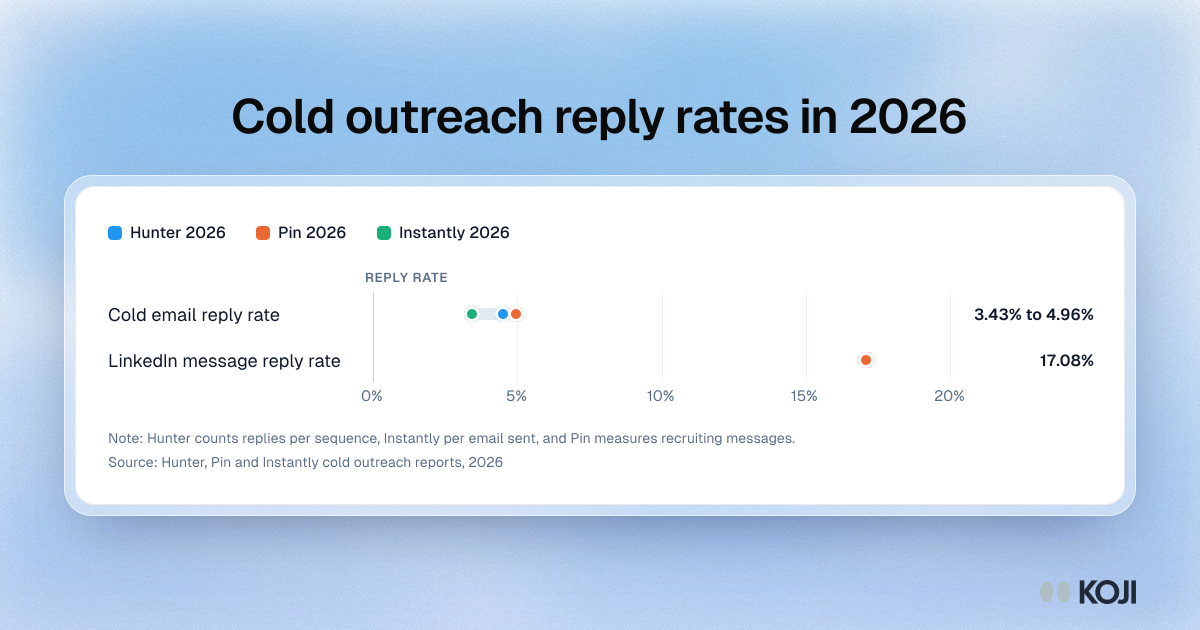
Range chart of cold outreach reply rates in 2026: cold email between 3.43% and 4.96% across three reports, and LinkedIn messages at 17.08% in one report.

Benchmark range

Cold outreach reply rates in 2026
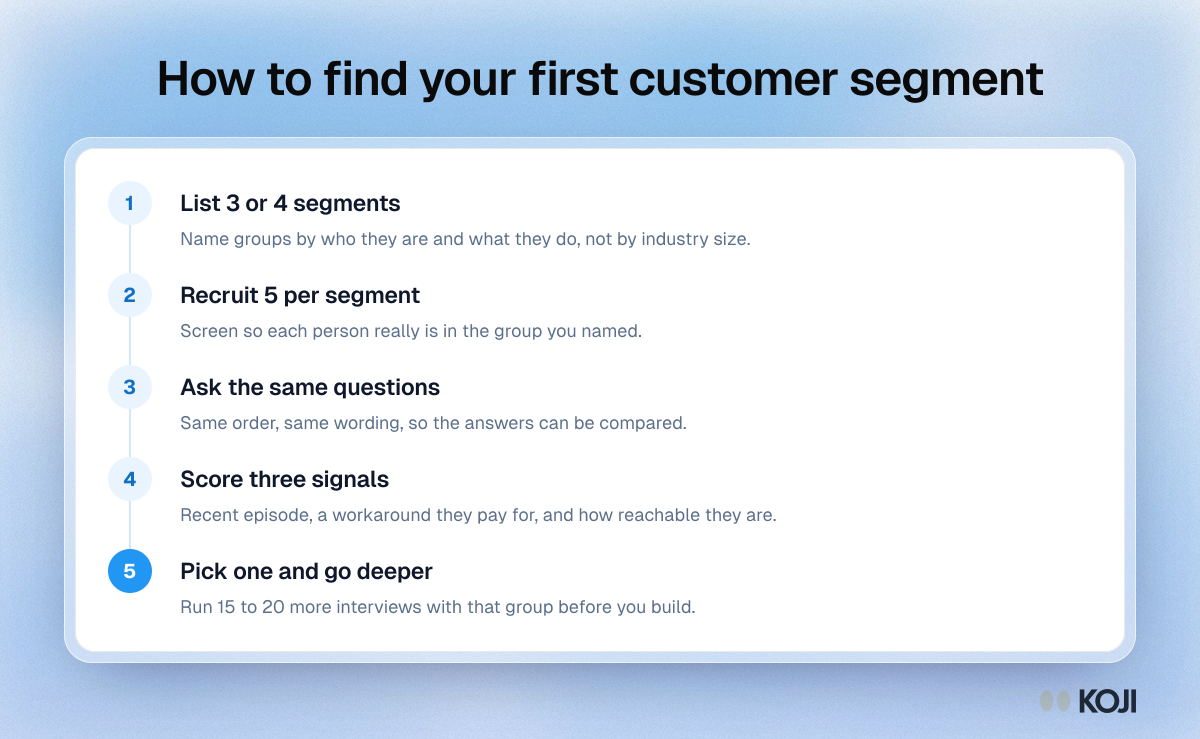
Process showing five steps to find a first customer segment: list segments, recruit five each, ask the same questions, score three signals, pick one.

Process

How to find your first customer segment
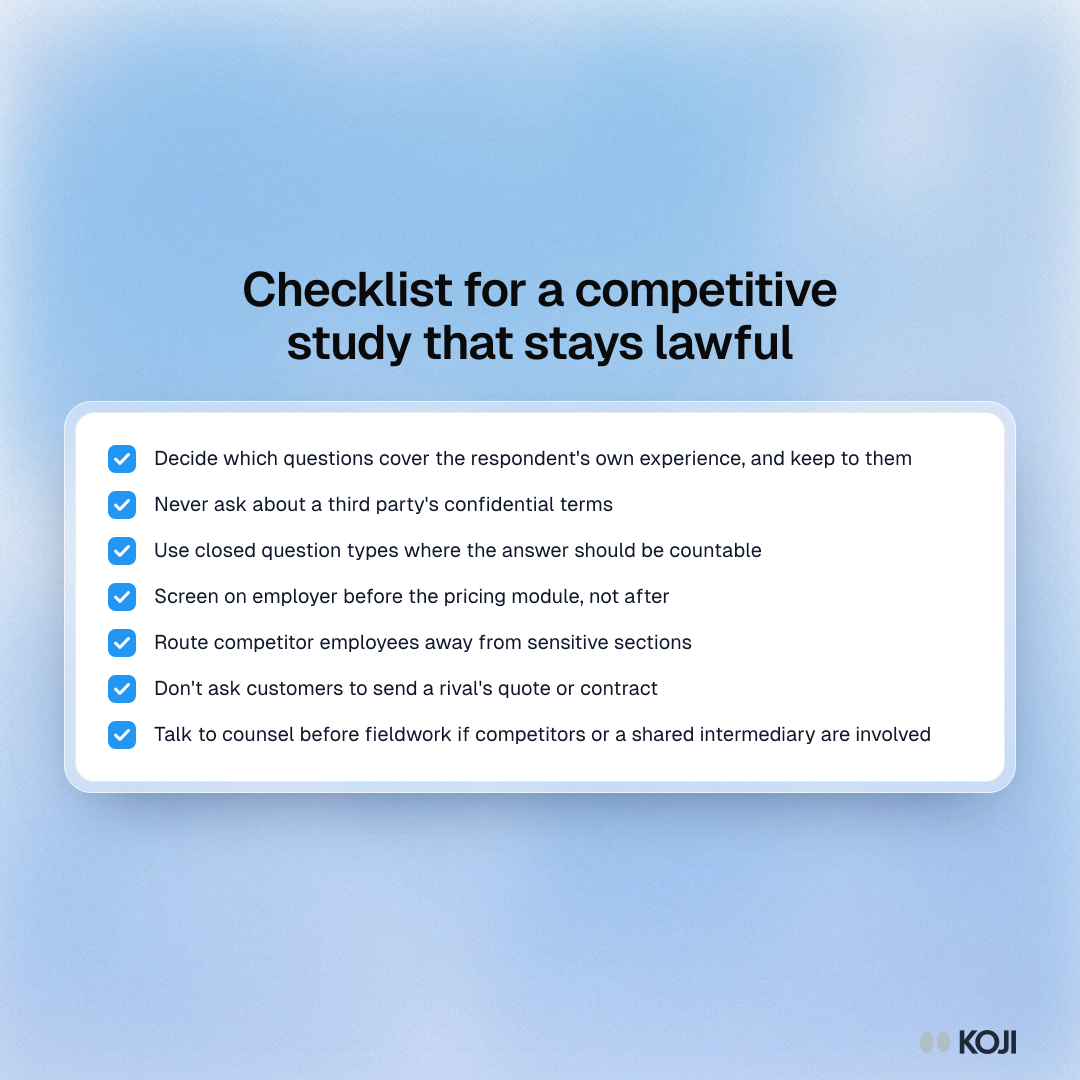
Checklist of seven design steps that keep competitive research clear of antitrust risk, from fixing question scope to screening out competitor staff.

Checklist

Checklist for a competitive study that stays lawful
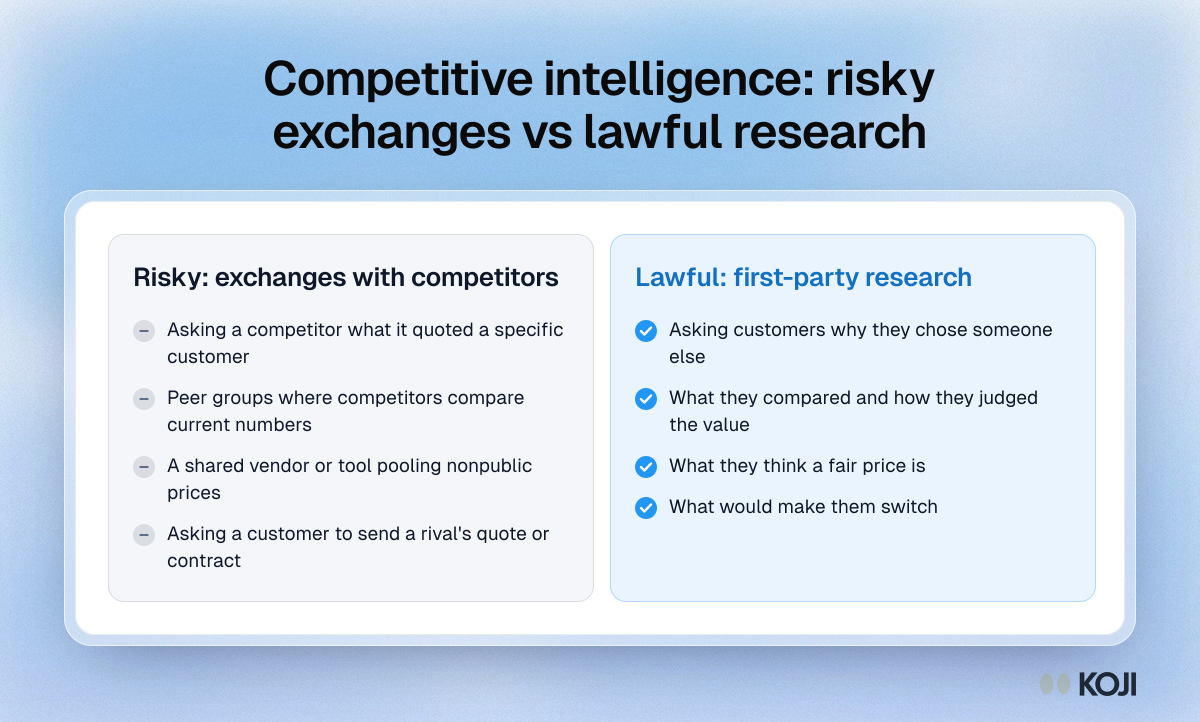
Comparison of risky competitive intelligence, like asking a rival what it quoted, against lawful first-party research, like asking customers why they chose.

Comparison

Competitive intelligence: risky exchanges vs lawful research
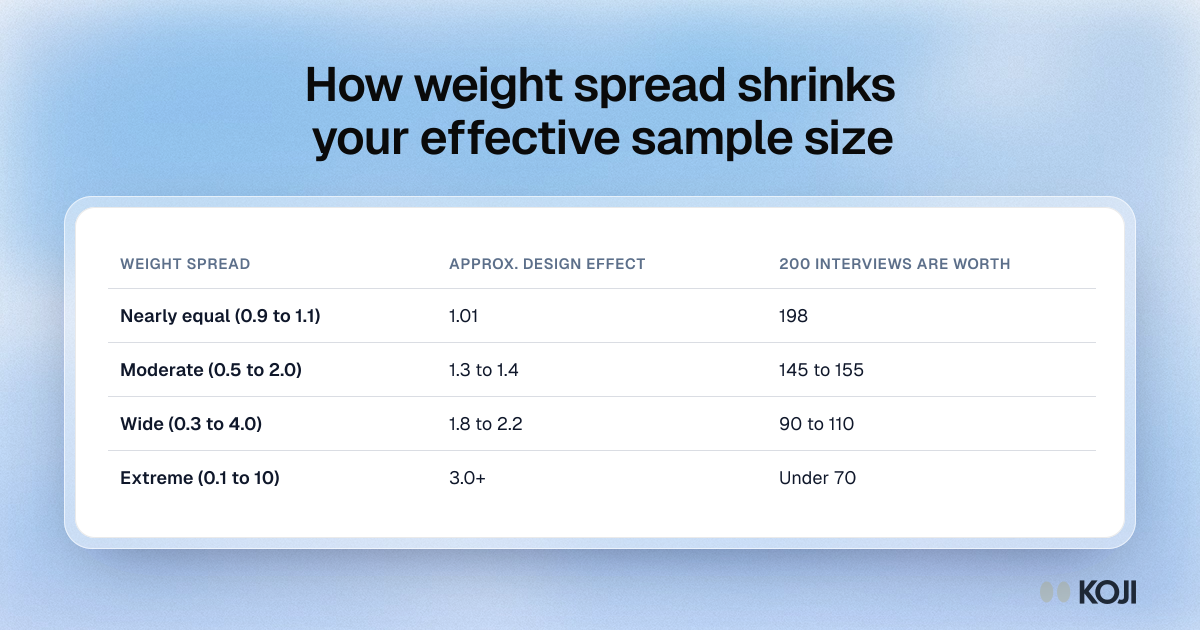
Table of weight spread against design effect: nearly equal weights keep 198 of 200 interviews, while extreme weights leave the precision of fewer than 70.

Reference table

How weight spread shrinks your effective sample size
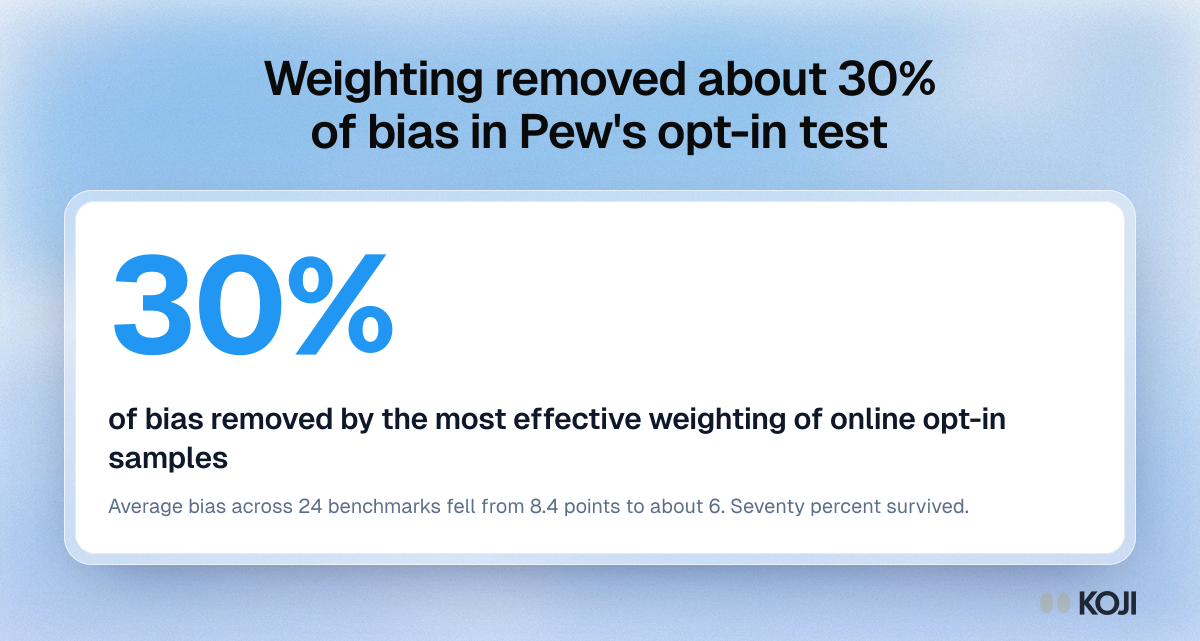
Stat card: the best weighting strategy removed roughly 30% of bias in online opt-in samples, from 8.4 points to about 6, in a Pew Research Center study.

Key figure

Weighting removed about 30% of bias in Pew's opt-in test
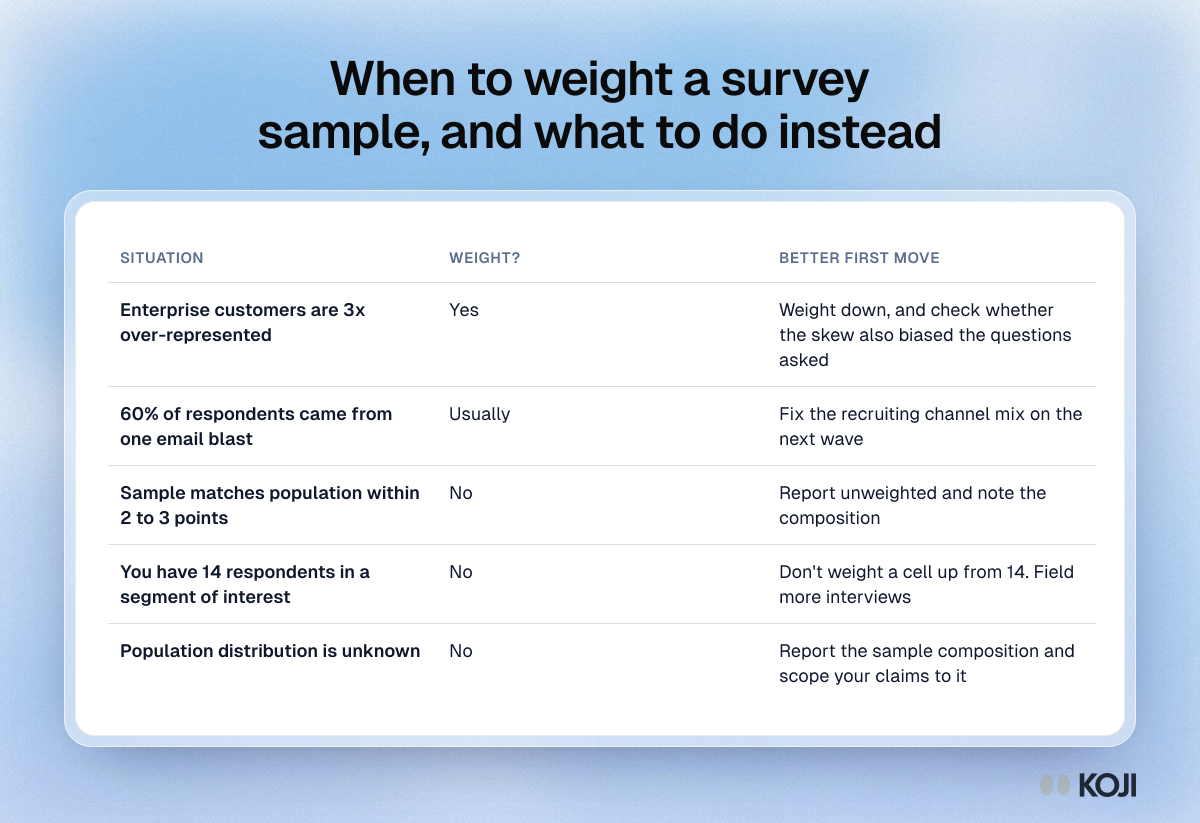
Table of five survey situations, from over-represented enterprise customers to an unknown population, with whether to weight and the better first move.

Reference table

When to weight a survey sample, and what to do instead
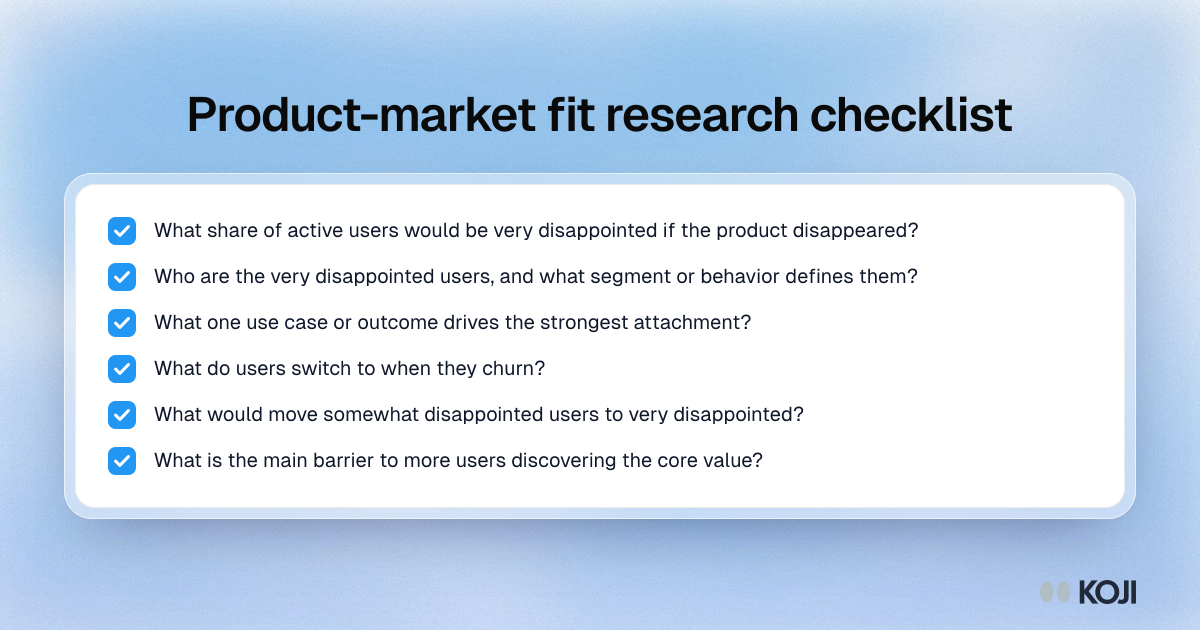
Checklist of six questions to answer before a product-market fit study is complete, from the very disappointed share to the barrier to core value.

Checklist

Product-market fit research checklist
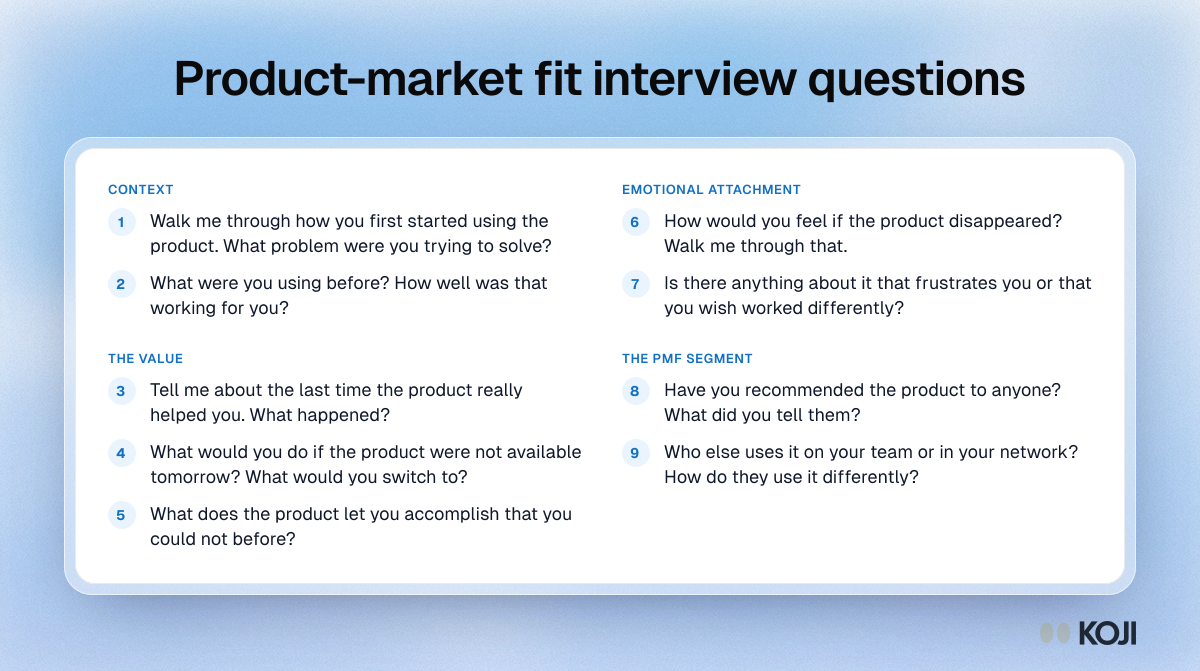
Question bank of nine product-market fit interview questions in four groups: context, the value, emotional attachment and the PMF segment.

Question bank

Product-market fit interview questions
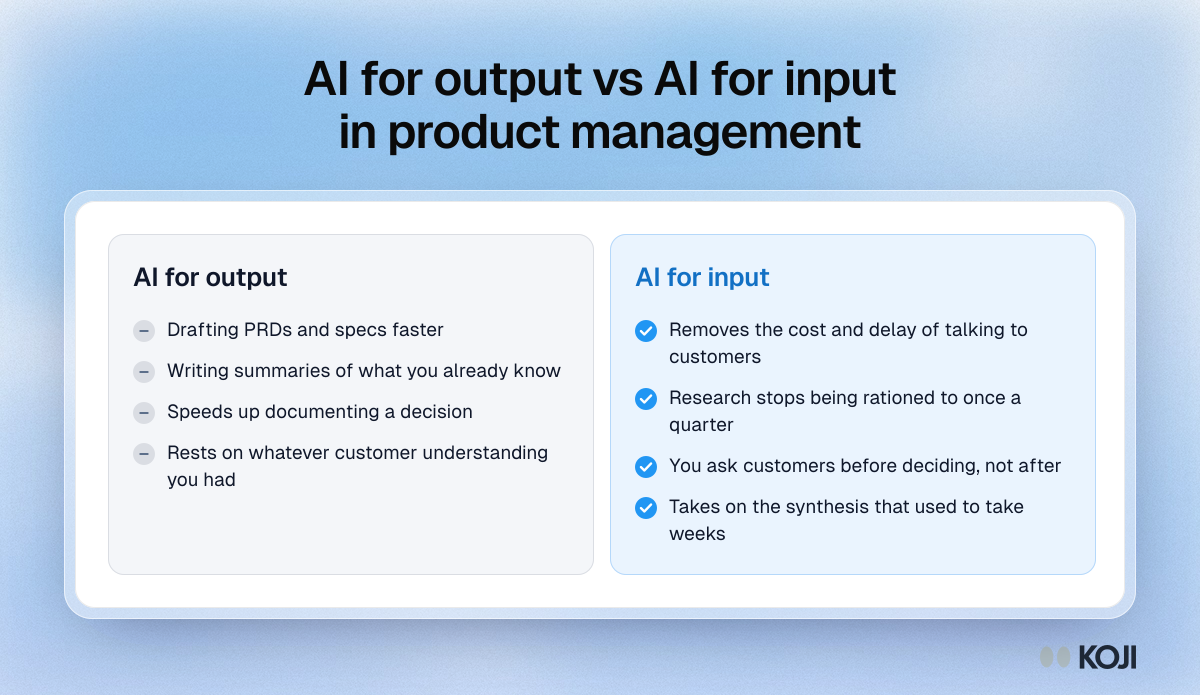
Comparison of AI for output, like drafting PRDs and summaries, against AI for input, like cutting the cost of talking to customers before deciding.

Comparison

AI for output vs AI for input in product management
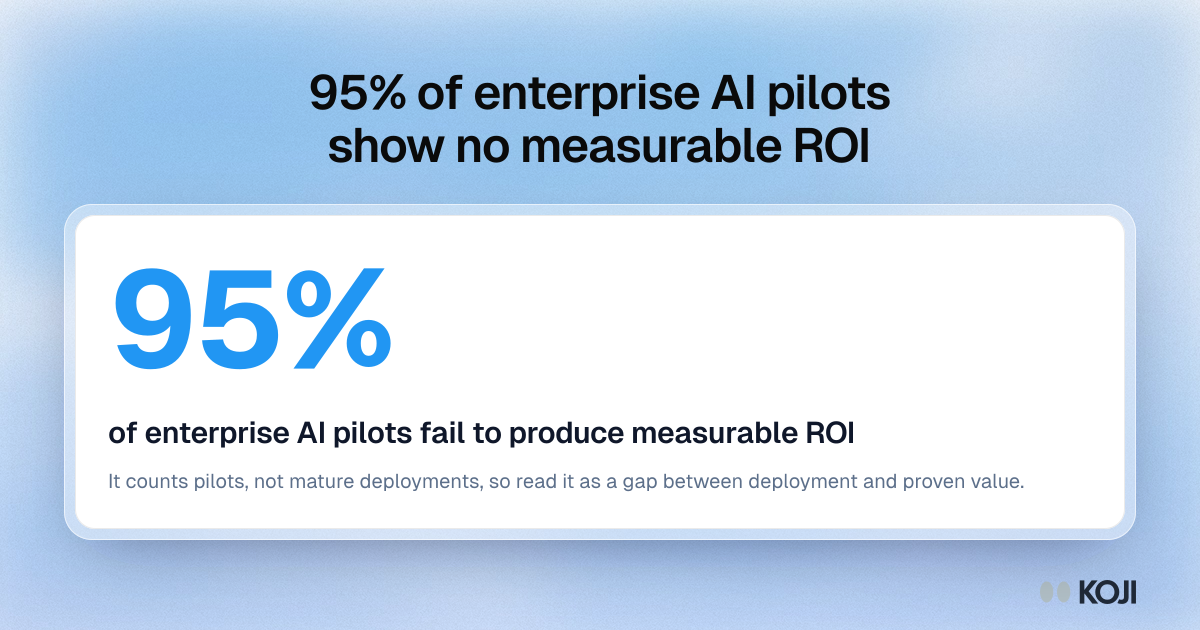
Stat card: 95% of enterprise AI pilots produced no measurable return on investment, according to MIT research.

Key figure

95% of enterprise AI pilots show no measurable ROI
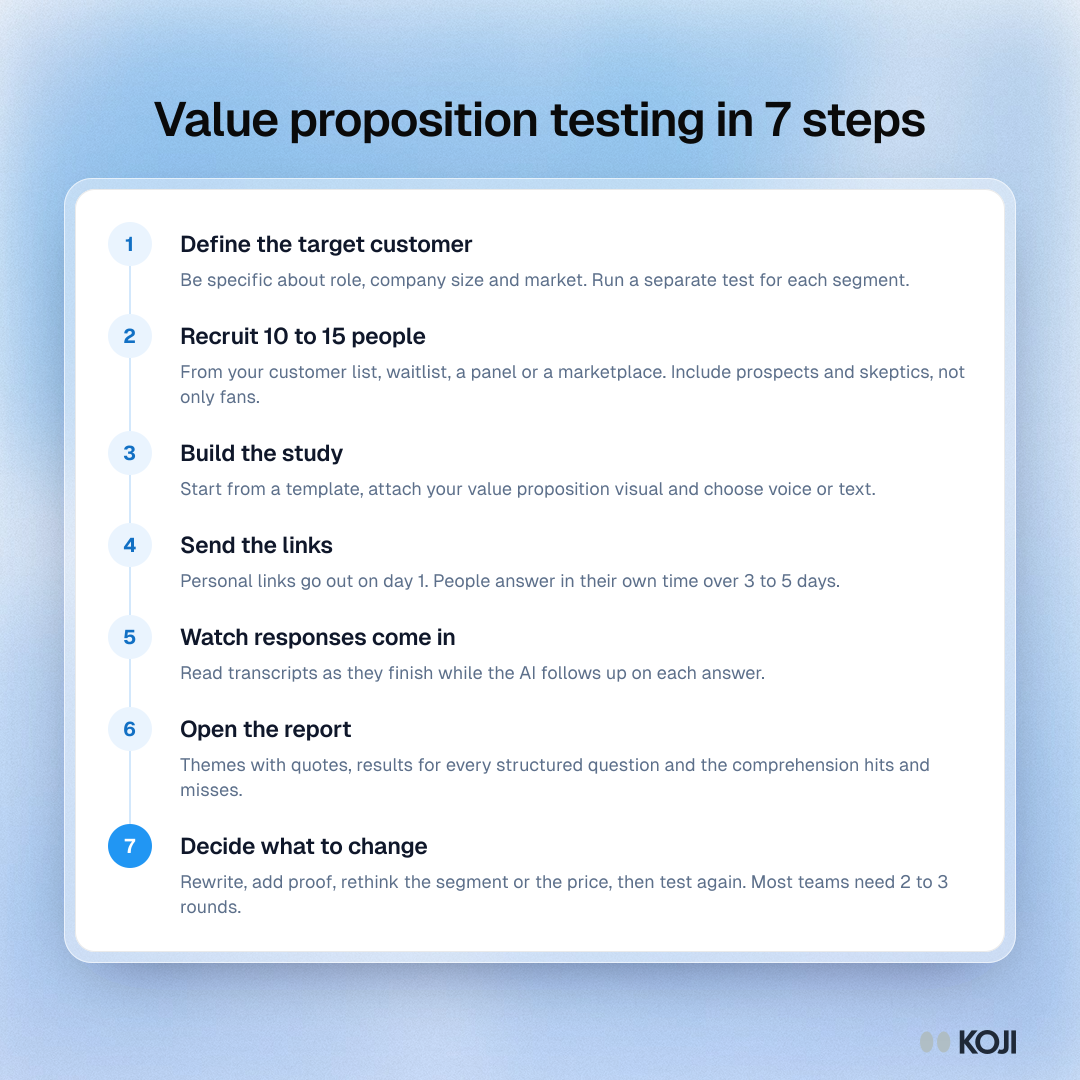
Process of seven steps for testing a value proposition with customer interviews, from defining the target customer to deciding what to change and testing again.

Process

Value proposition testing in 7 steps
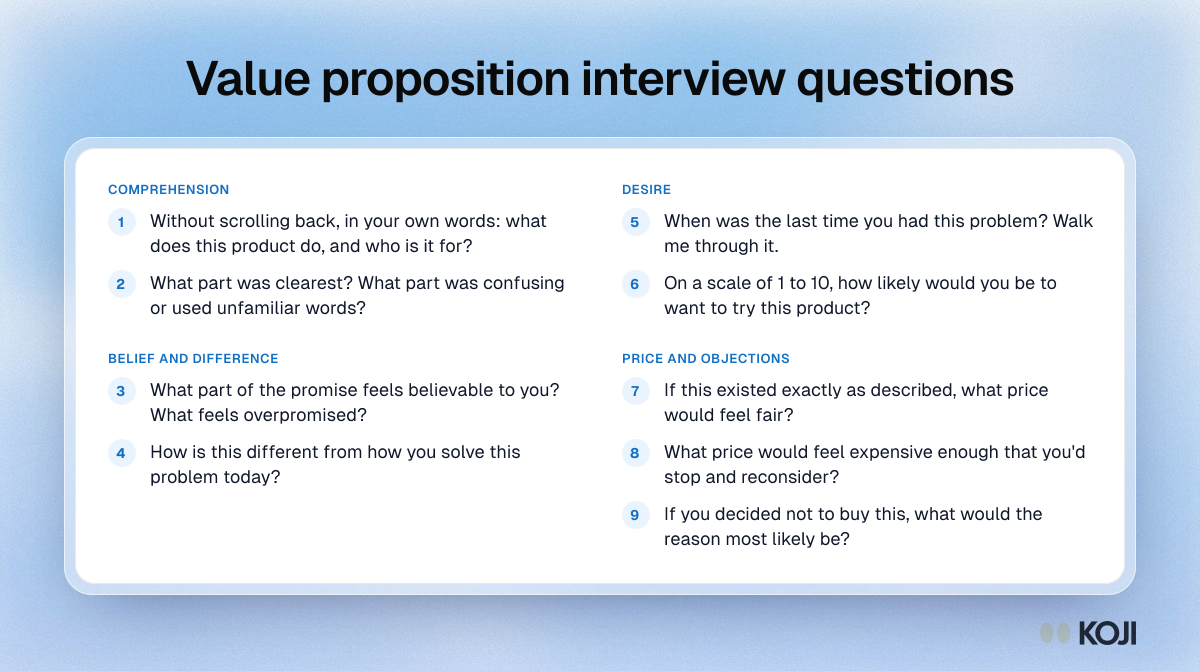
Question bank of nine value proposition interview questions in four groups: comprehension, belief and difference, desire, and price and objections.

Question bank

Value proposition interview questions
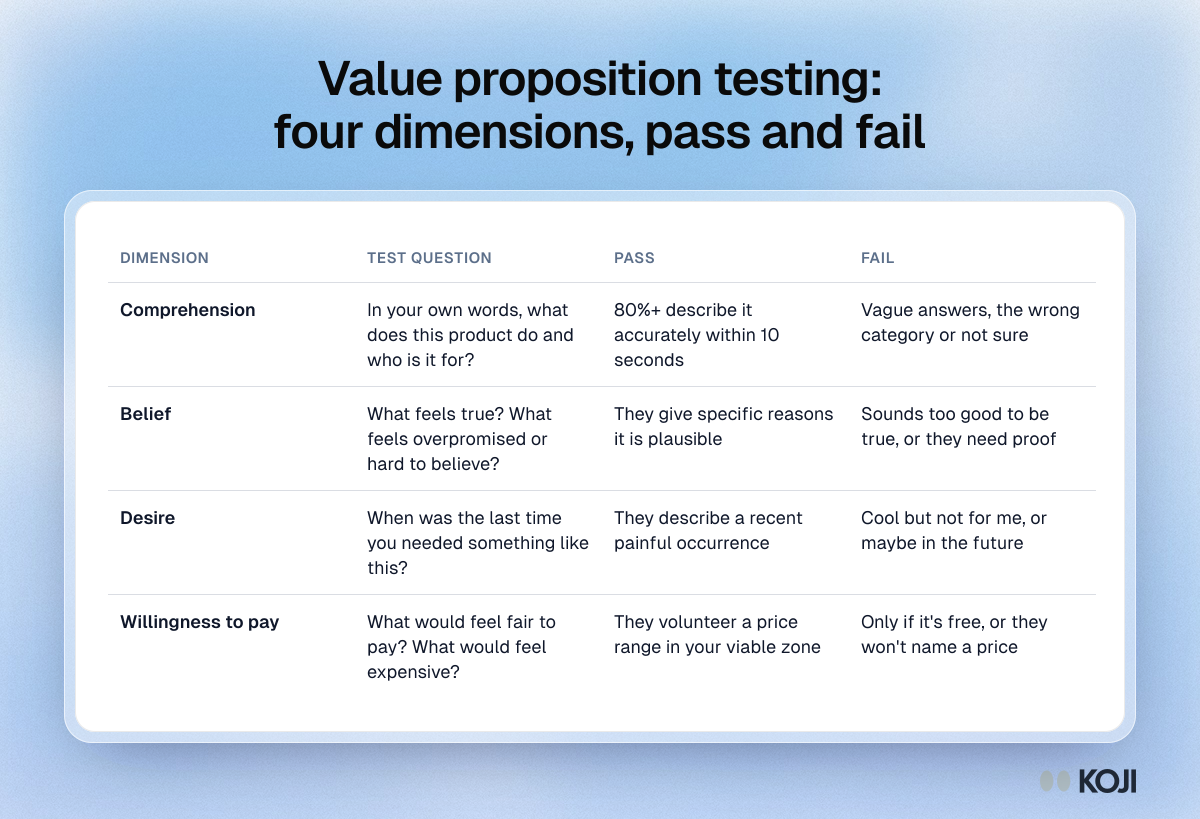
Table of four value proposition test dimensions, comprehension, belief, desire and willingness to pay, with a test question and pass and fail signs.

Reference table

Value proposition testing: four dimensions, pass and fail
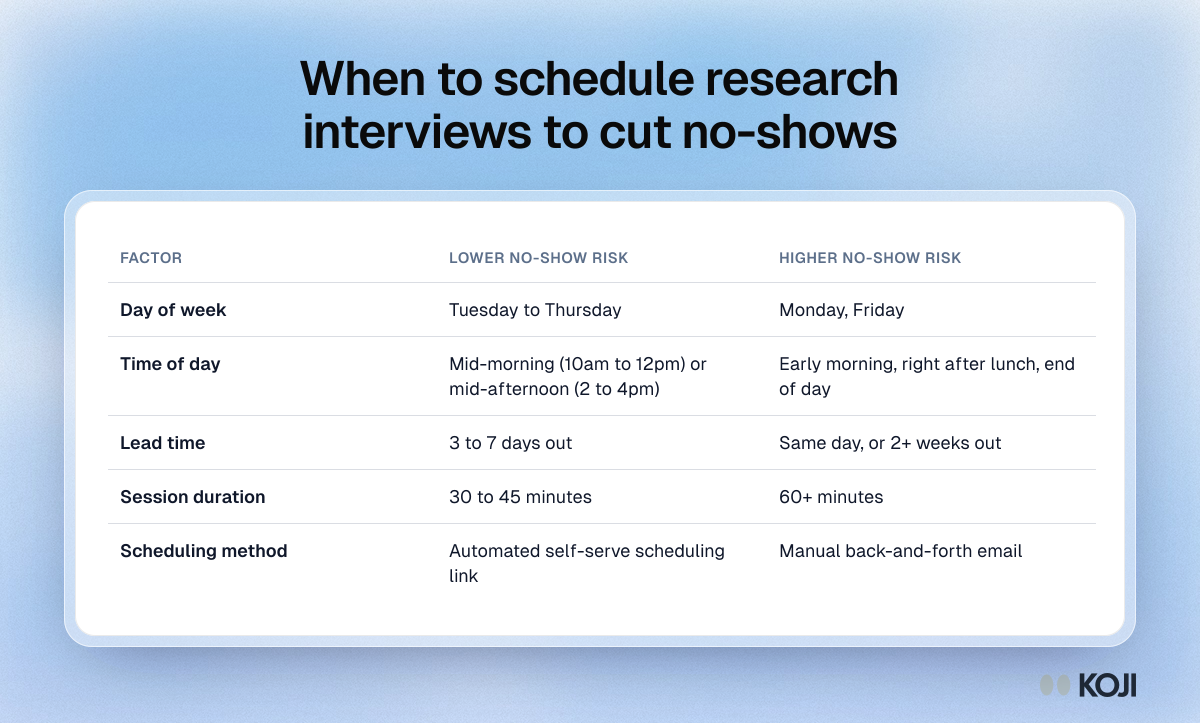
Table comparing lower and higher no-show risk for research interviews by day of week, time of day, lead time, session length and scheduling method.

Reference table

When to schedule research interviews to cut no-shows
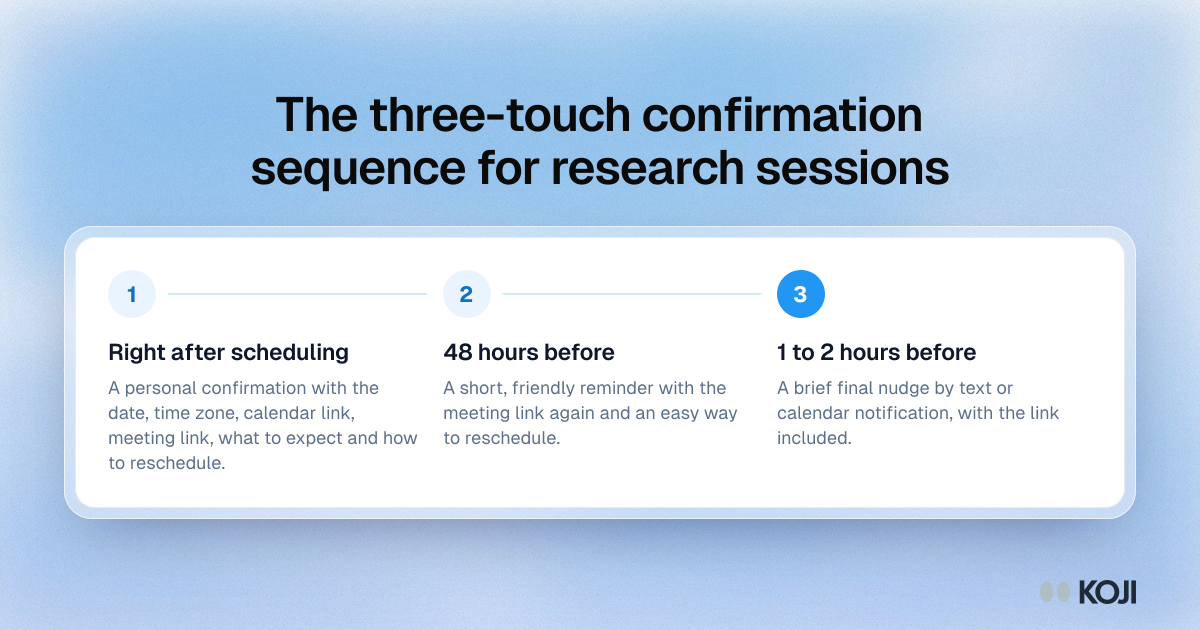
Process of three reminders before a research interview: a full confirmation right after booking, a reminder 48 hours before and a text 1 to 2 hours before.

Process

The three-touch confirmation sequence for research sessions
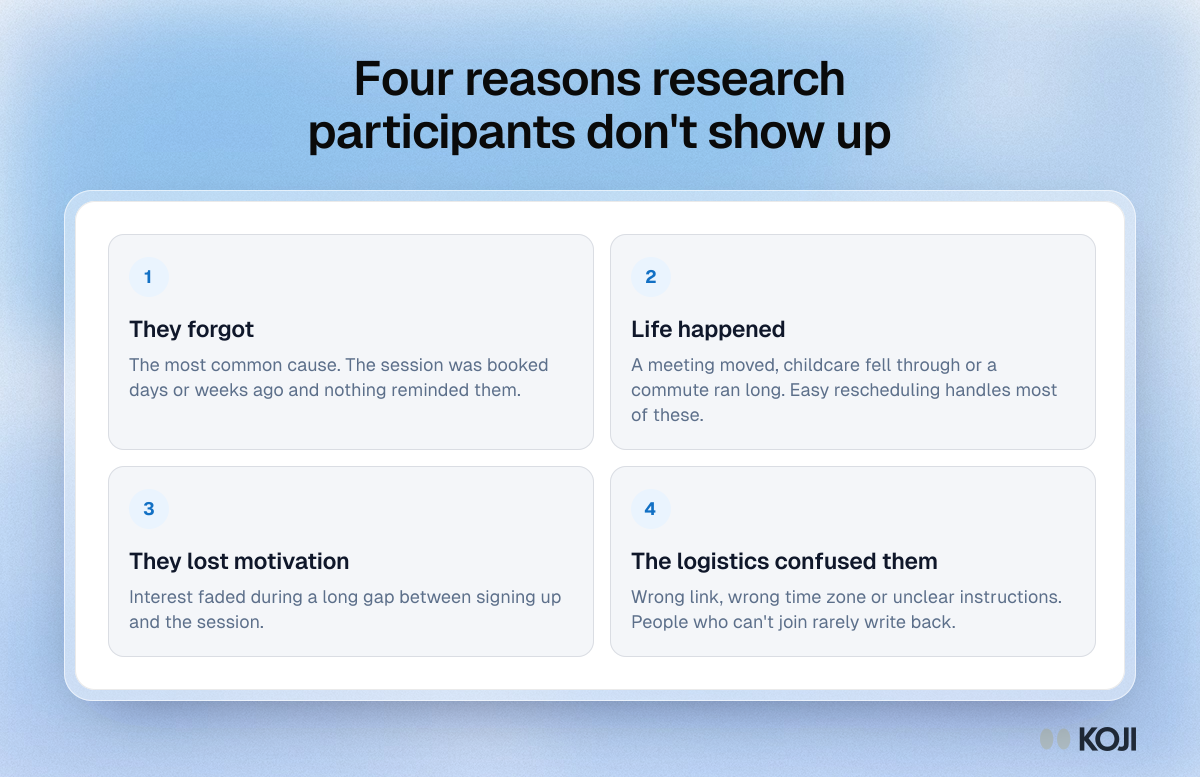
Framework of the four causes of research interview no-shows: they forgot, life happened, they lost motivation, or the logistics confused them.

Framework

Four reasons research participants don't show up
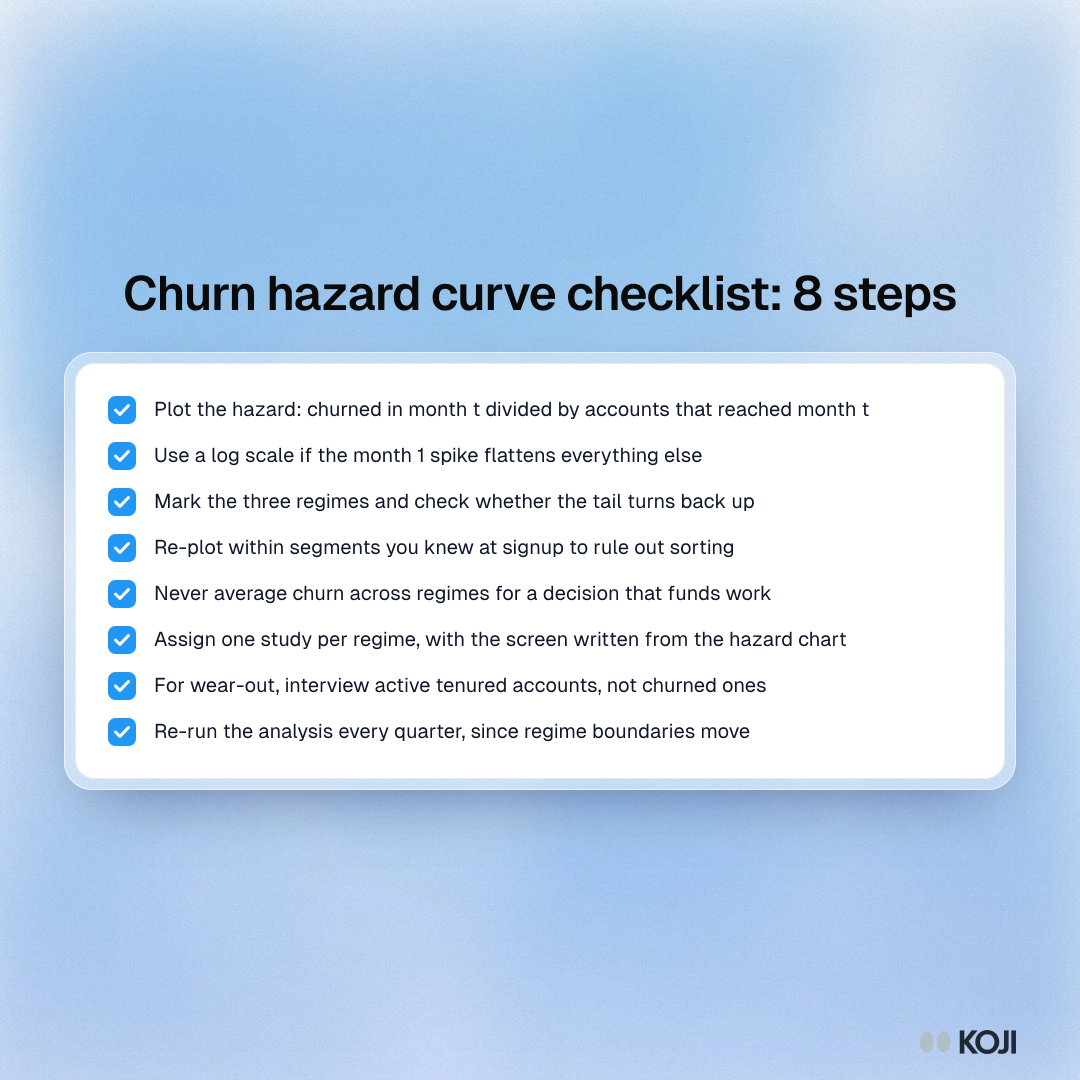
Checklist of eight steps for a churn hazard analysis, from dividing churn by accounts that reached each month to re-running the analysis every quarter.

Checklist

Churn hazard curve checklist: 8 steps
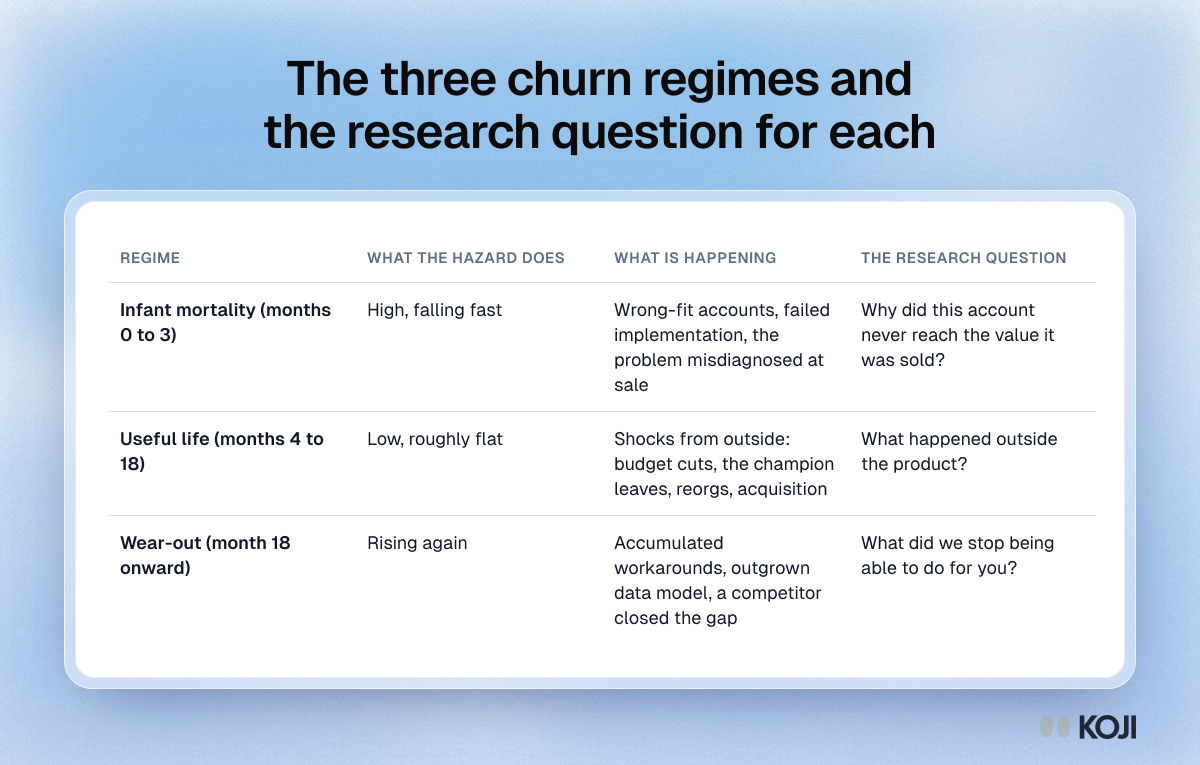
Table of three churn hazard regimes: infant mortality in months 0 to 3, useful life in months 4 to 18 and wear-out after 18, with causes and research questions.

Reference table

The three churn regimes and the research question for each
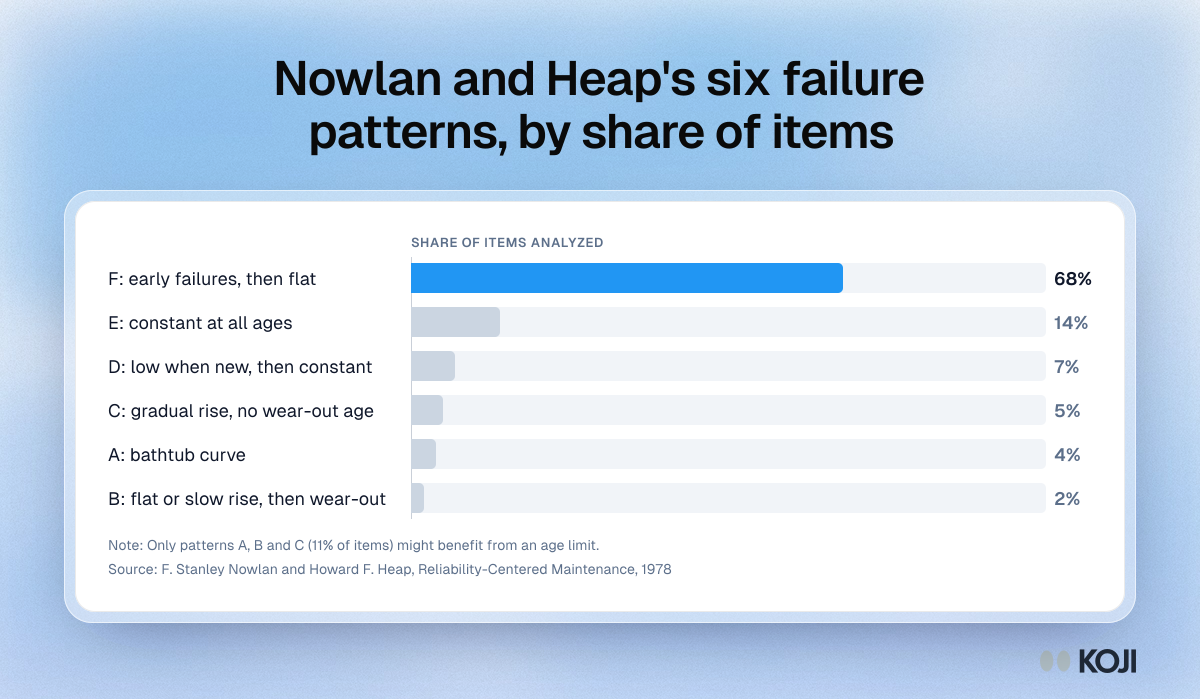
Bar chart of United Airlines components by failure pattern: F early failures then flat 68%, E constant 14%, D 7%, C 5%, A bathtub 4%, B 2%.

Bar chart

Nowlan and Heap's six failure patterns, by share of items
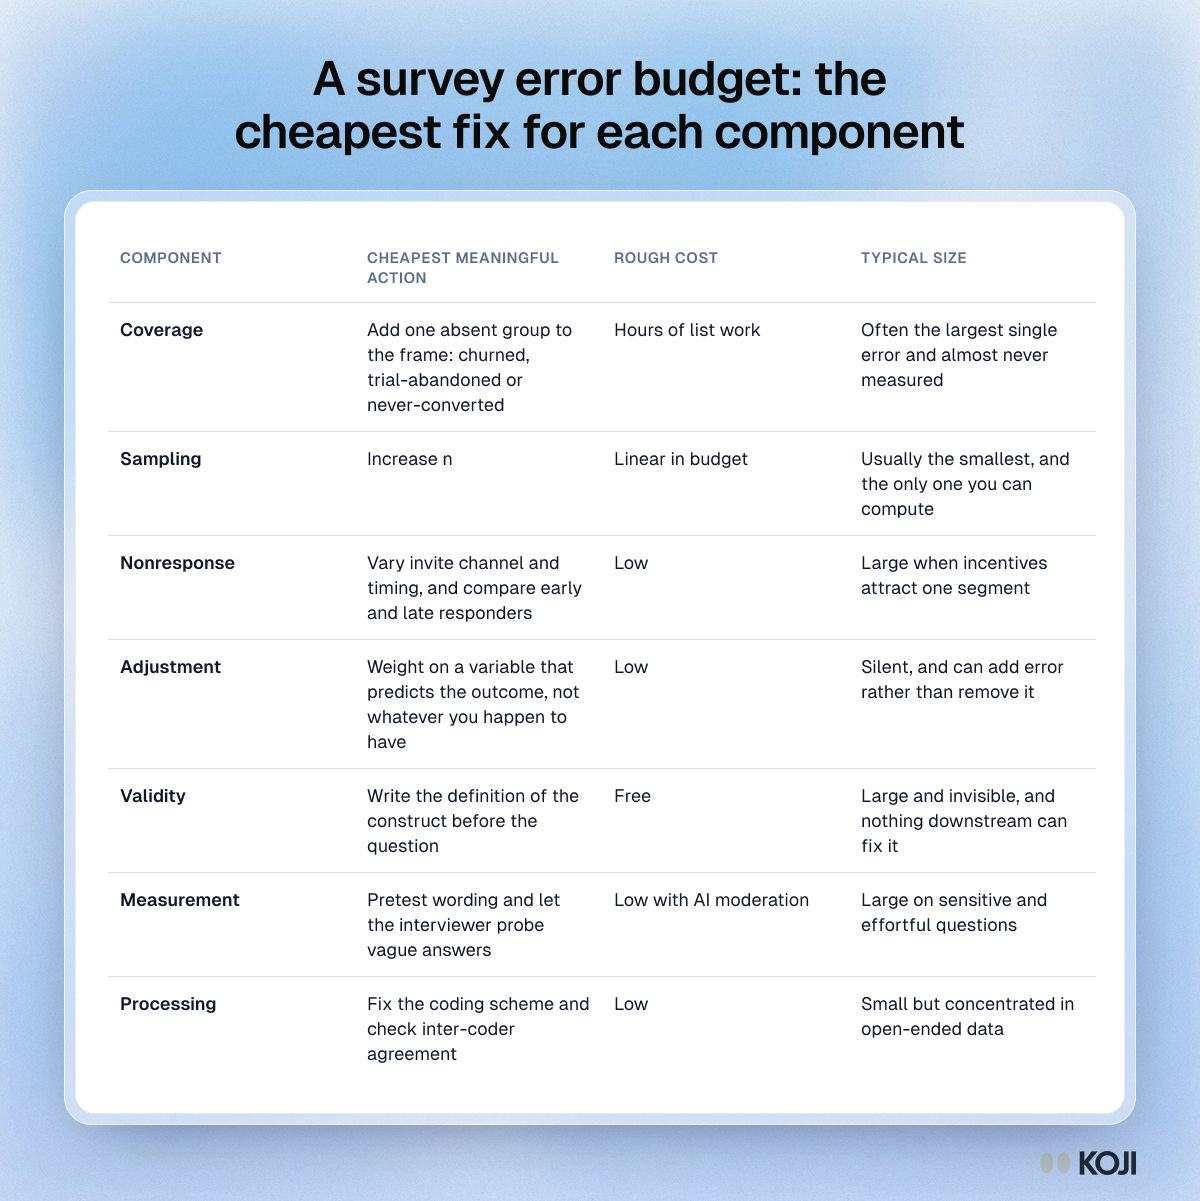
Table of a survey error budget listing the cheapest action, rough cost and typical size of each of the seven total survey error components in product research.

Reference table

A survey error budget: the cheapest fix for each component
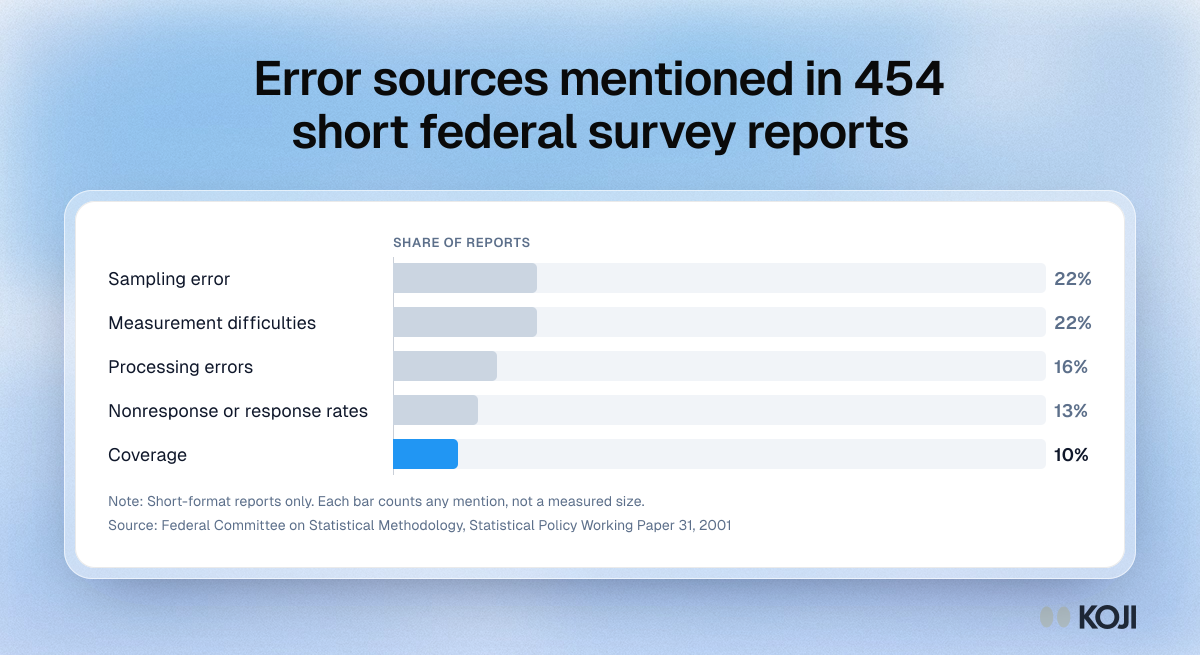
Bar chart of 454 short federal survey reports by error source mentioned: sampling 22%, measurement 22%, processing 16%, nonresponse 13%, coverage 10%.

Bar chart

Error sources mentioned in 454 short federal survey reports
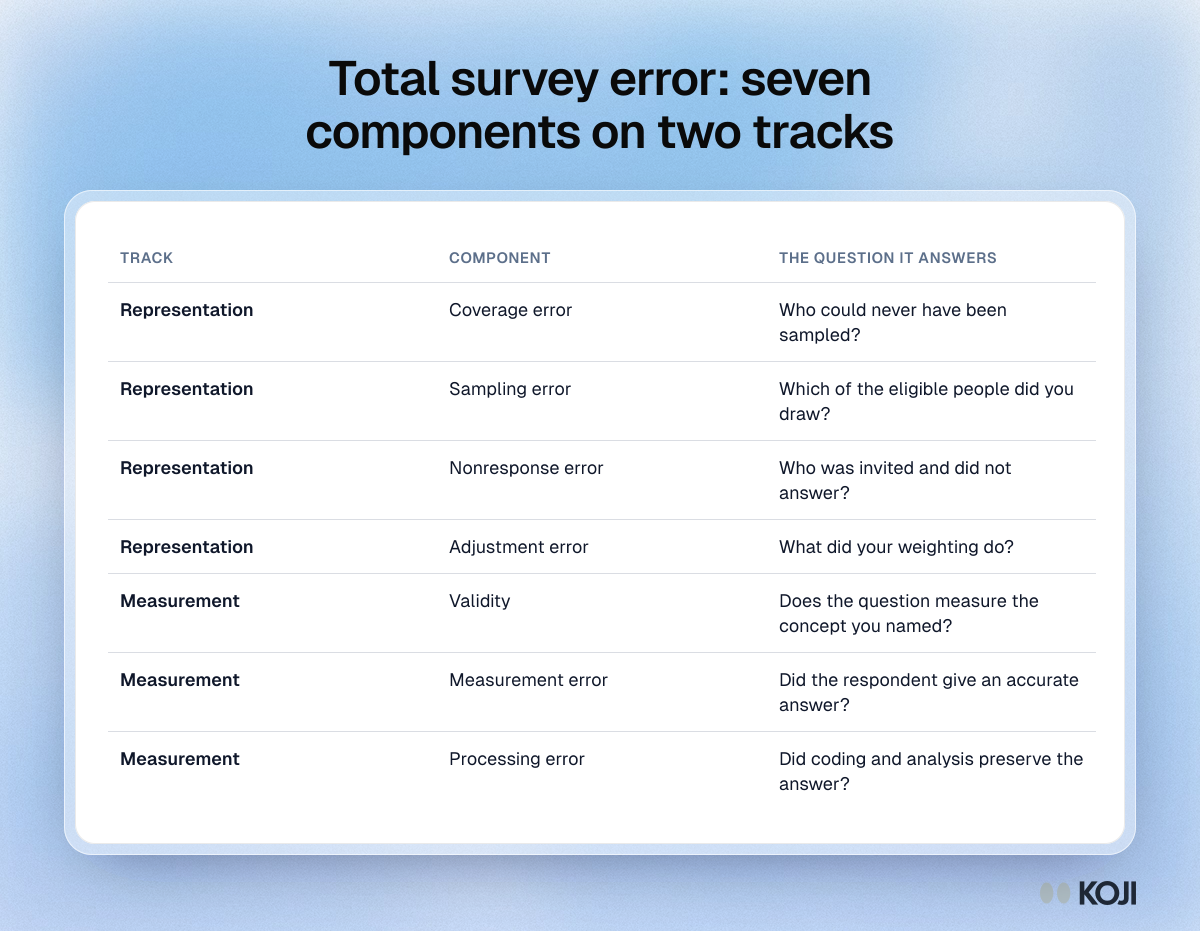
Table of the seven parts of total survey error: coverage, sampling, nonresponse and adjustment, then validity, measurement and processing.

Reference table

Total survey error: seven components on two tracks
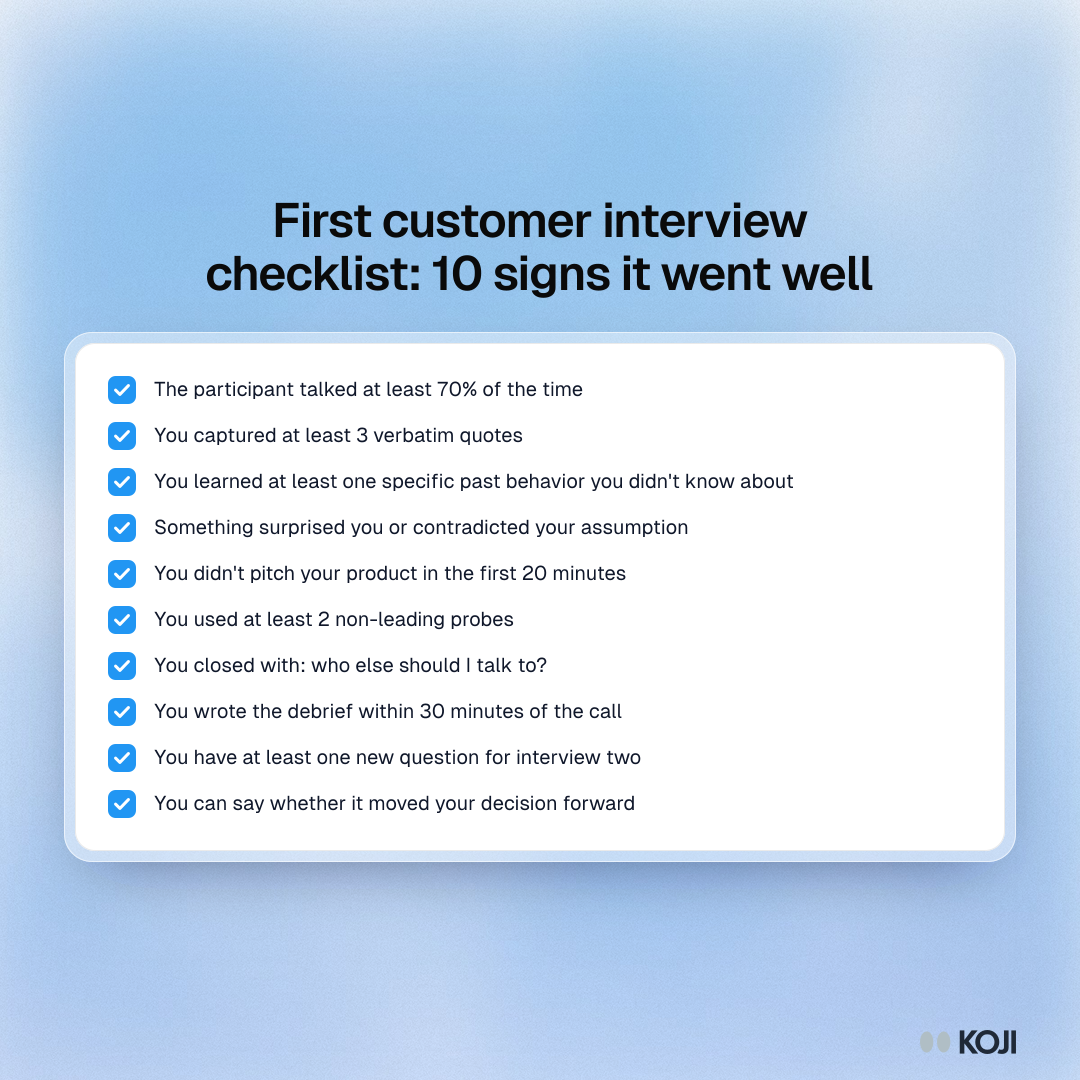
Checklist of ten signs a first customer interview went well, from the participant talking 70% of the time to a debrief within 30 minutes.

Checklist

First customer interview checklist: 10 signs it went well
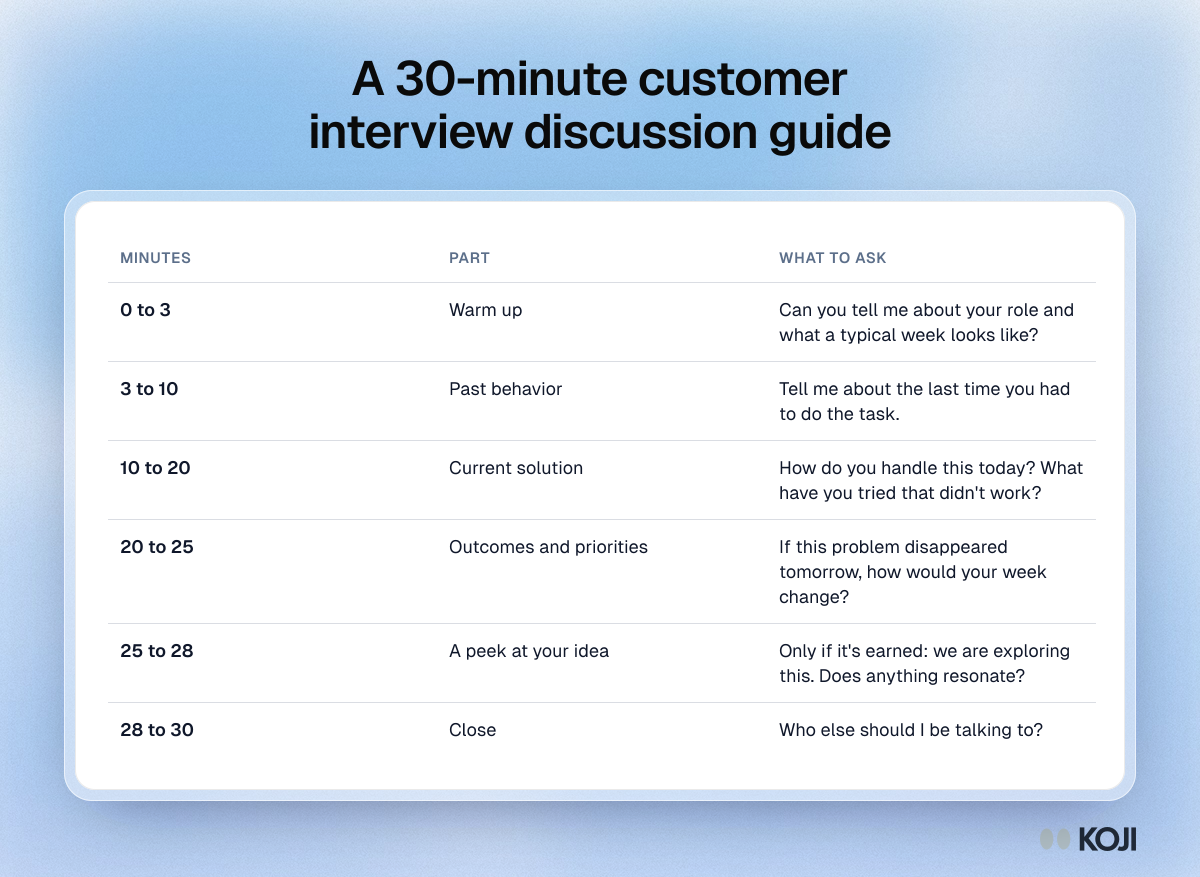
Table of a 30-minute customer interview guide with timings: warm up, past behavior, current solution, outcomes, a peek at your idea and the close.

Reference table

A 30-minute customer interview discussion guide
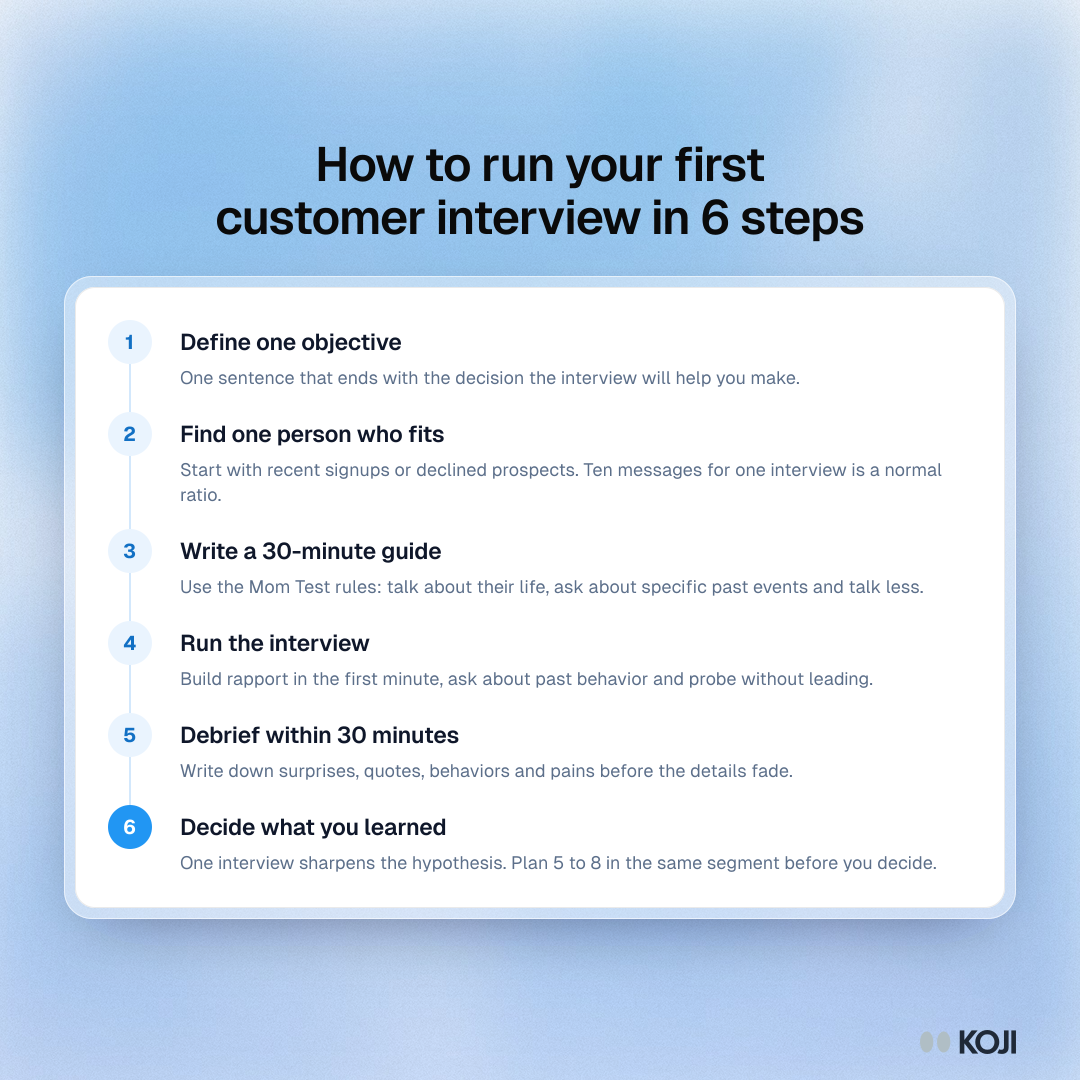
Process showing six steps for a first customer interview: set one objective, find one person, write the guide, run it, debrief and decide.

Process

How to run your first customer interview in 6 steps
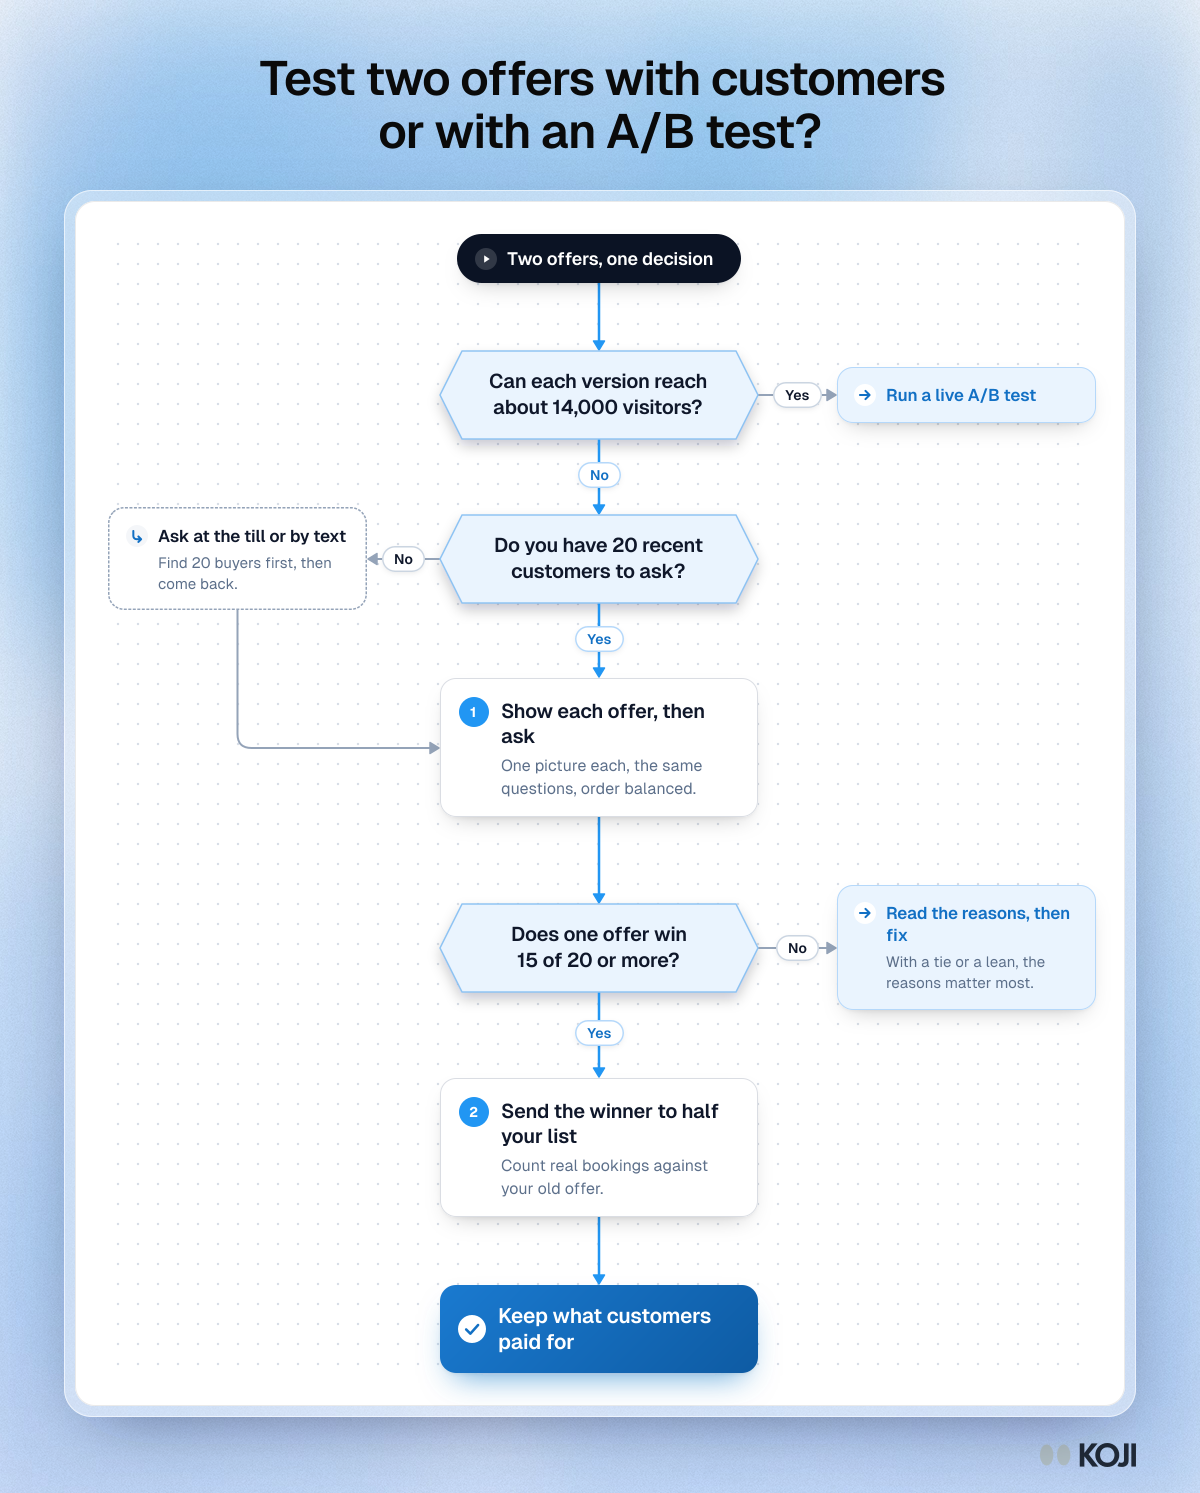
Flowchart for choosing between a live A/B test and asking 20 customers about two offers: three questions, one side step, ending in a split send.

Flowchart

Test two offers with customers or with an A/B test?
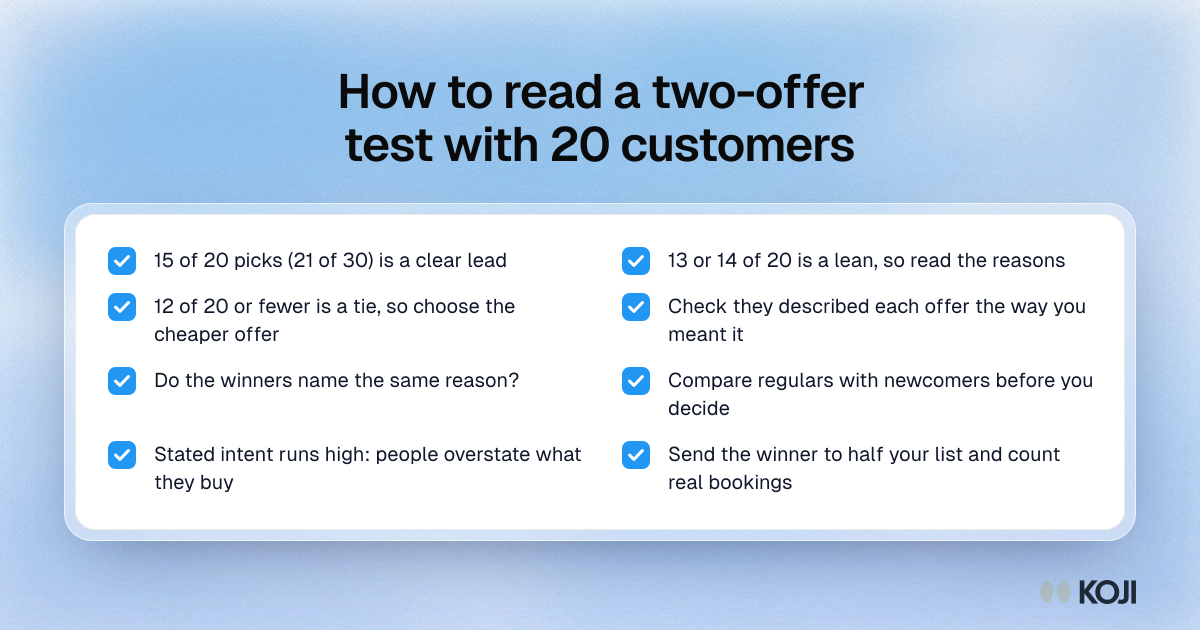
Checklist for reading a two-offer customer test: count the picks, read the reasons, compare regulars with newcomers and confirm with a real send.

Checklist

How to read a two-offer test with 20 customers
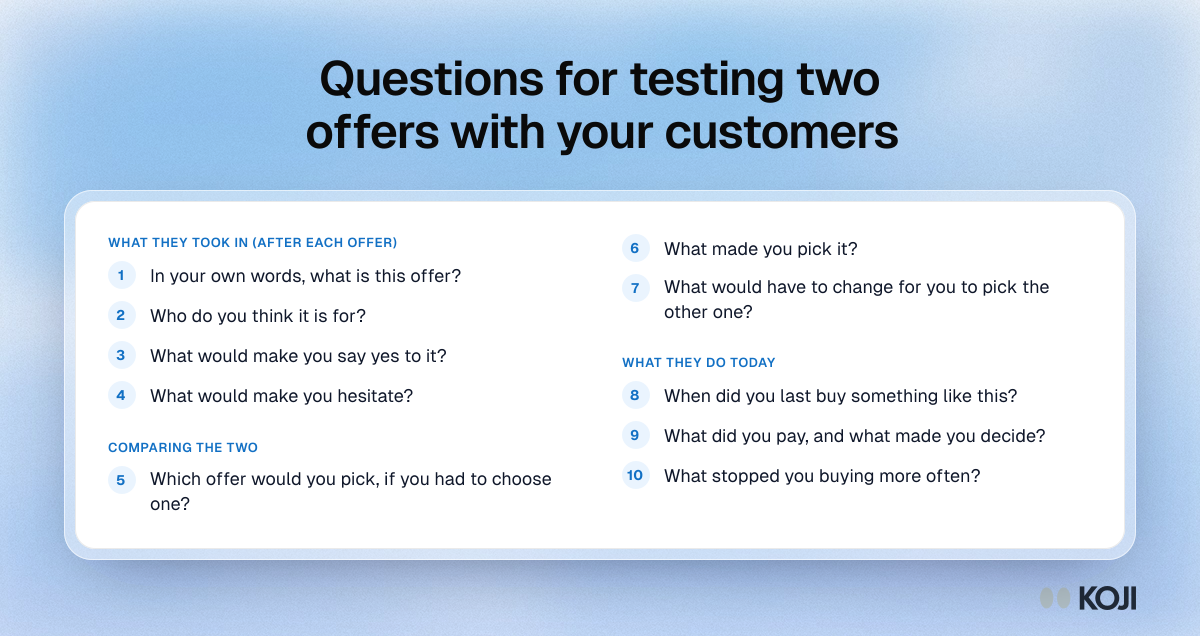
Question bank for testing two offers with customers: what they took in, a head-to-head choice, and what they do today. Ten questions in three sections.

Question bank

Questions for testing two offers with your customers
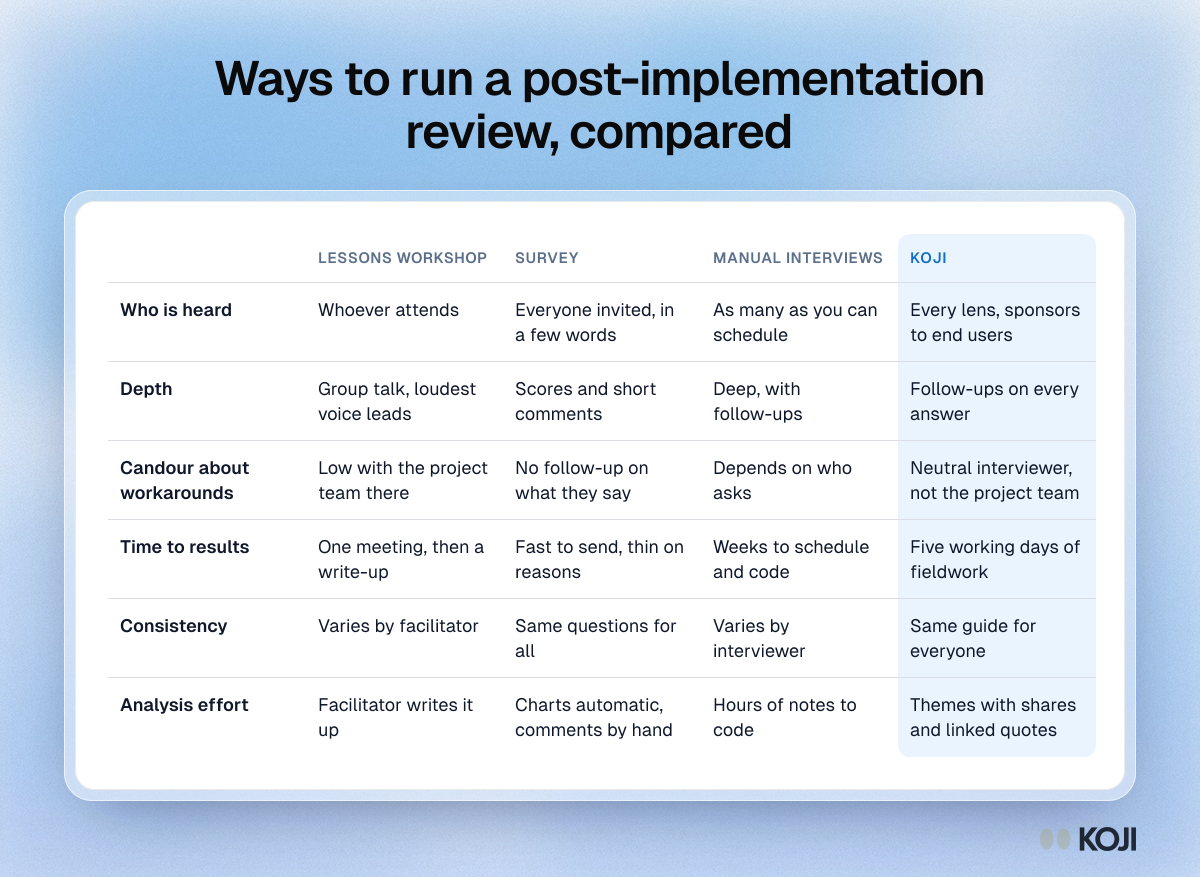
Table comparing a lessons-learned workshop, a survey, manual interviews and Koji for a post-implementation review on reach, depth, candour and analysis effort.

Reference table

Ways to run a post-implementation review, compared
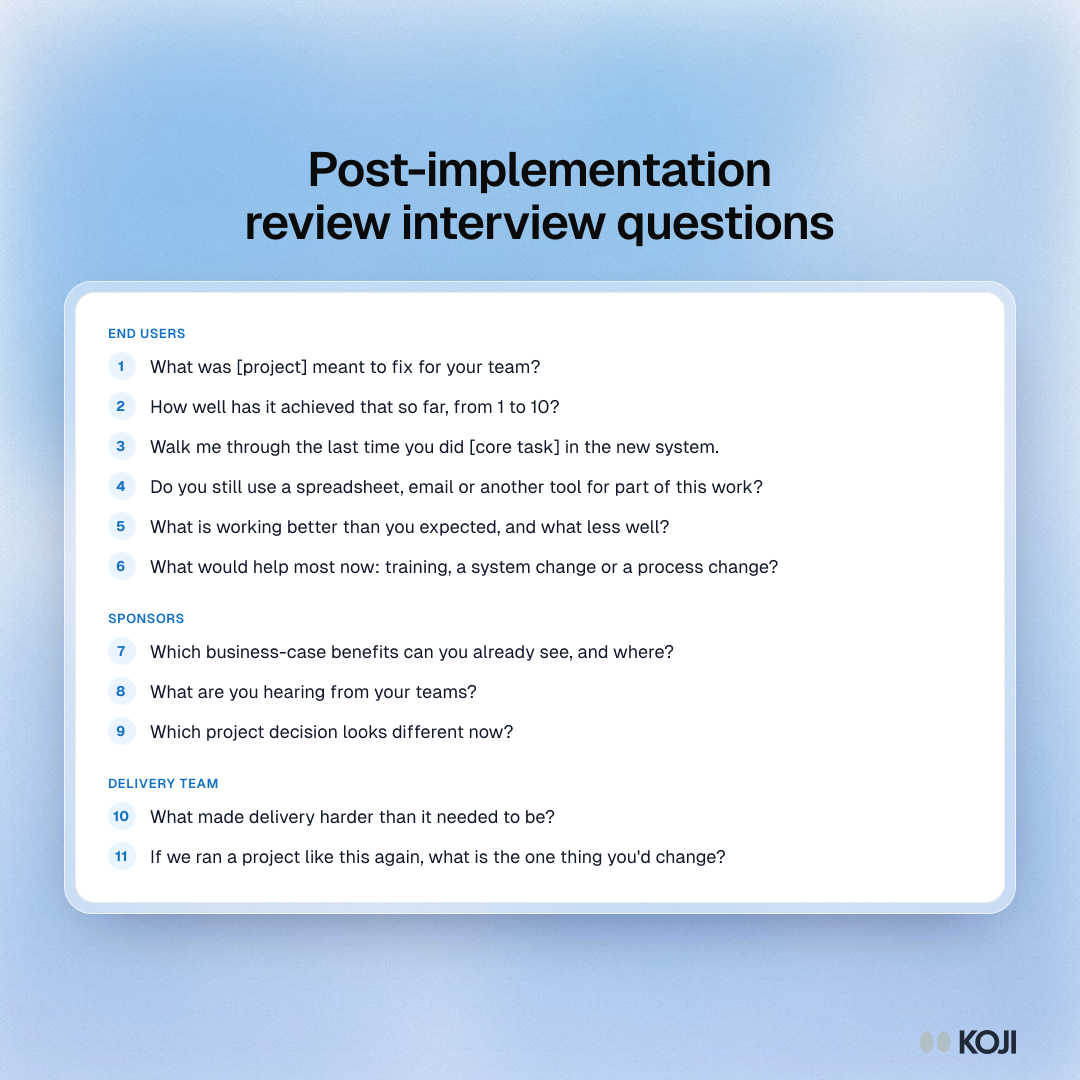
Question bank for a post-implementation review interview with end users, sponsors and the delivery team, in three themed sections.

Question bank

Post-implementation review interview questions
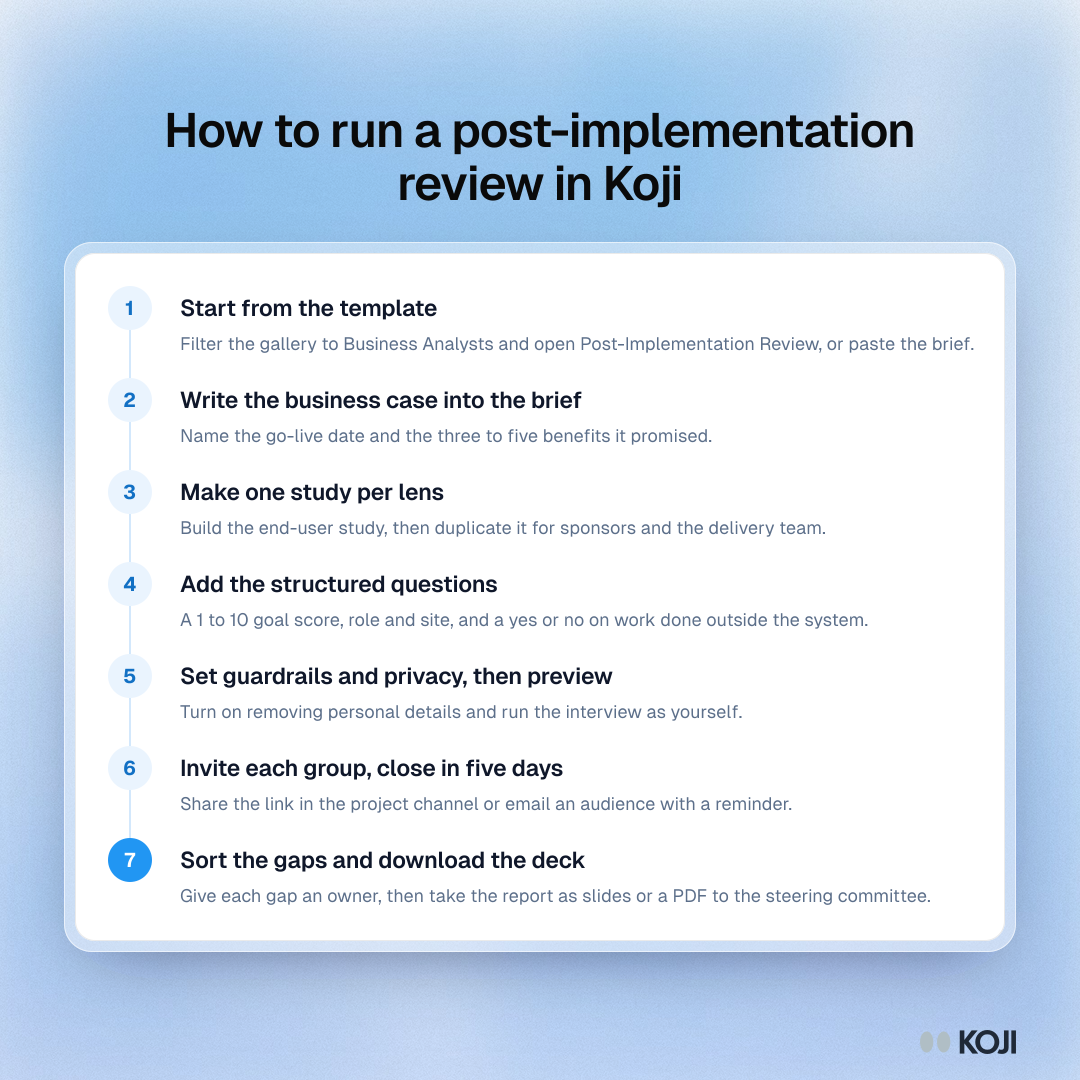
Process showing seven steps to run a post-implementation review in Koji, from the template to a deck for the steering committee.

Process

How to run a post-implementation review in Koji
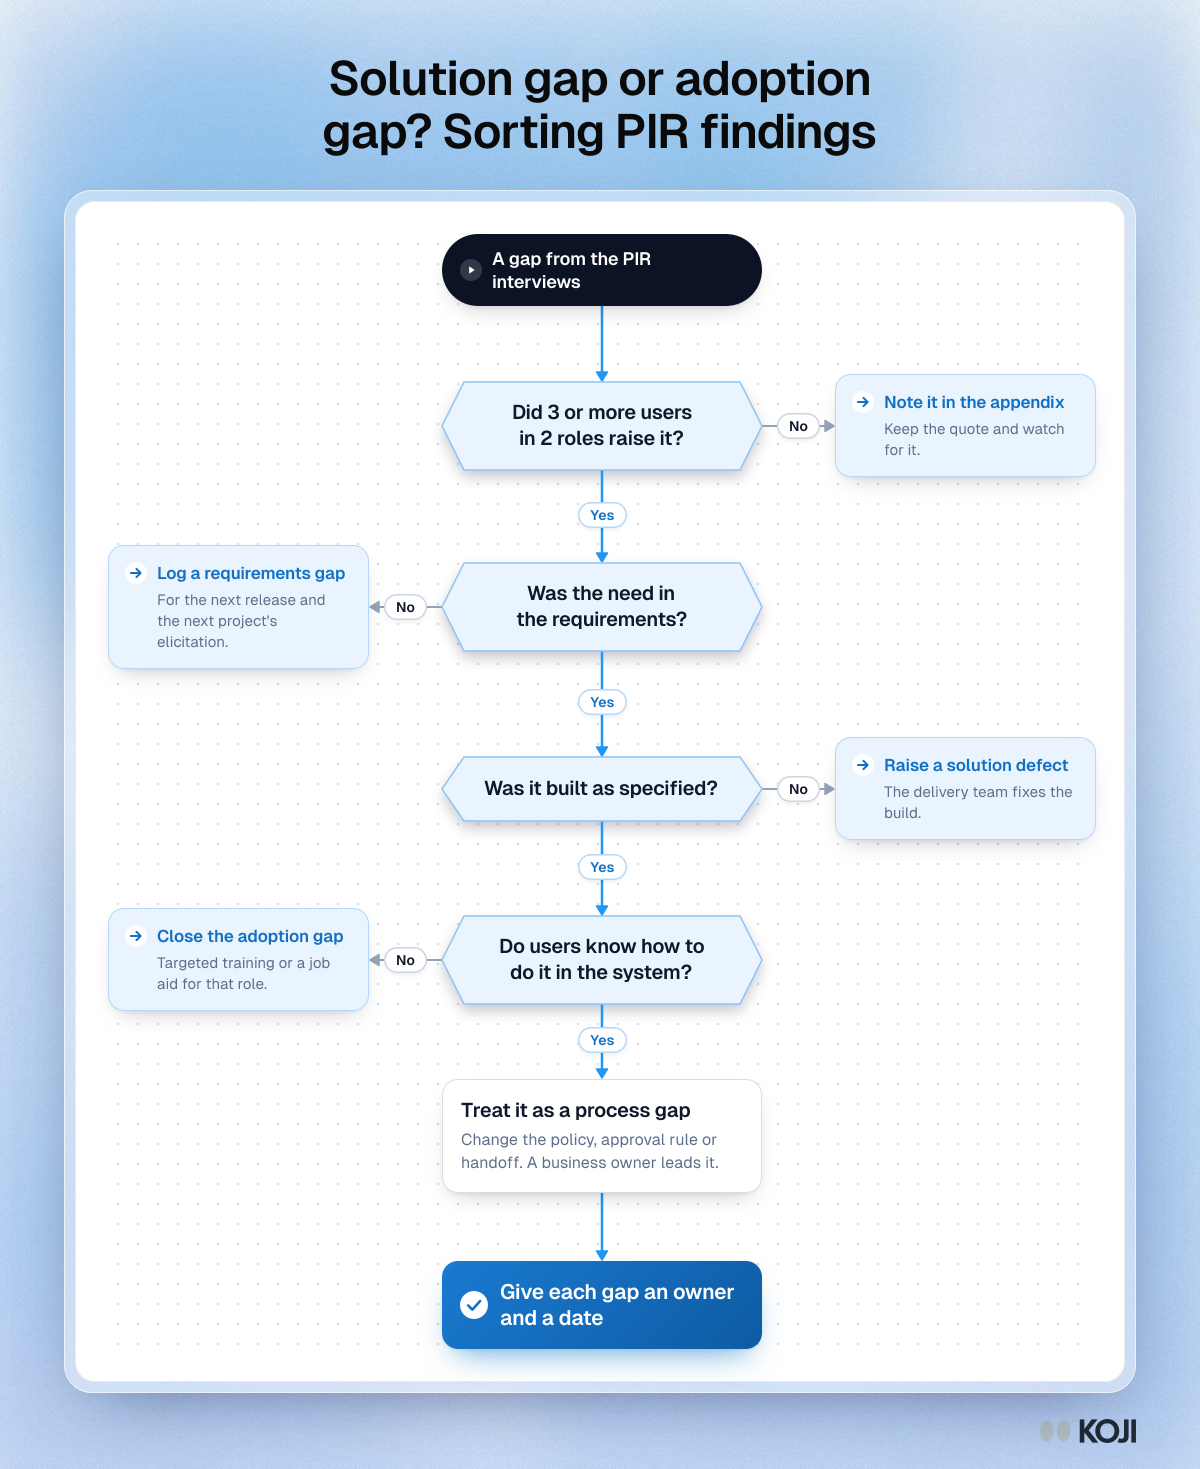
Flowchart for sorting a post-implementation review gap with four yes or no questions, from how many users raised it to requirements, build and training.

Flowchart

Solution gap or adoption gap? Sorting PIR findings