Free to save and share

Frameworks and cheat sheets for customer research

Every framework, checklist and comparison from our guides, as an image you can download, drop into a deck or share with your team.
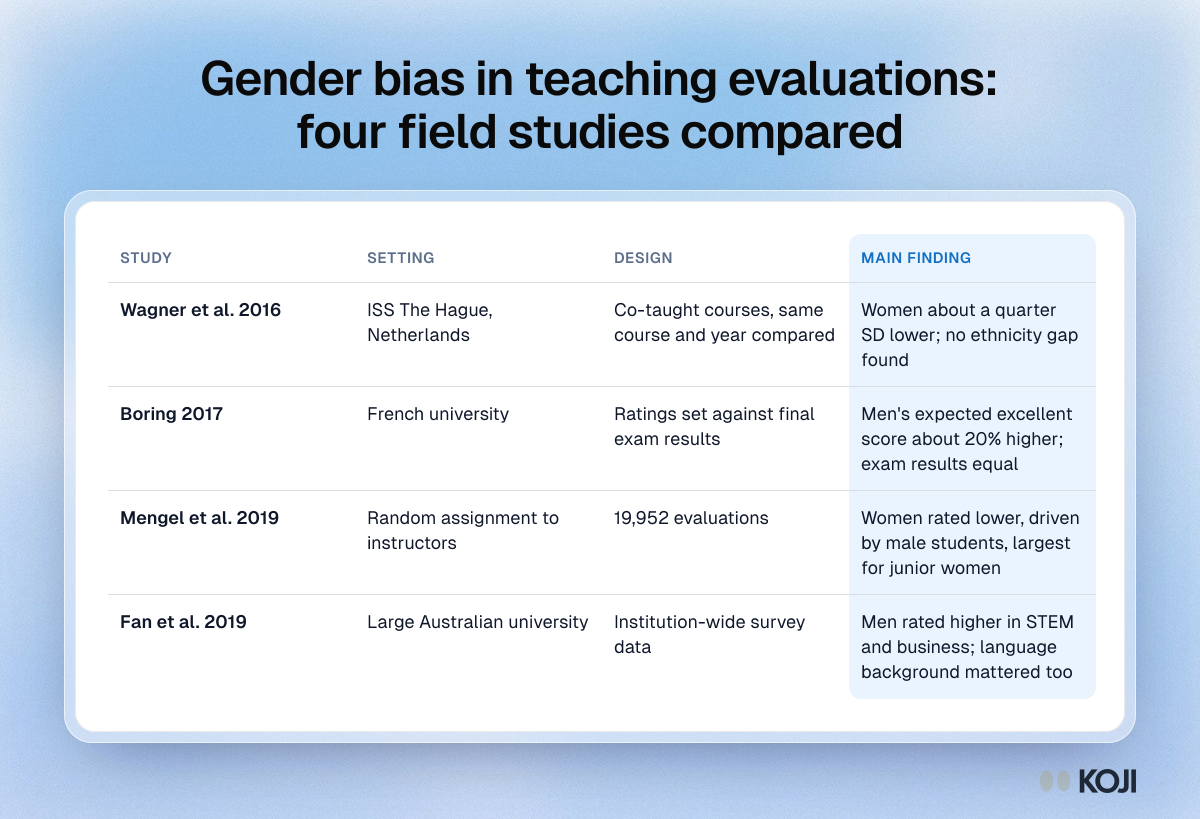
Table comparing four field studies of gender bias in student evaluations by setting, design and main finding: Wagner, Boring, Mengel and Fan.

Reference table

Gender bias in teaching evaluations: four field studies compared
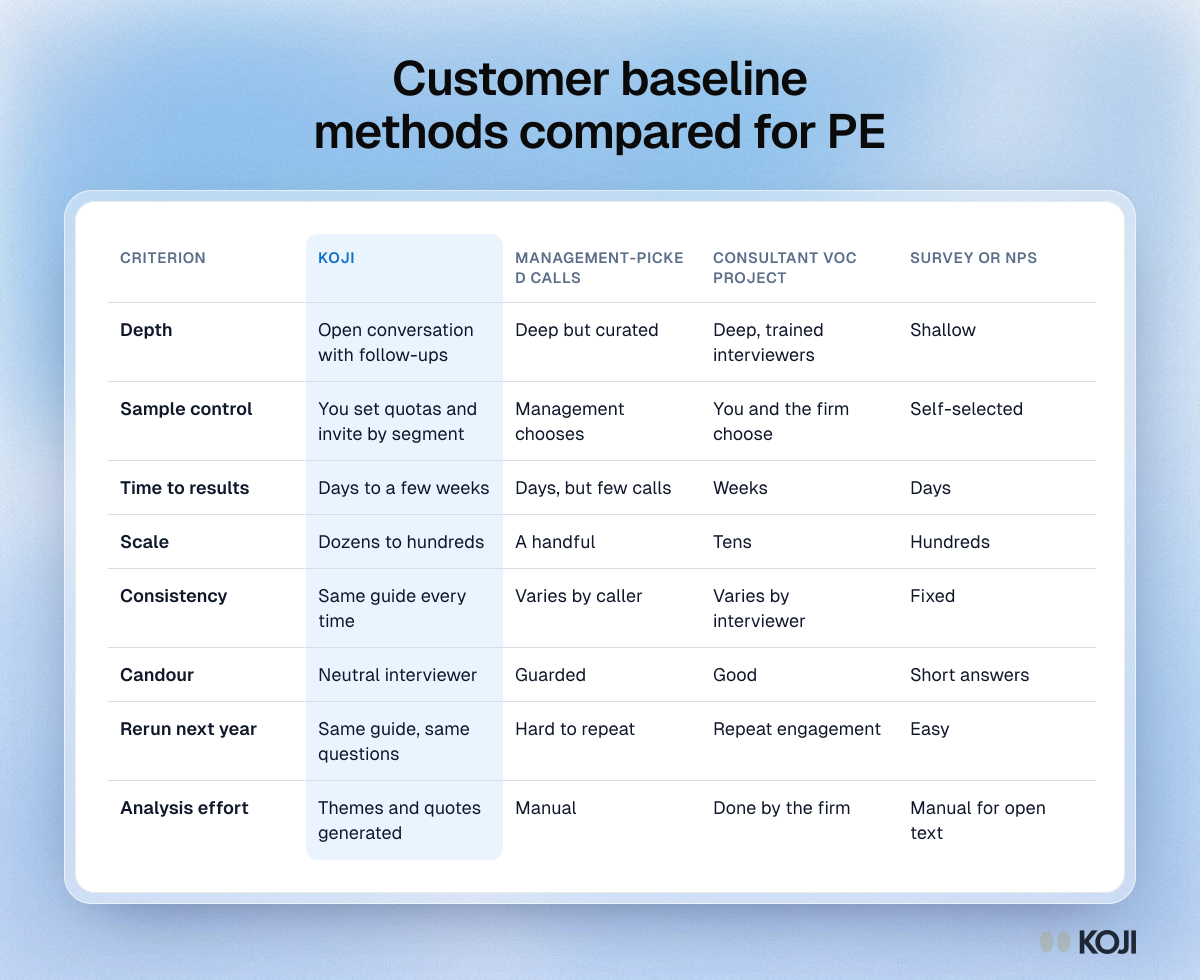
Table comparing Koji with management-picked calls, consultant voice of customer projects and surveys for a PE 100-day customer baseline.

Reference table

Customer baseline methods compared for PE
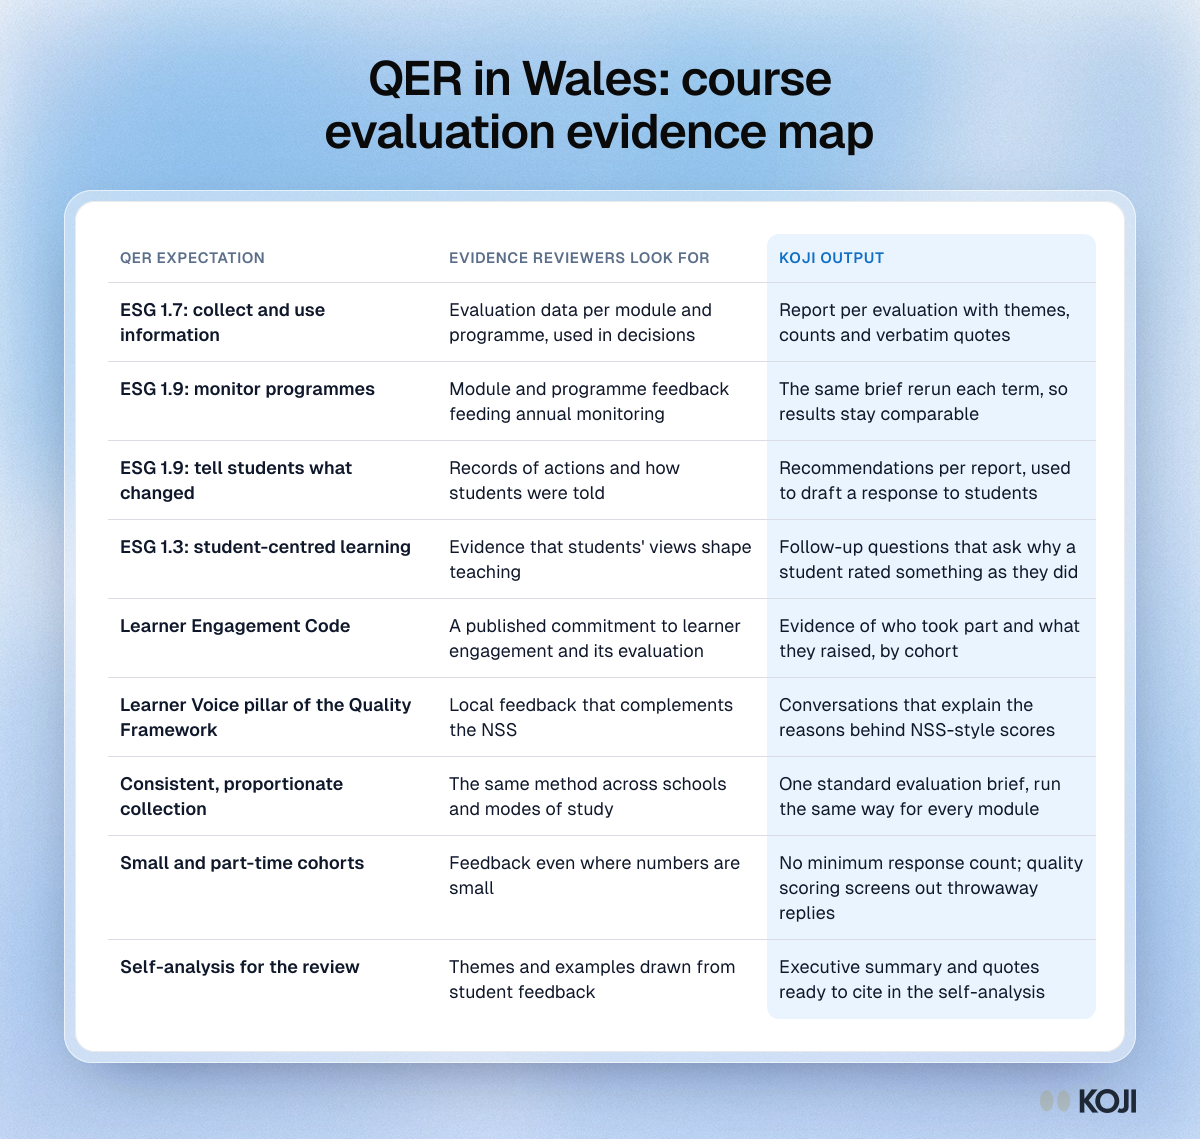
Table mapping Quality Enhancement Review expectations in Wales to evidence reviewers look for and the course evaluation output that supplies it.

Reference table

QER in Wales: course evaluation evidence map
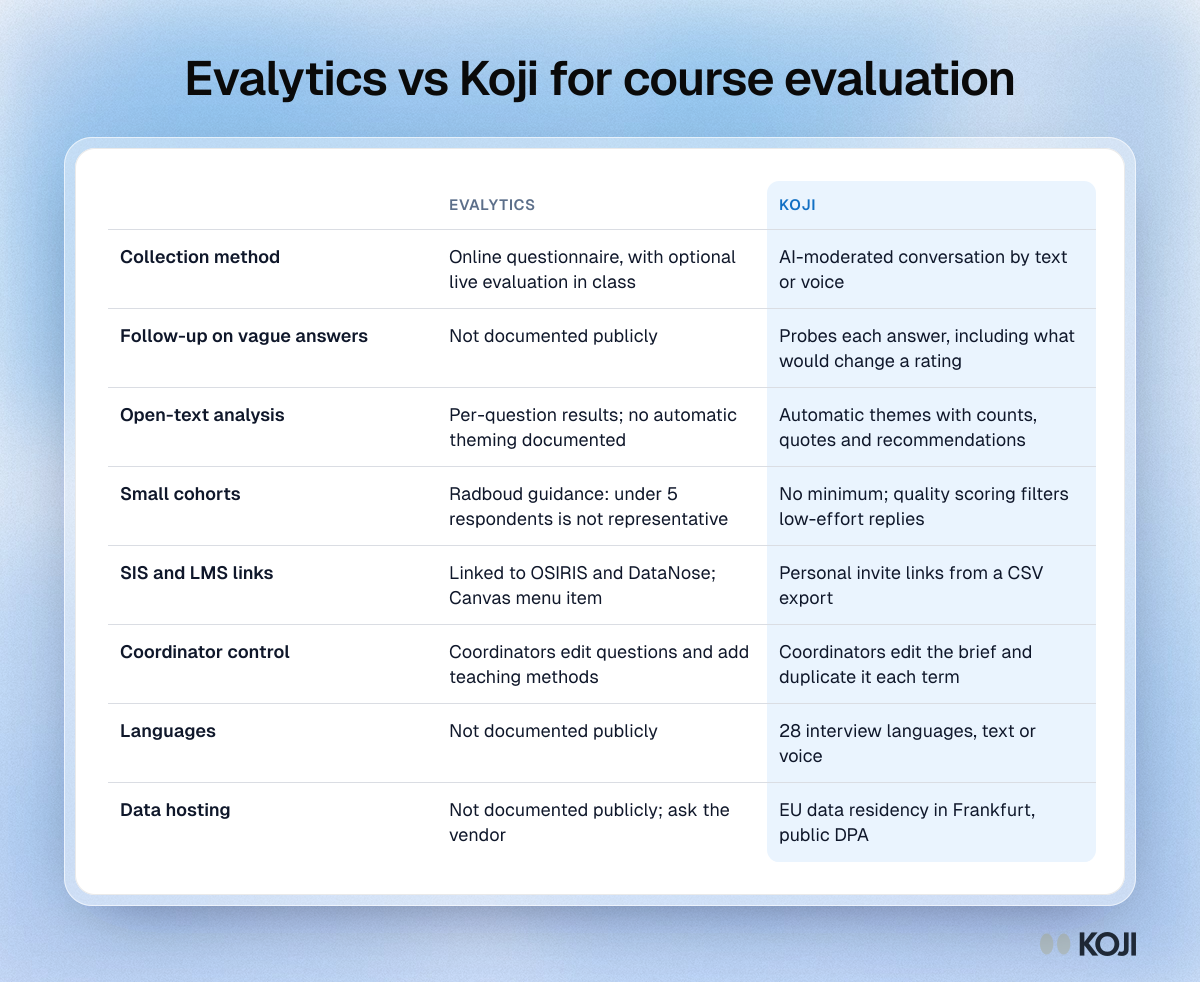
Table comparing Evalytics and Koji for course evaluation on collection method, follow-up, open-text analysis, small cohorts, system links and data hosting.

Reference table

Evalytics vs Koji for course evaluation
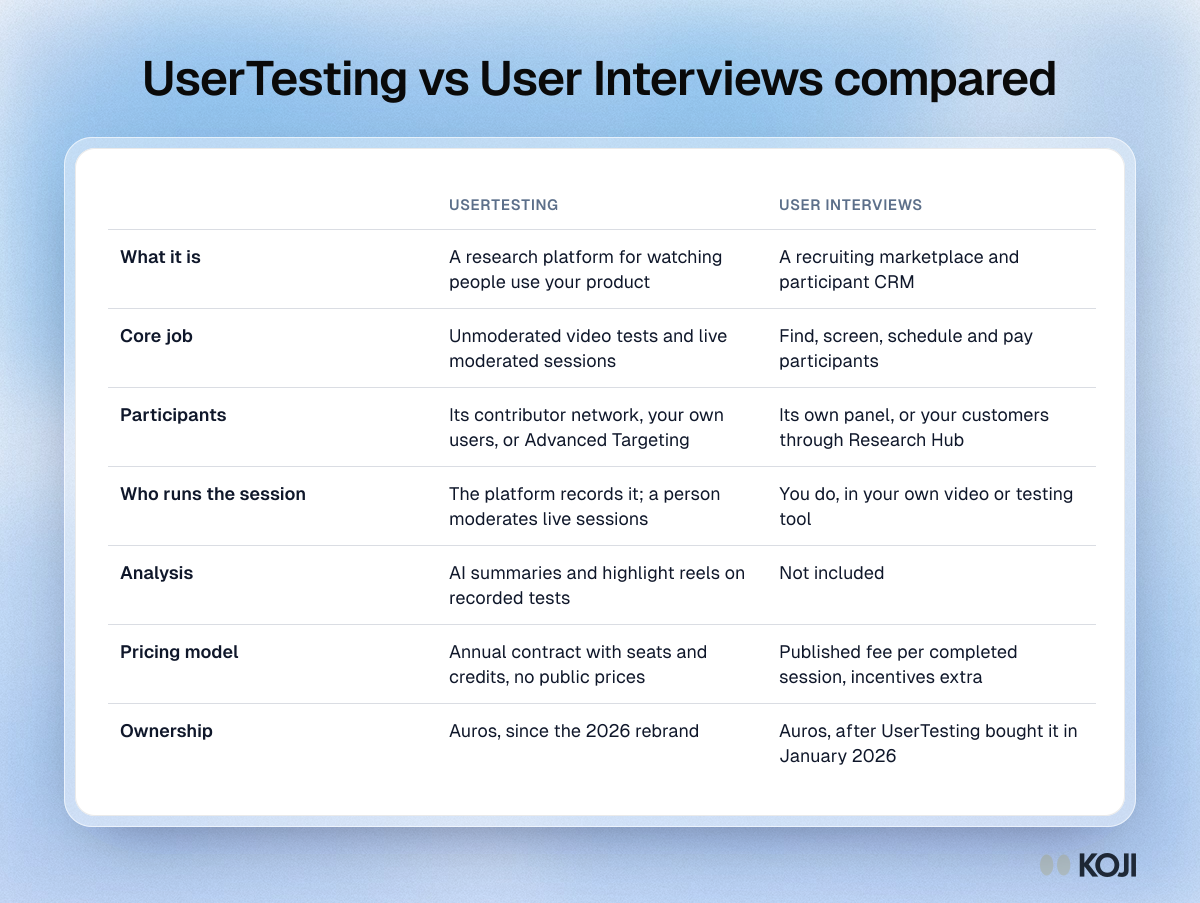
Table comparing UserTesting and User Interviews on what each is, participants, who runs sessions, analysis, pricing model and ownership.

Reference table

UserTesting vs User Interviews compared
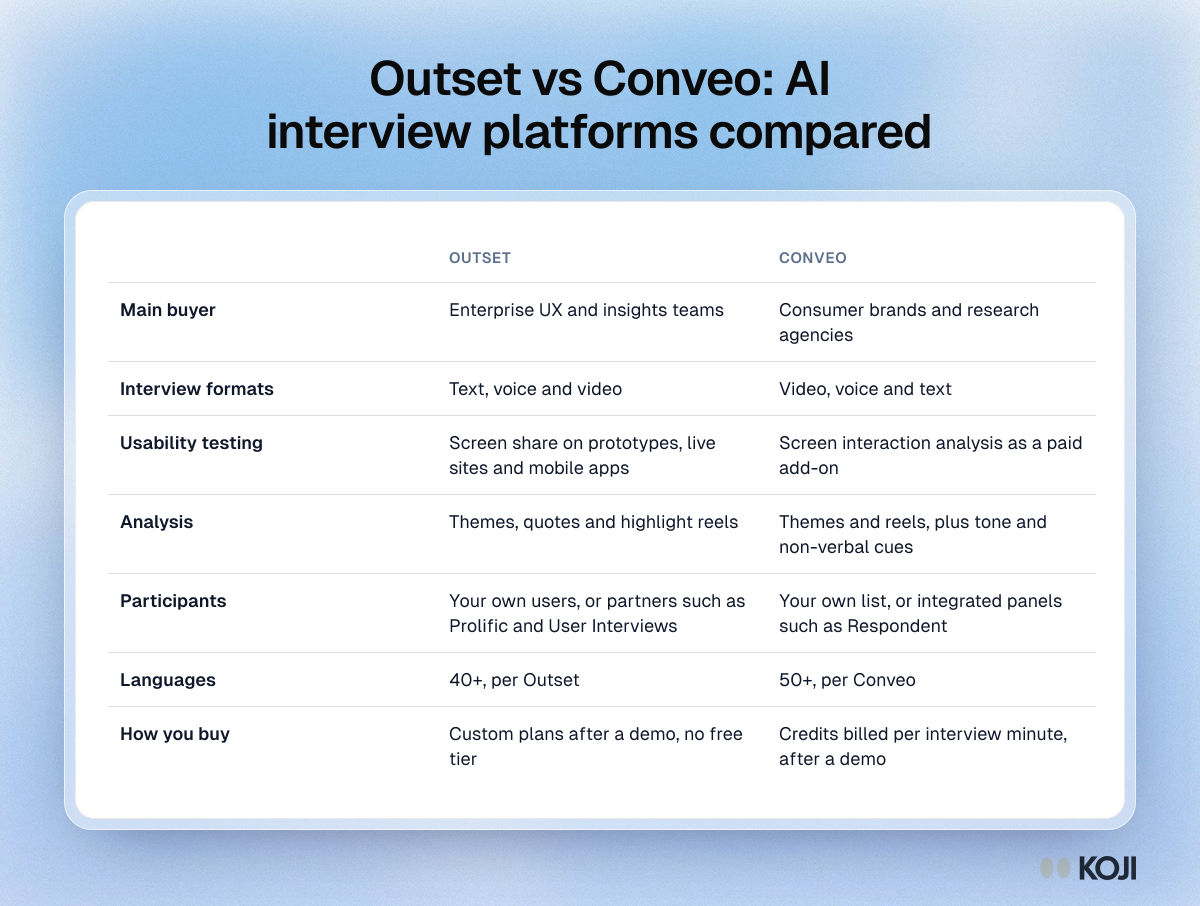
Table comparing Outset and Conveo on main buyer, interview formats, usability testing, analysis, participants, languages and how you buy.

Reference table

Outset vs Conveo: AI interview platforms compared
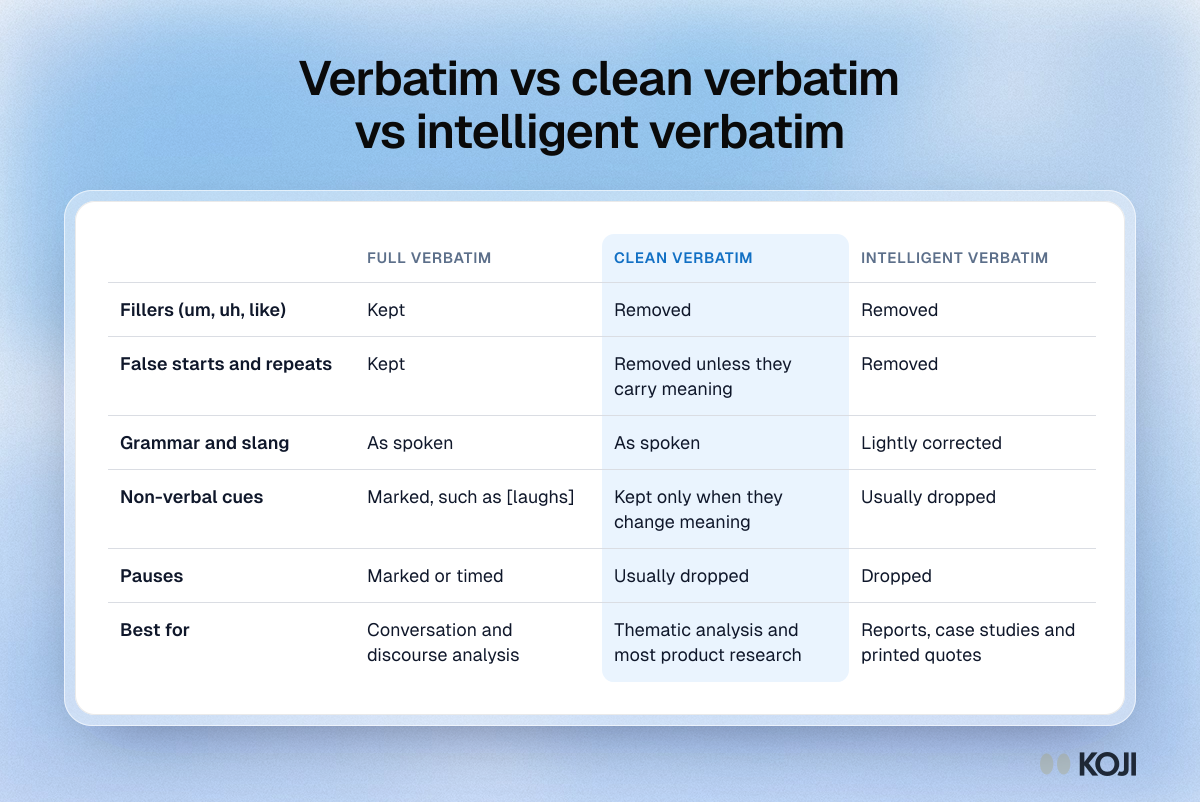
Table comparing full verbatim, clean verbatim and intelligent verbatim transcription: what each keeps, removes and is best used for

Reference table

Verbatim vs clean verbatim vs intelligent verbatim
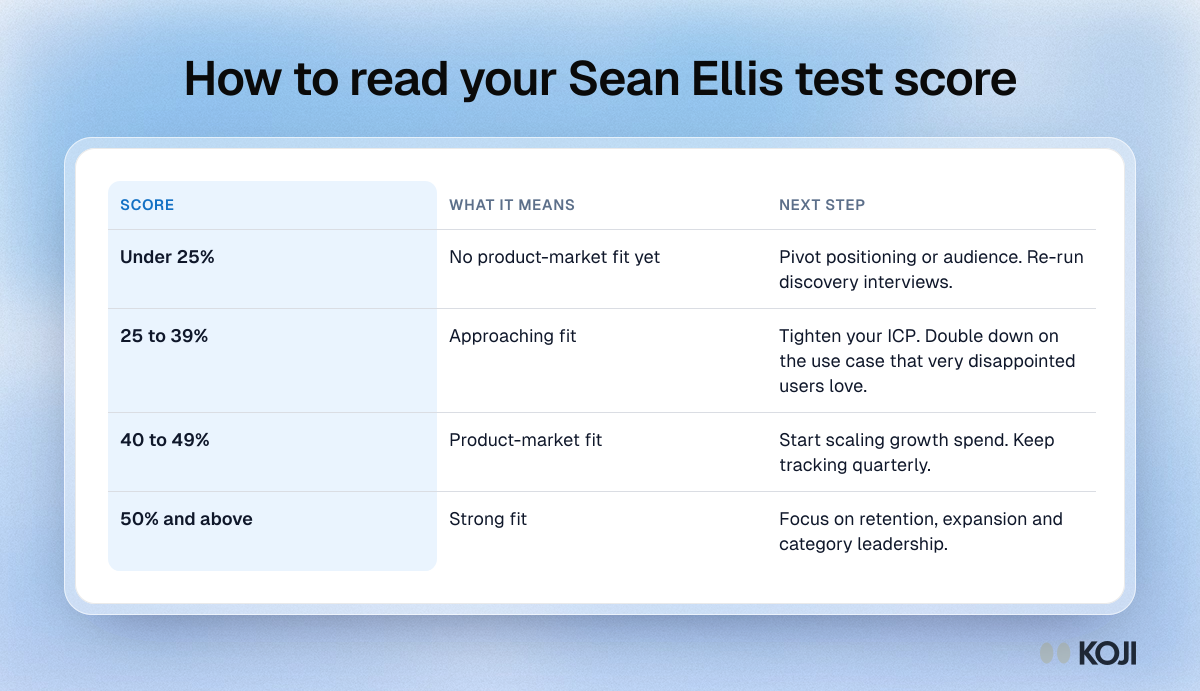
Table of Sean Ellis test score bands from under 25% to 50% and above, with what each means for product-market fit and the next step.

Reference table

How to read your Sean Ellis test score
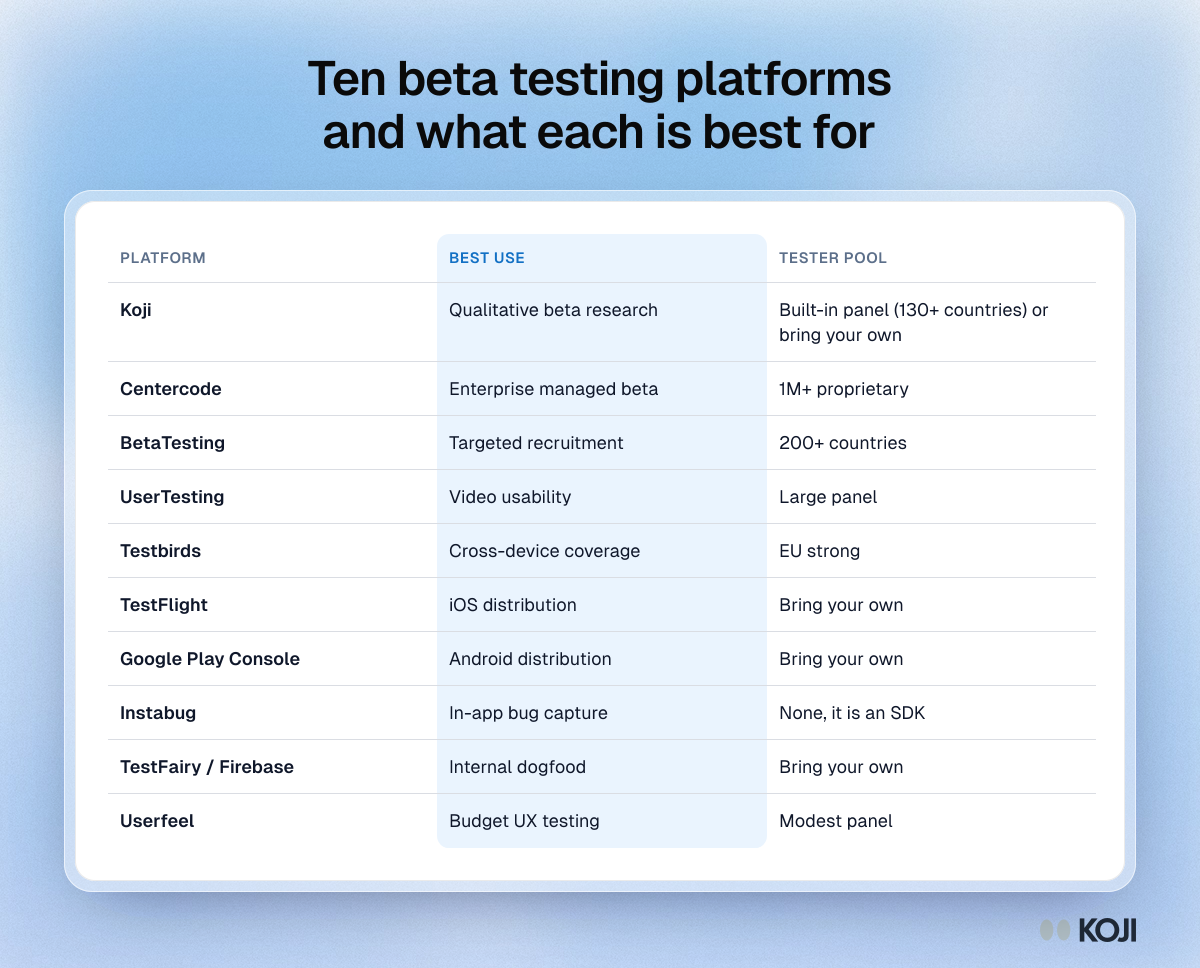
Table of ten beta testing platforms, from Centercode and BetaTesting to TestFlight and Instabug, with the best use and tester pool for each.

Reference table

Ten beta testing platforms and what each is best for
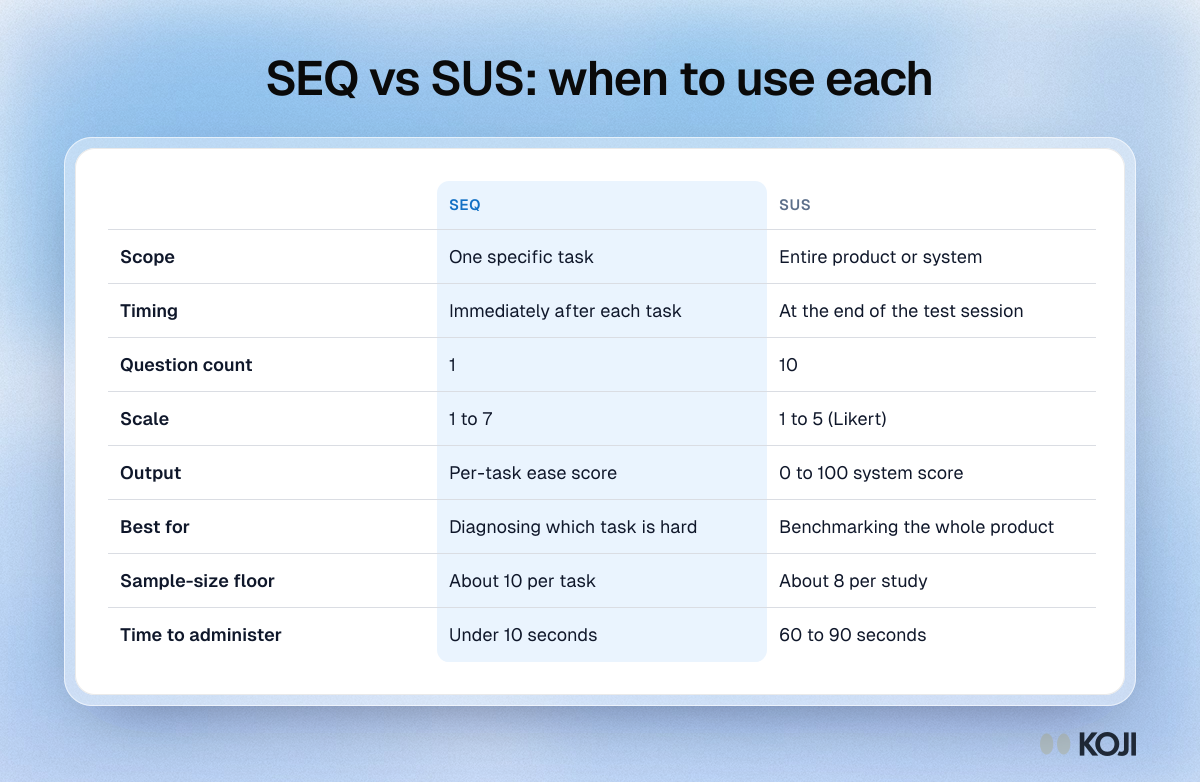
Table comparing the Single Ease Question and the System Usability Scale on scope, timing, question count, scale, output, sample size and time to administer.

Reference table

SEQ vs SUS: when to use each
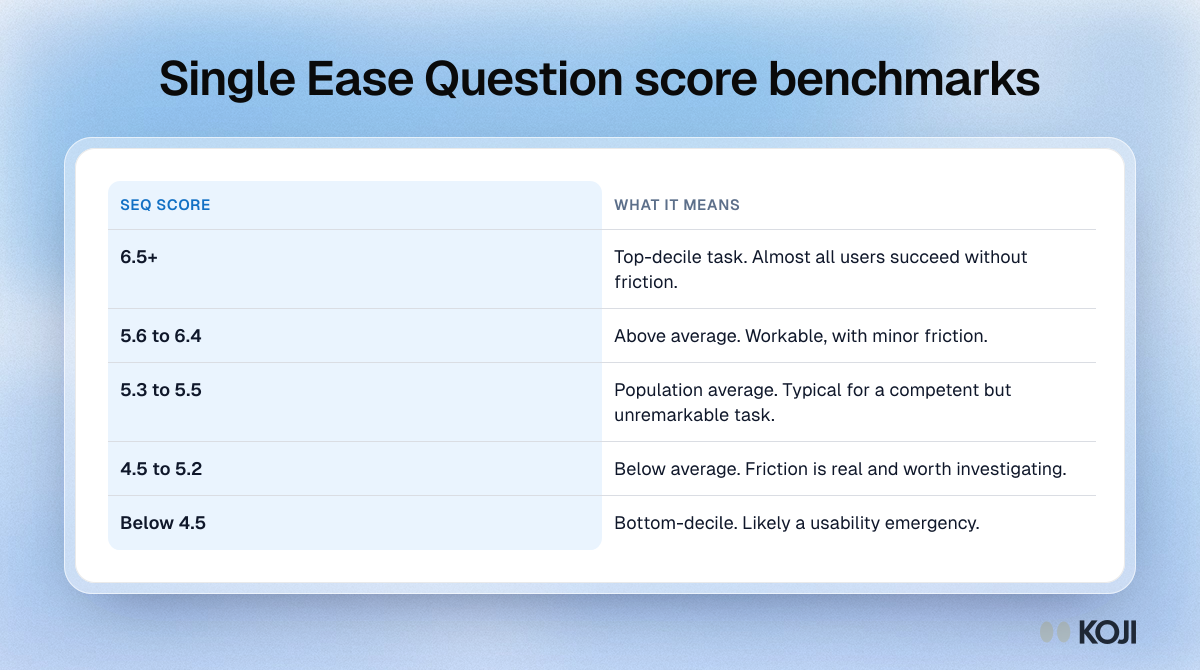
Table of Single Ease Question score ranges from 6.5 and above to below 4.5, with what each range means for a task, based on MeasuringU benchmarks.

Reference table

Single Ease Question score benchmarks
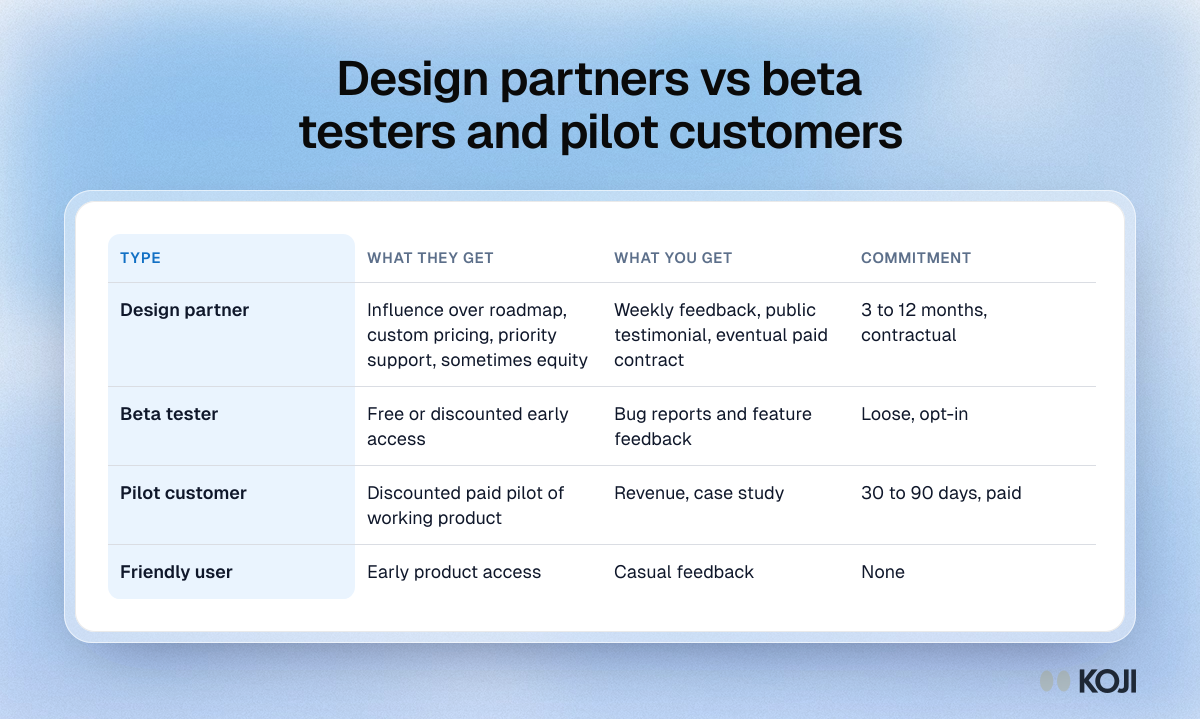
Table comparing design partners, beta testers, pilot customers and friendly users by what they get, what you get and how long they commit.

Reference table

Design partners vs beta testers and pilot customers
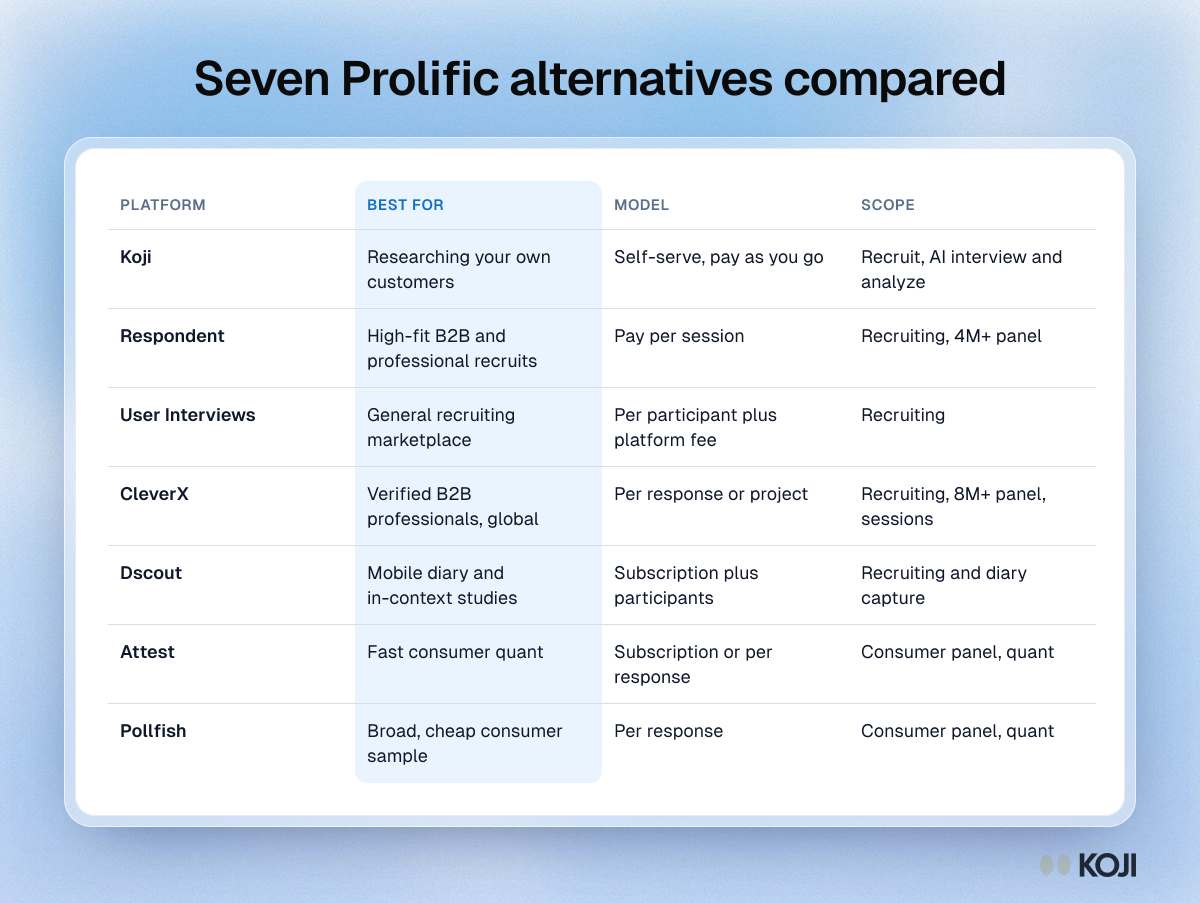
Table comparing seven Prolific alternatives by best use, pricing model and scope, including Respondent, User Interviews, CleverX, Dscout, Attest and Pollfish.

Reference table

Seven Prolific alternatives compared
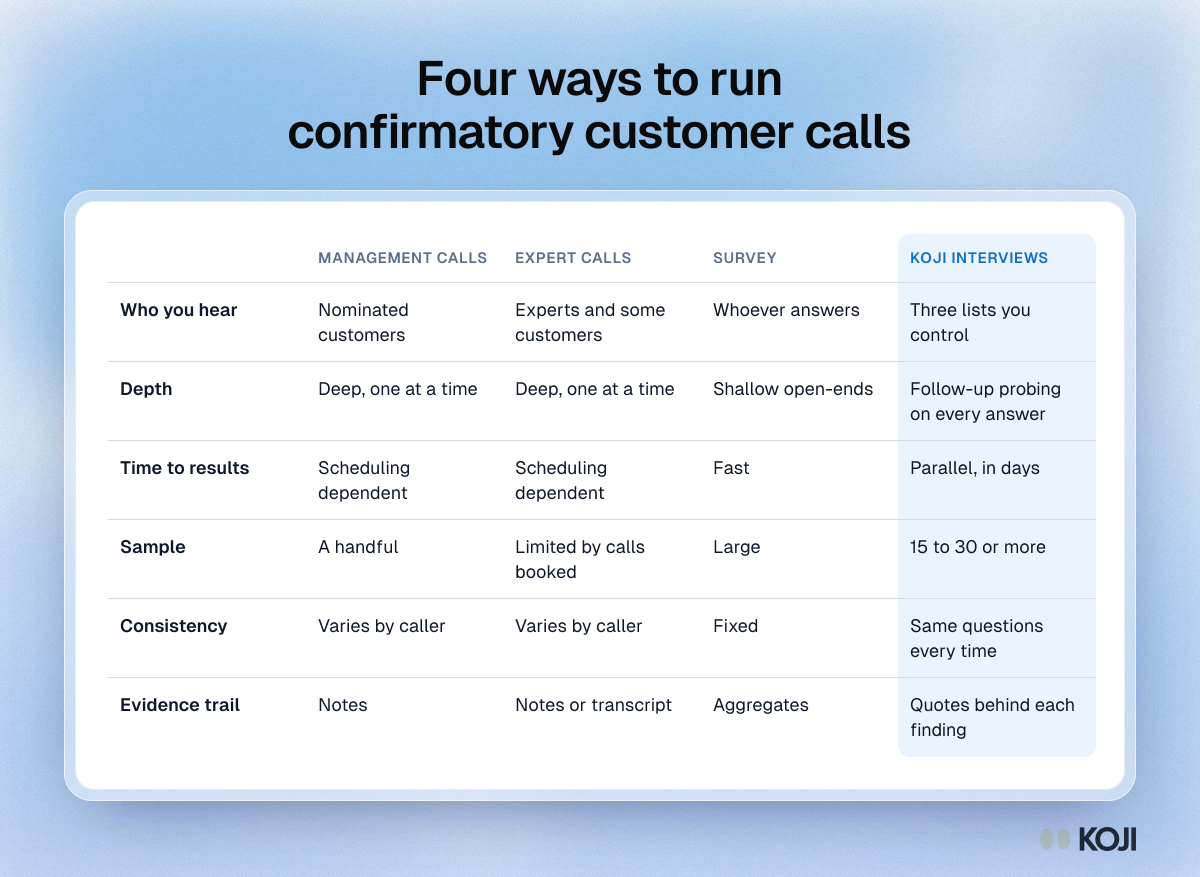
Table comparing management reference calls, expert calls, surveys and Koji AI interviews on who you hear, depth, speed, sample and evidence.

Reference table

Four ways to run confirmatory customer calls
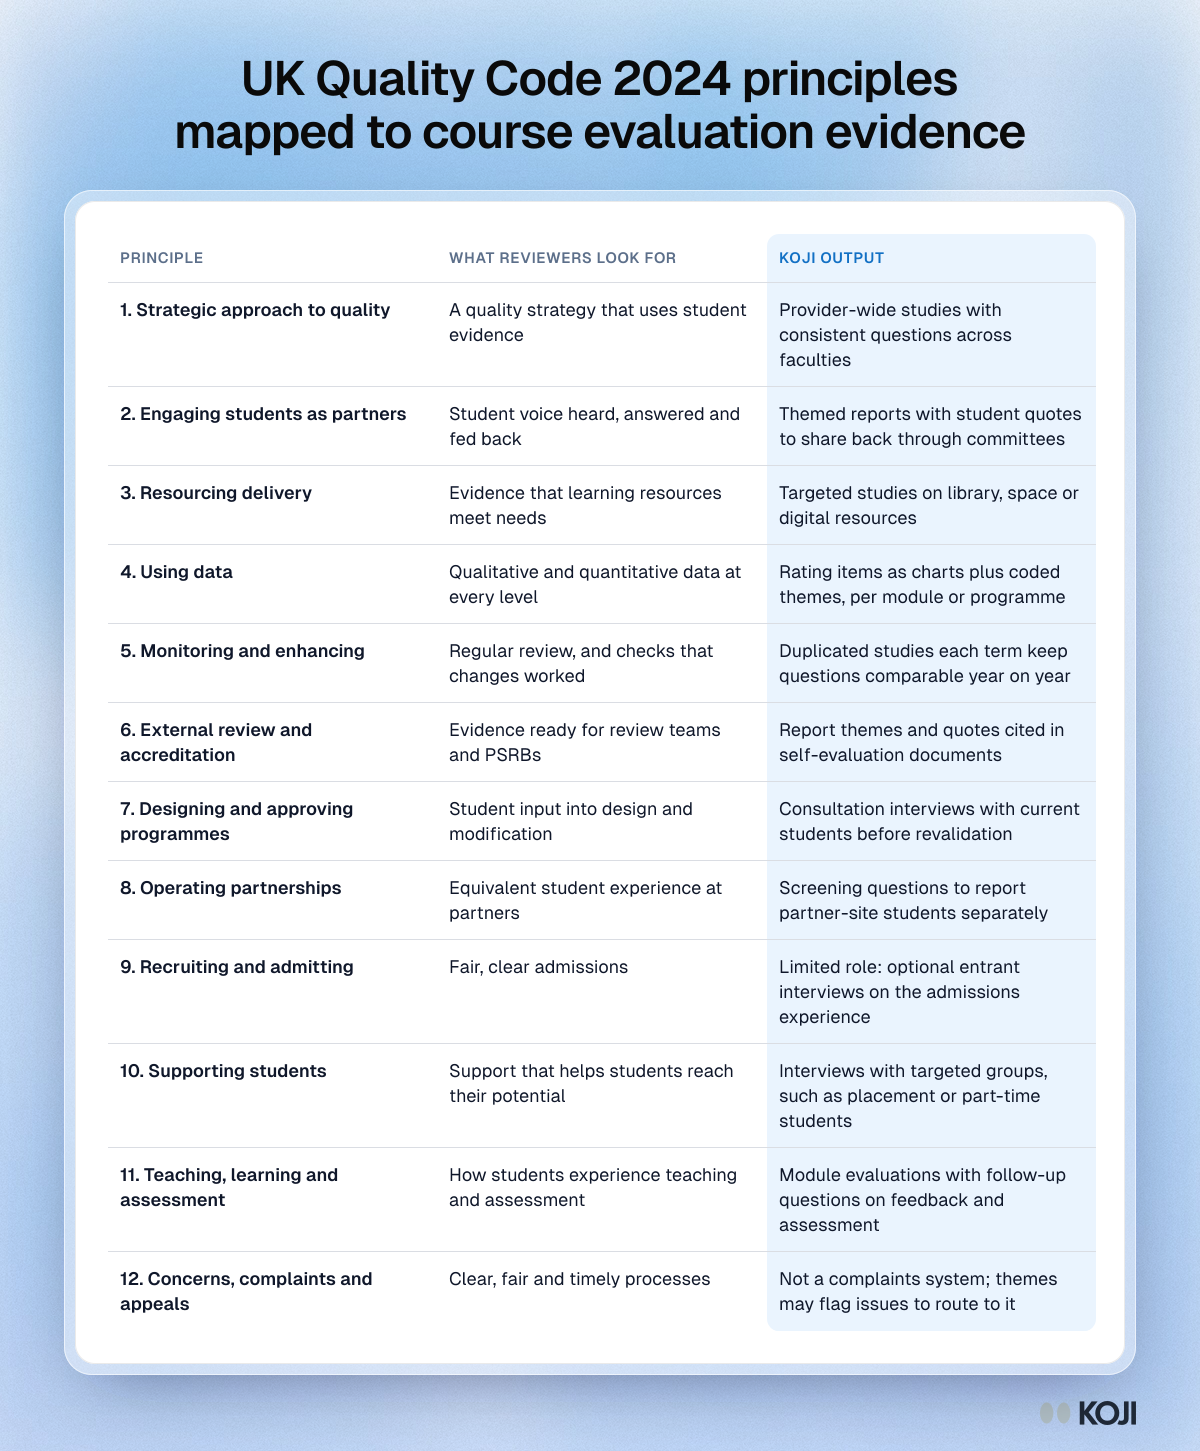
Table mapping all twelve UK Quality Code 2024 Sector-Agreed Principles to the evaluation evidence reviewers look for and the matching Koji output

Reference table

UK Quality Code 2024 principles mapped to course evaluation evidence
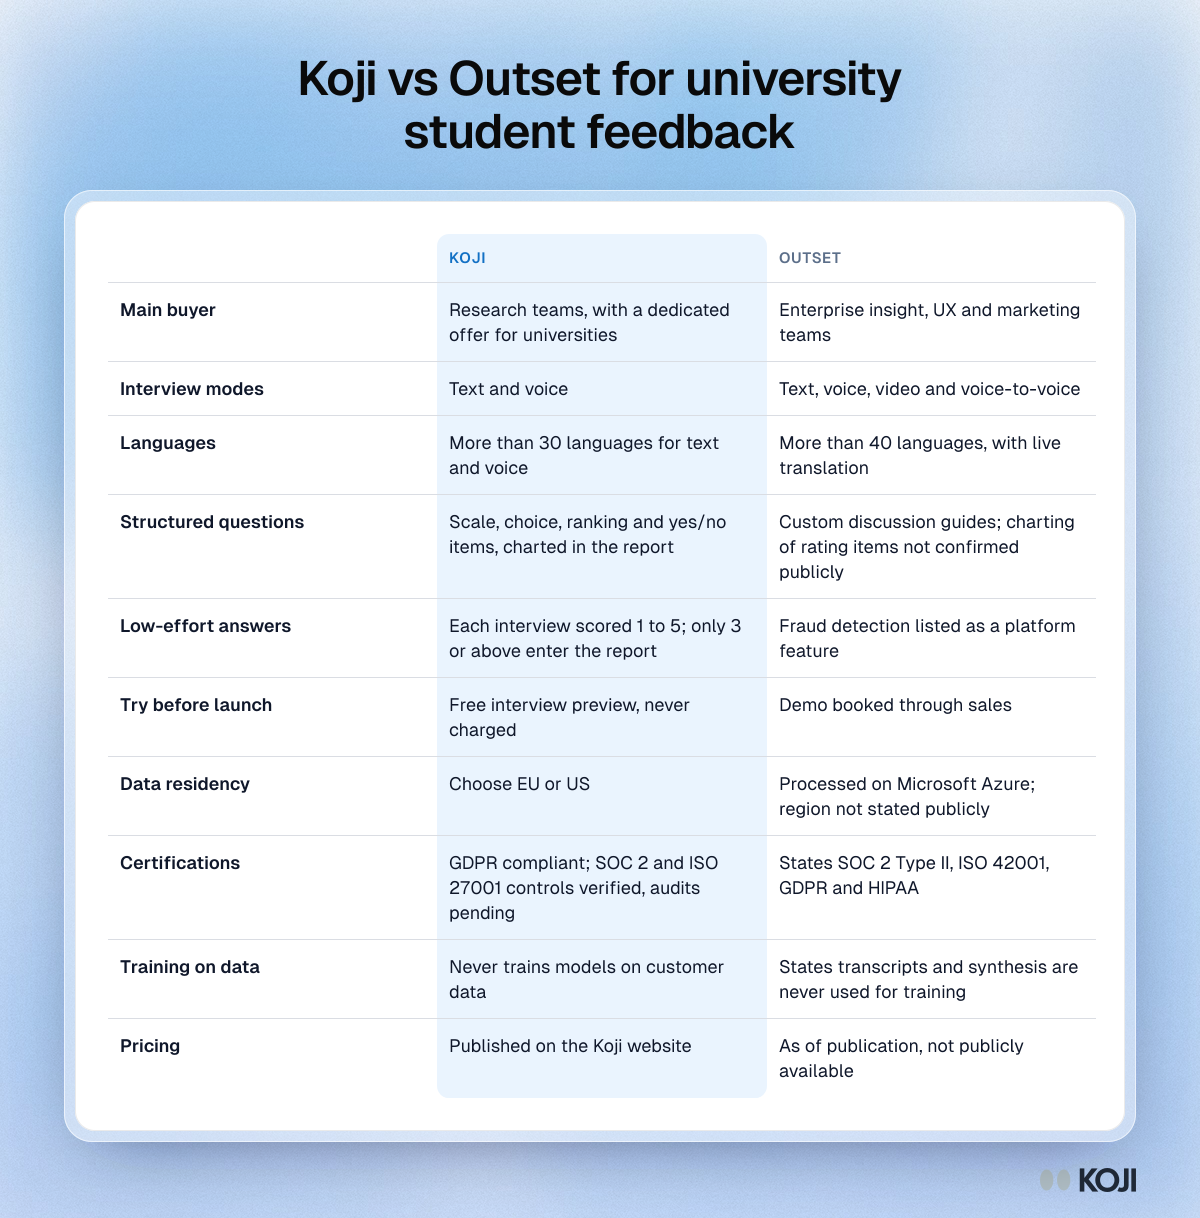
Table comparing Koji and Outset on buyer, interview modes, languages, quality filtering, data residency and pricing for university student feedback

Reference table

Koji vs Outset for university student feedback
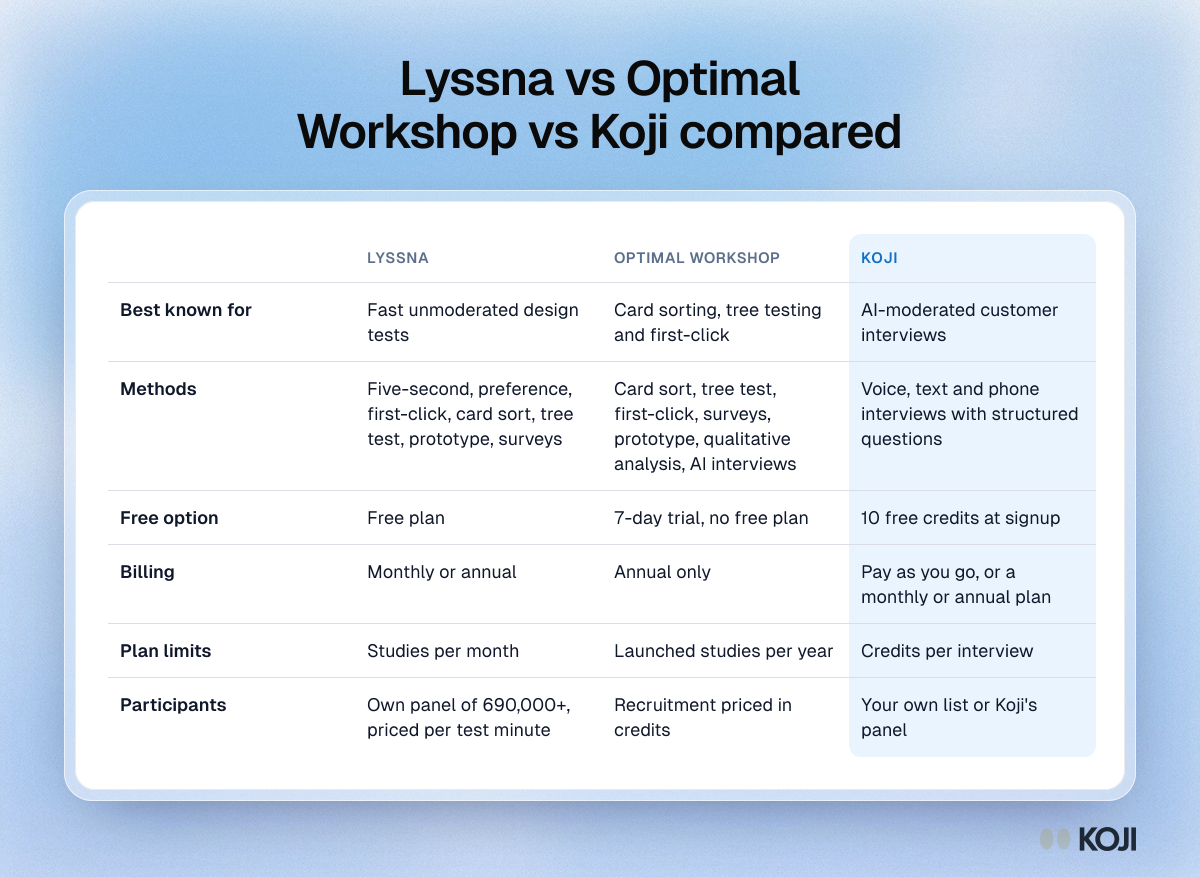
Table comparing Lyssna, Optimal Workshop and Koji on what each is best at, methods, free option, billing, limits and participants

Reference table

Lyssna vs Optimal Workshop vs Koji compared
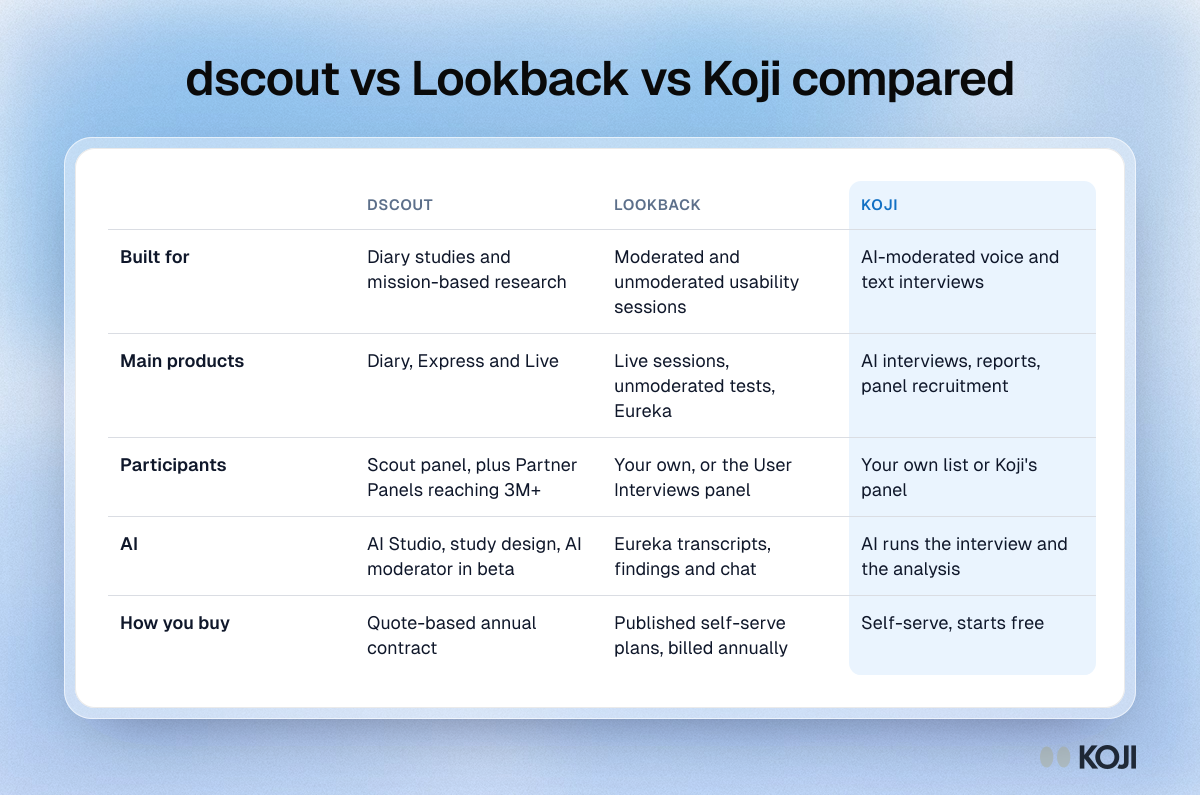
Table comparing dscout, Lookback and Koji on what each is built for, main products, participants, AI features and how you buy

Reference table

dscout vs Lookback vs Koji compared
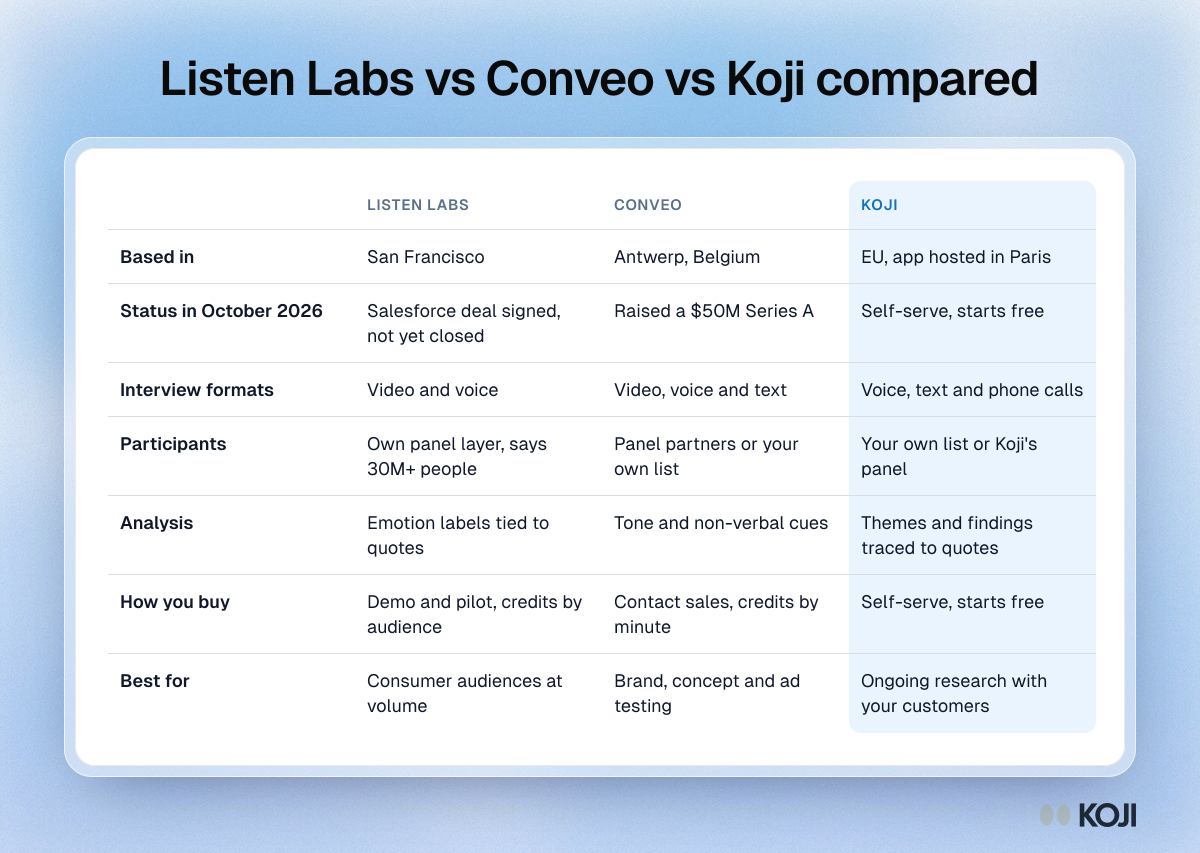
Table comparing Listen Labs, Conveo and Koji on where they are based, status, interview formats, participants, analysis and how you buy

Reference table

Listen Labs vs Conveo vs Koji compared
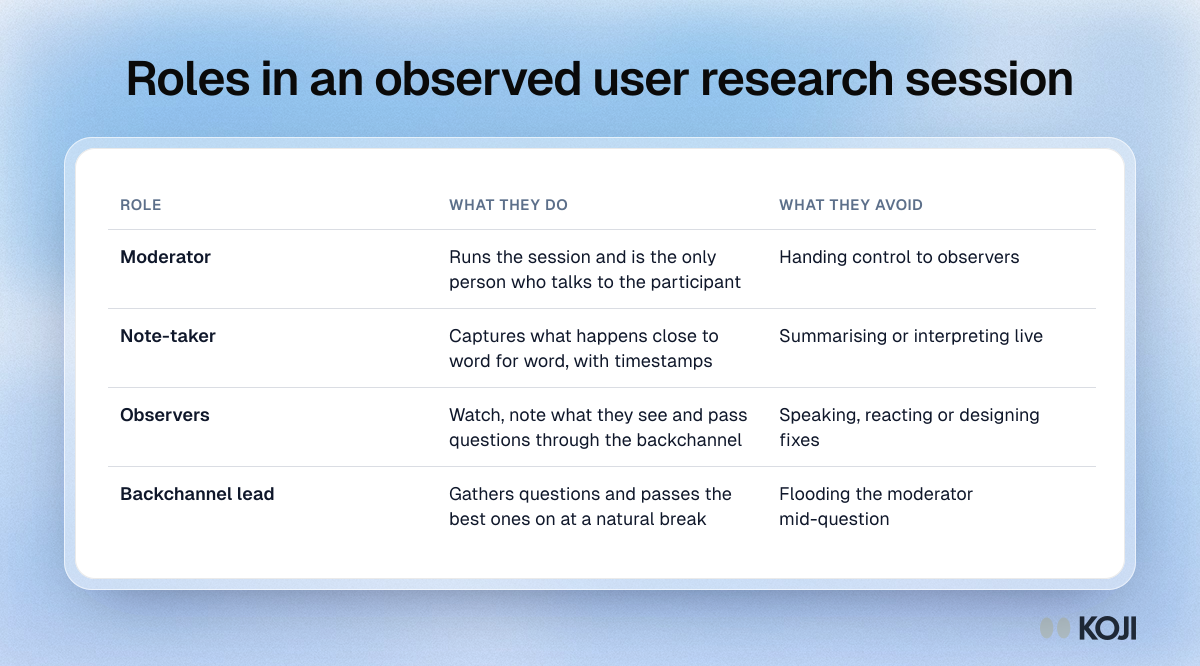
Table of the four roles in an observed research session: moderator, note-taker, observers and backchannel lead, with what each does and avoids.

Reference table

Roles in an observed user research session
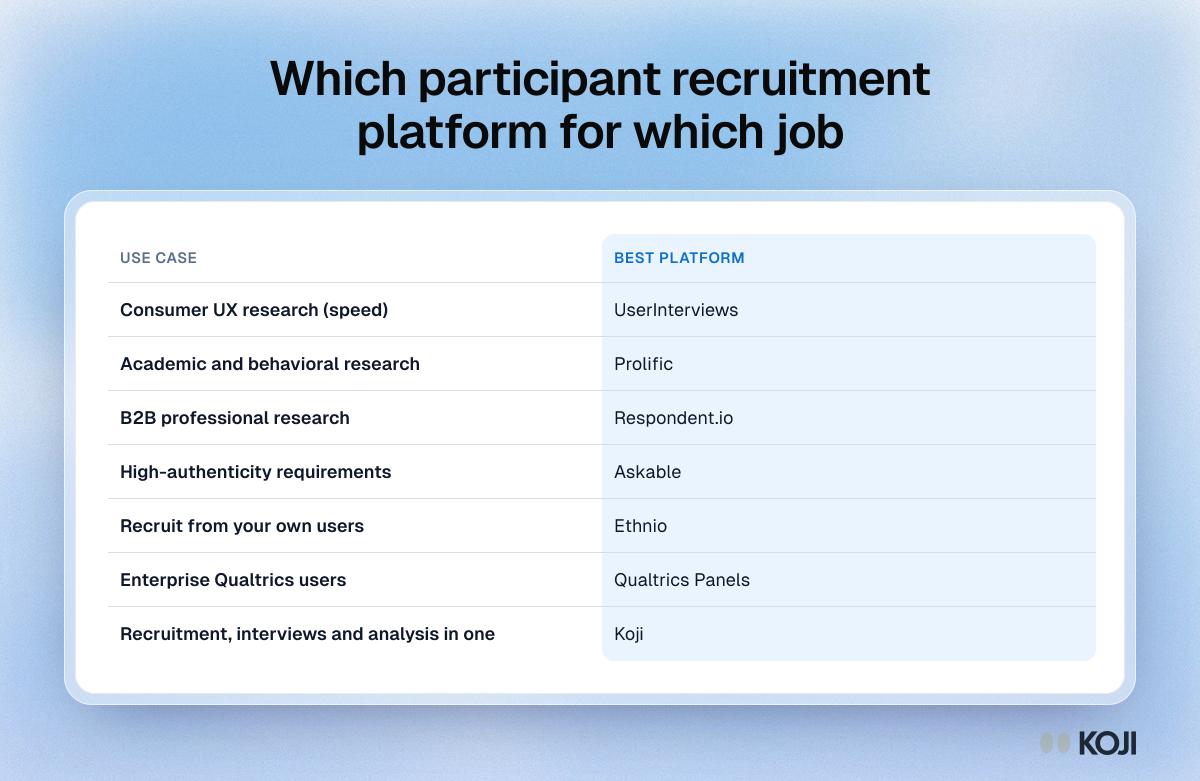
Table matching seven research use cases to a recruitment platform, from consumer UX speed and B2B professionals to recruiting your own users.

Reference table

Which participant recruitment platform for which job
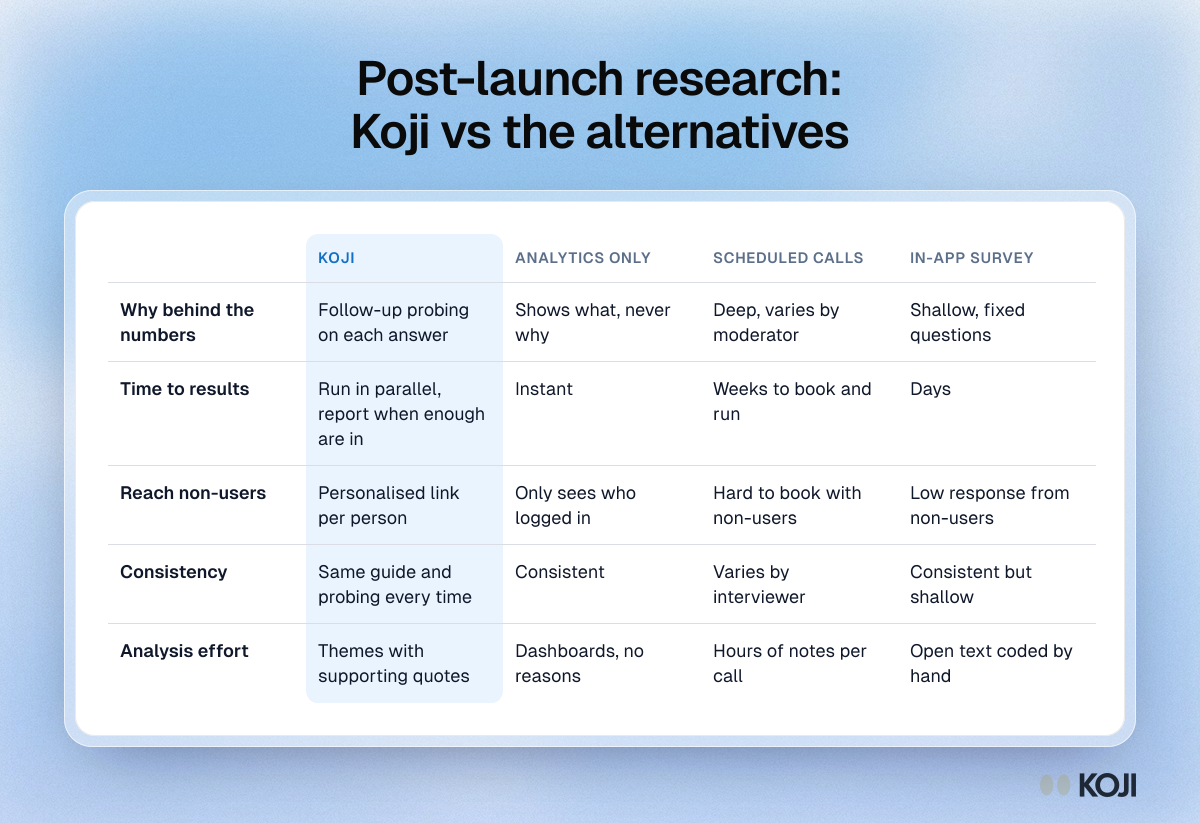
Table comparing Koji, analytics only, scheduled calls and in-app surveys for post-launch research on depth, speed, reach, consistency and analysis effort.

Reference table

Post-launch research: Koji vs the alternatives
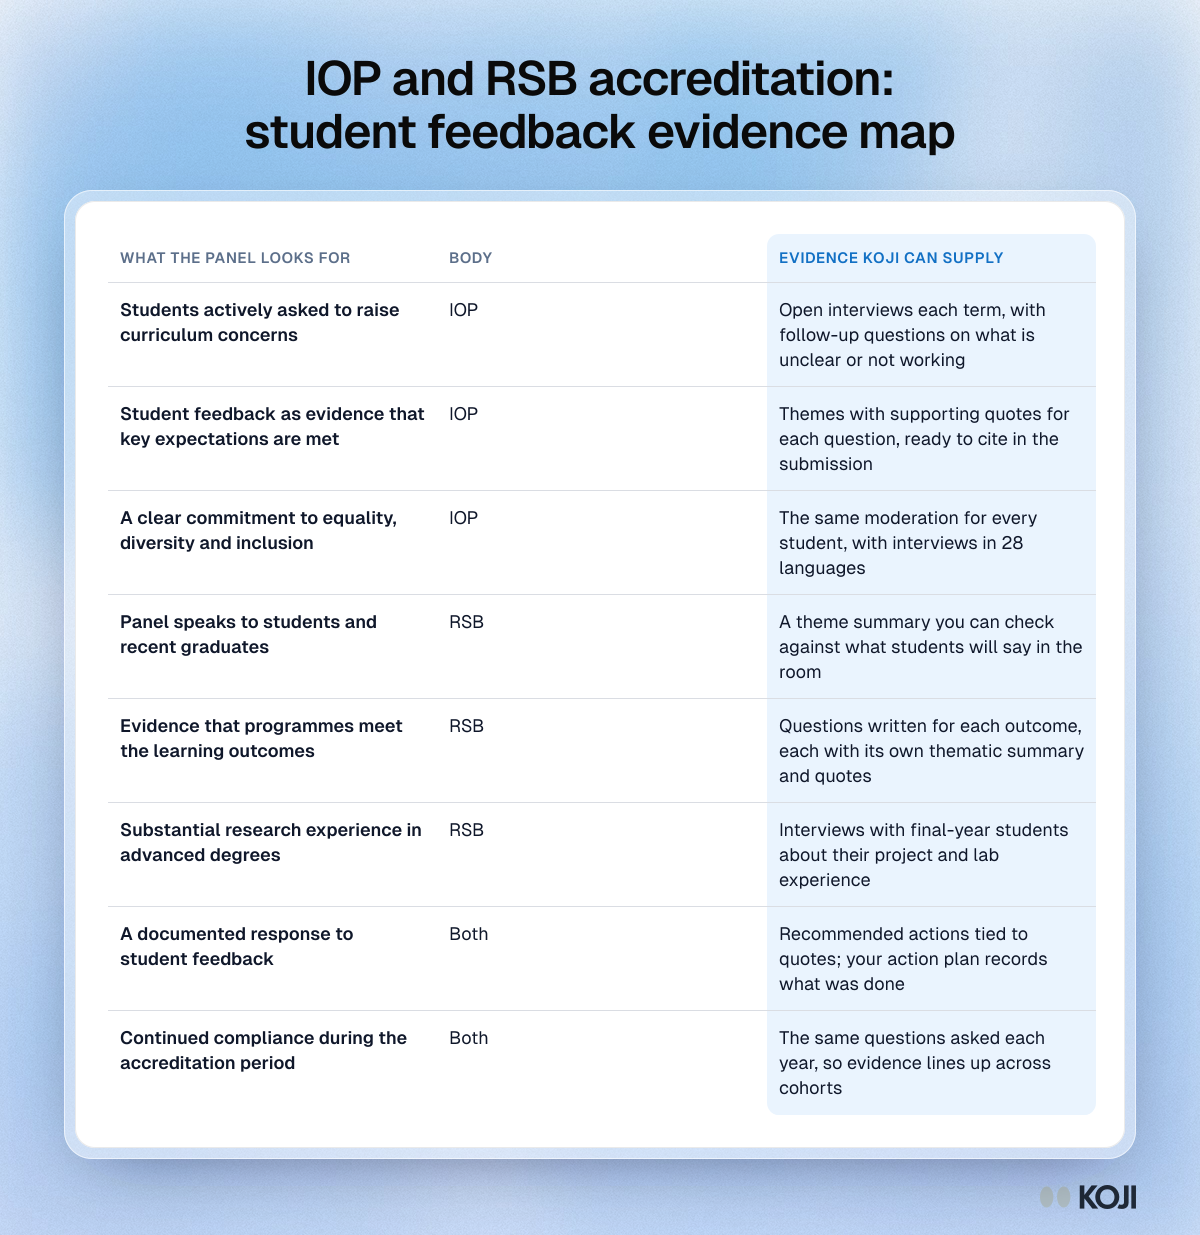
Table mapping IOP and Royal Society of Biology accreditation expectations to course evaluation evidence, from curriculum concerns to research experience.

Reference table

IOP and RSB accreditation: student feedback evidence map
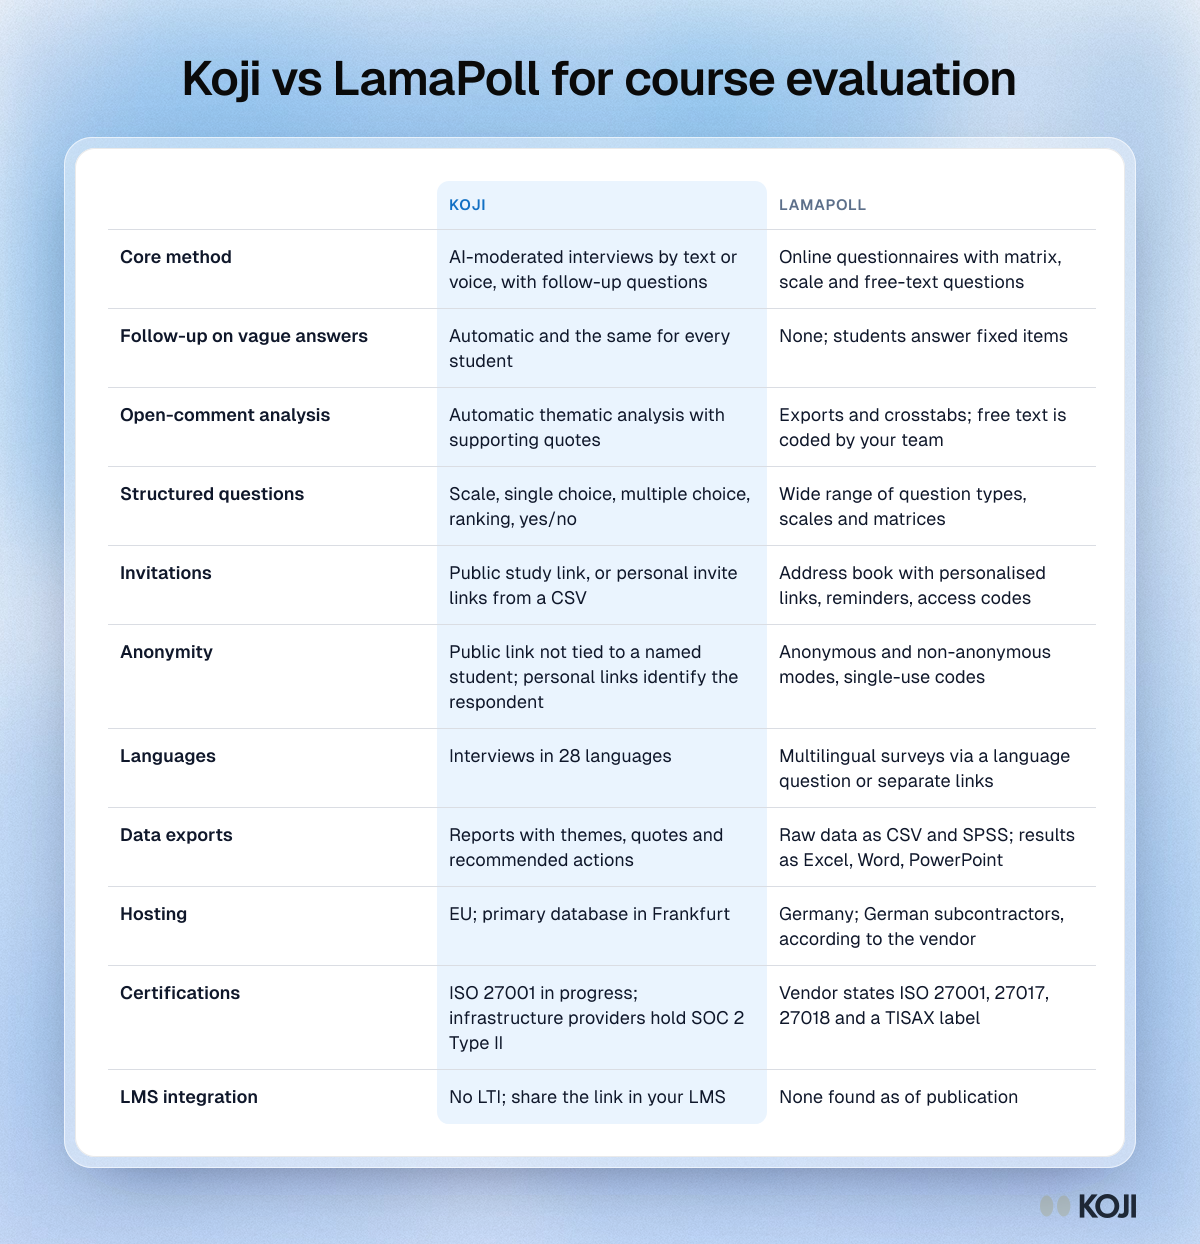
Table comparing Koji and LamaPoll for course evaluation on method, follow-up questions, comment analysis, invitations, anonymity, hosting and certifications.

Reference table

Koji vs LamaPoll for course evaluation
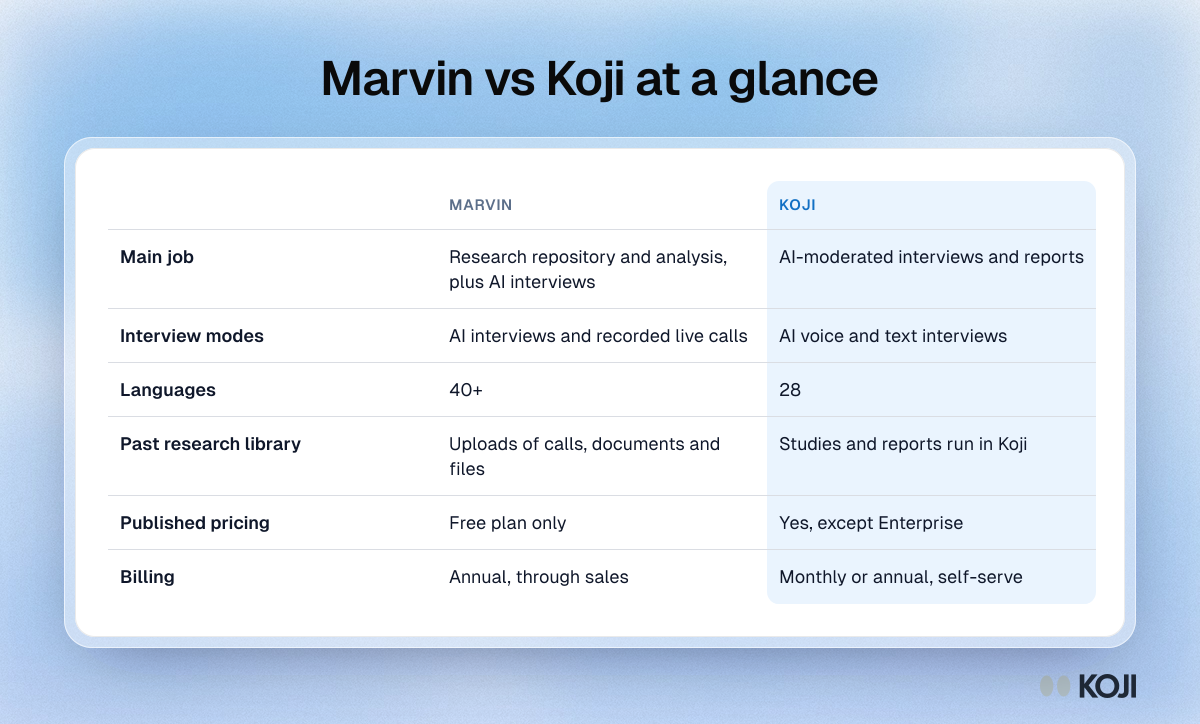
Table comparing Marvin and Koji on main job, interview modes, languages, research library, published pricing and billing

Reference table

Marvin vs Koji at a glance
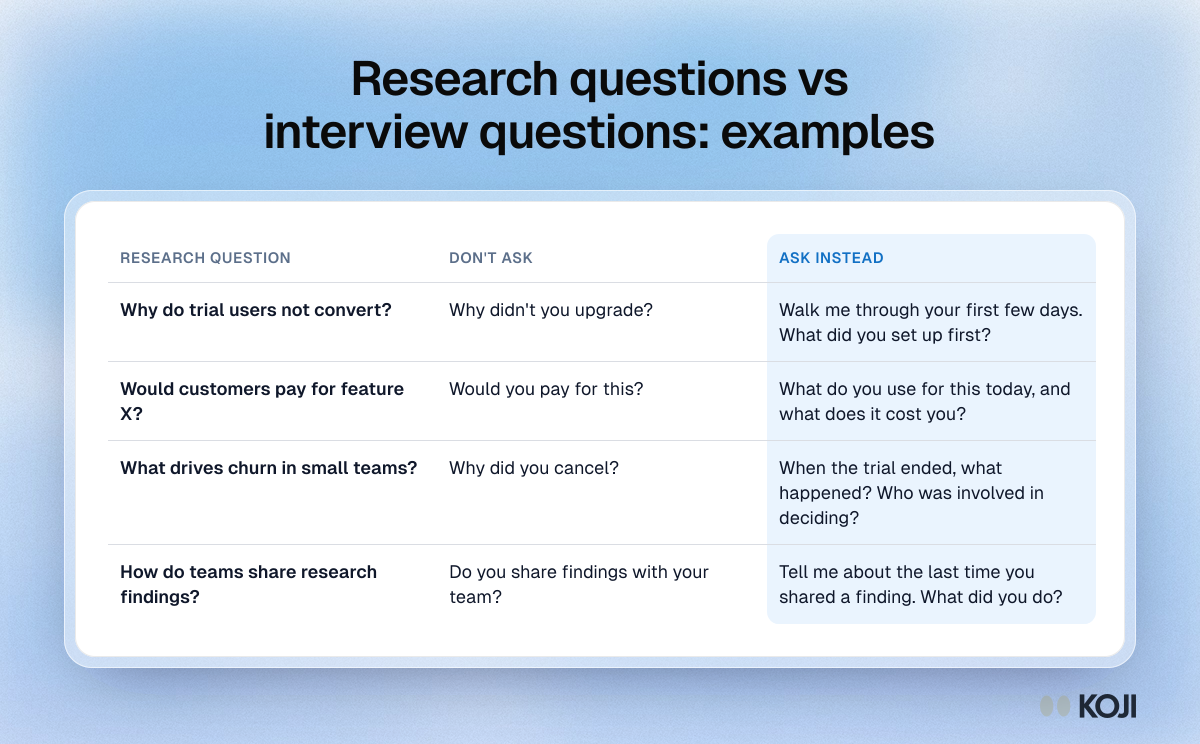
Table of example research questions next to the direct question to avoid and the interview questions to ask instead.

Reference table

Research questions vs interview questions: examples
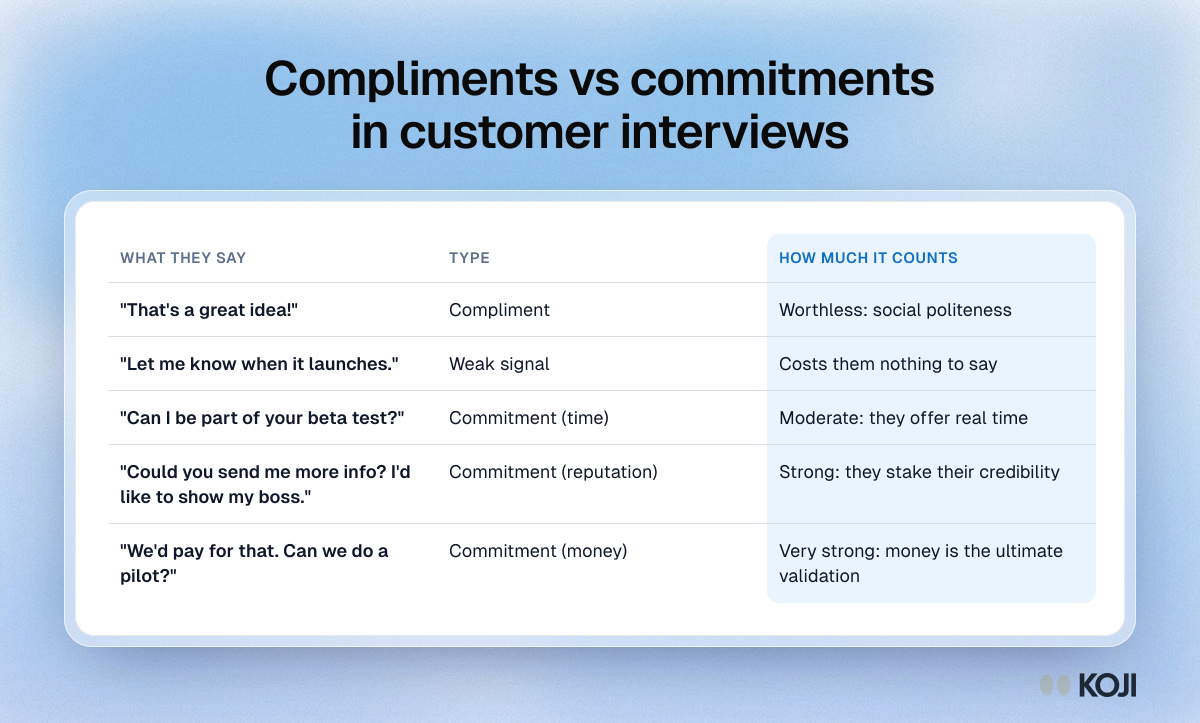
Table ranking customer responses from compliment to commitment of time, reputation and money, with how much each signal counts as validation of an idea.

Reference table

Compliments vs commitments in customer interviews
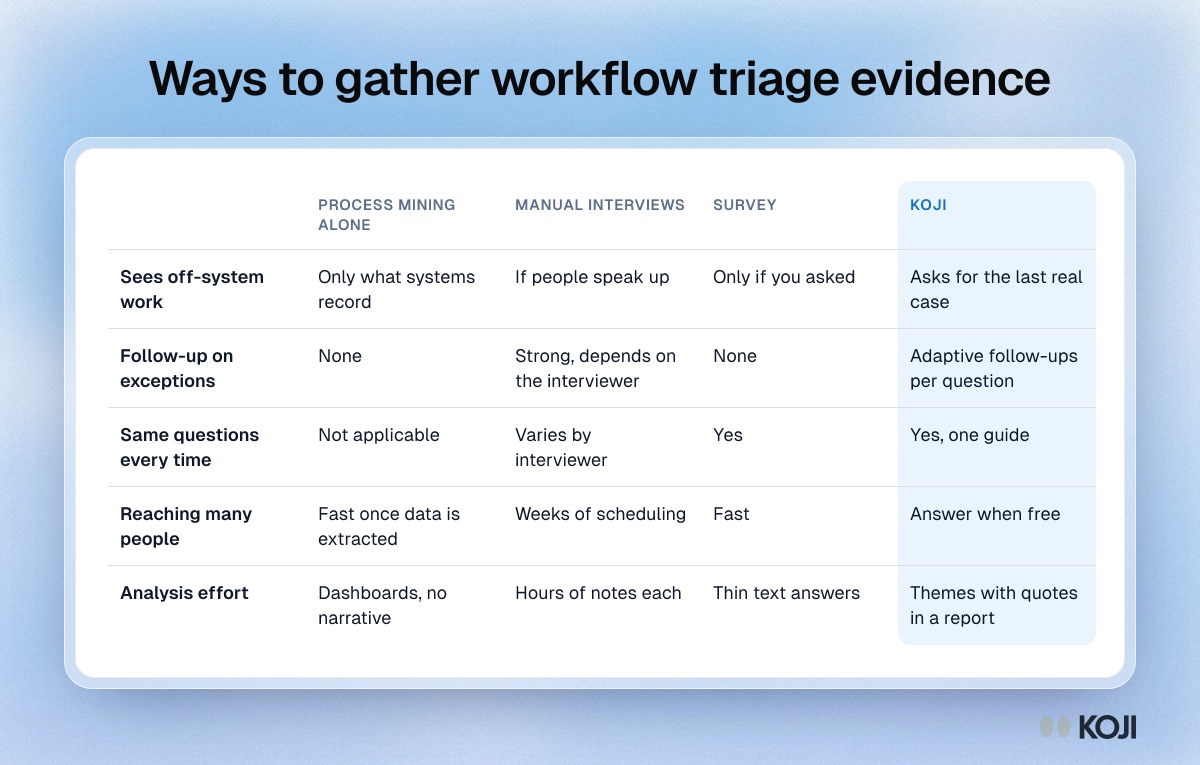
Table comparing process mining, workshops and manual interviews, surveys and Koji on off-system work, follow-up, consistency, reach and analysis effort.

Reference table

Ways to gather workflow triage evidence
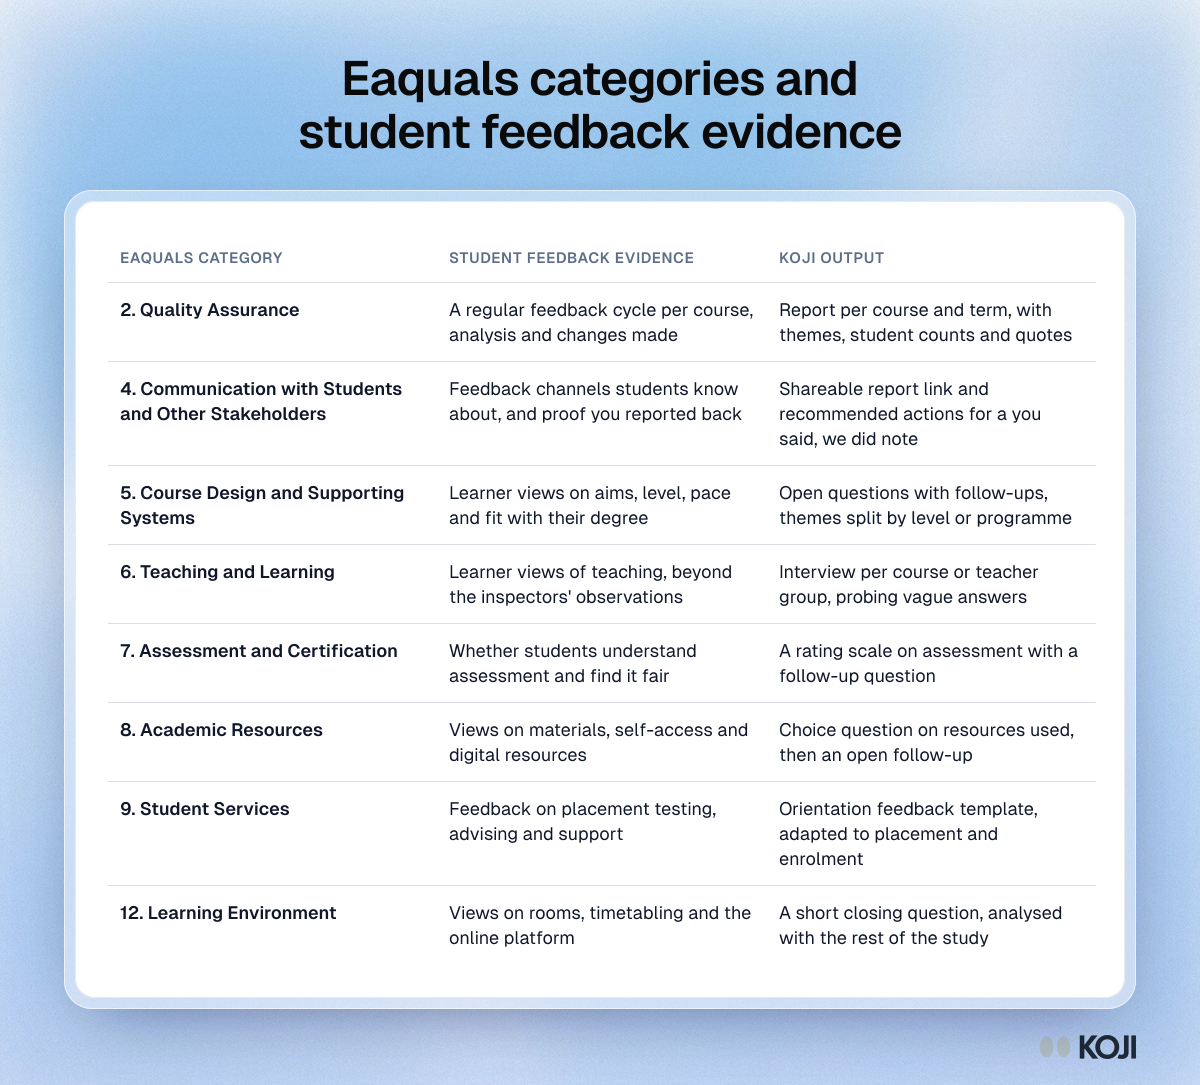
Table mapping eight Eaquals inspection categories to the student feedback evidence a university language centre can prepare and the matching Koji output.

Reference table

Eaquals categories and student feedback evidence
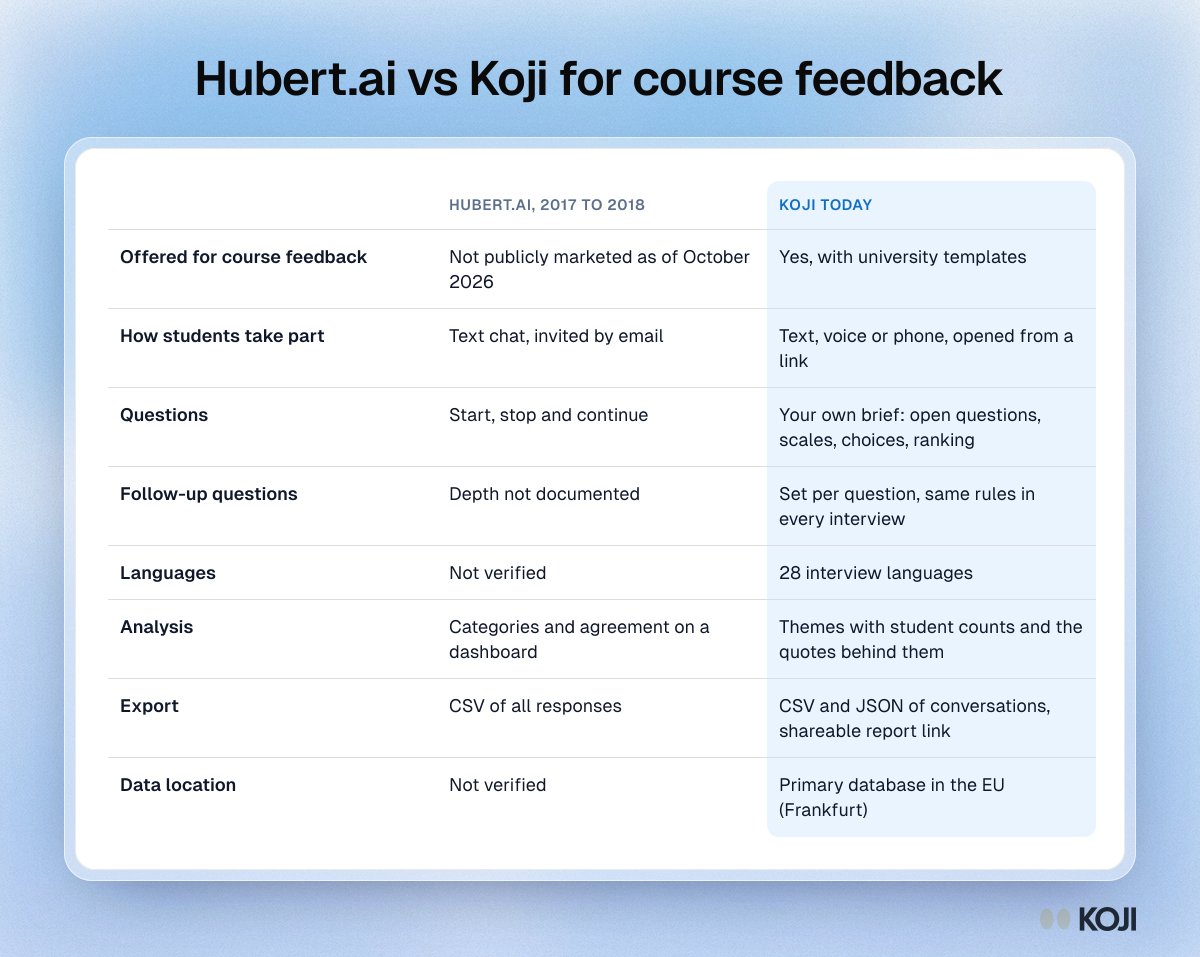
Comparison table of the Hubert.ai course feedback chatbot as documented in 2017 and 2018 and Koji today, covering access, follow-ups, analysis and data.

Reference table

Hubert.ai vs Koji for course feedback
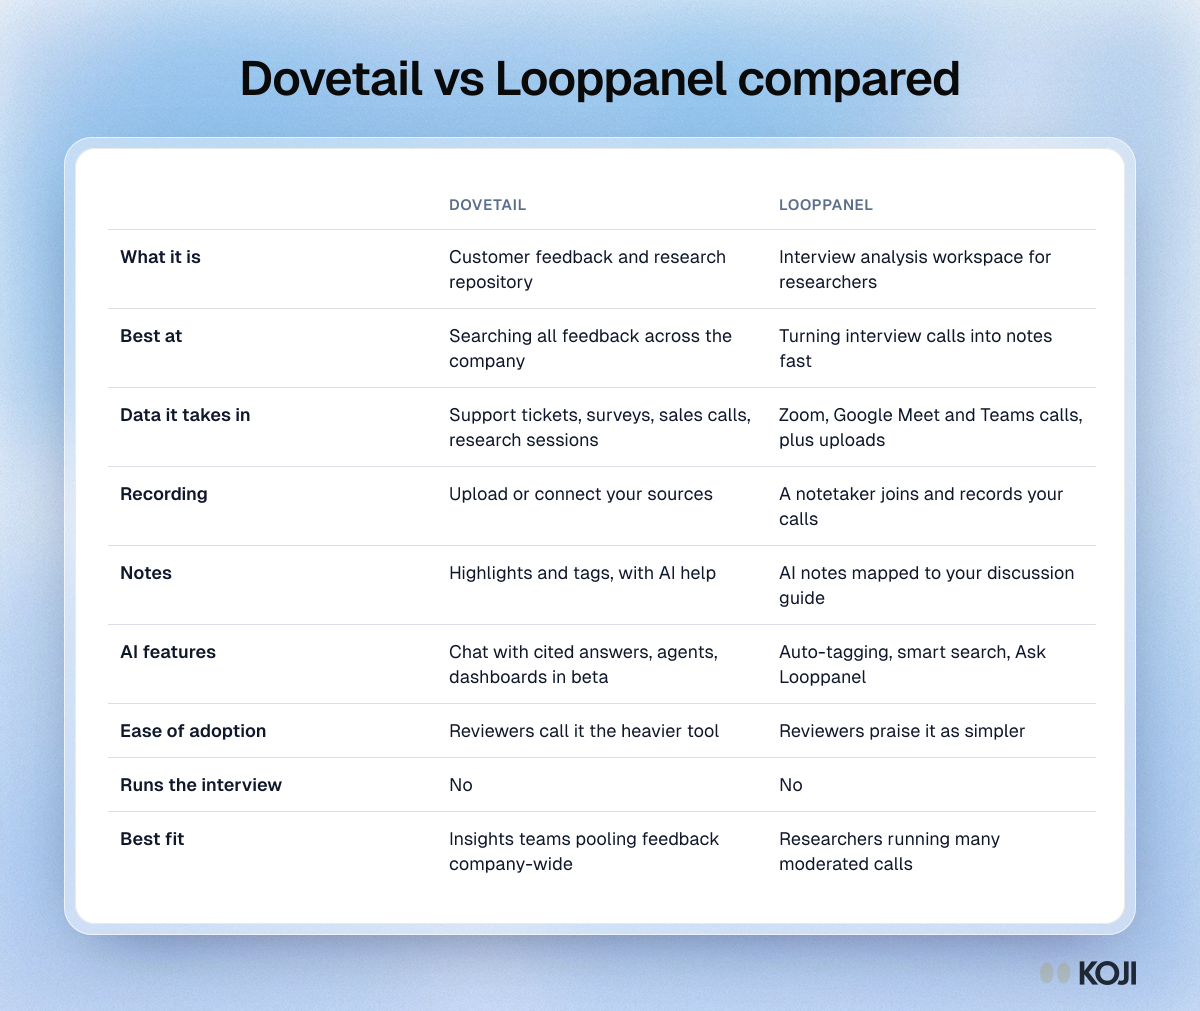
Table comparing Dovetail and Looppanel on what each tool is, the data it takes in, recording, notes, AI features, ease of adoption and best fit.

Reference table

Dovetail vs Looppanel compared
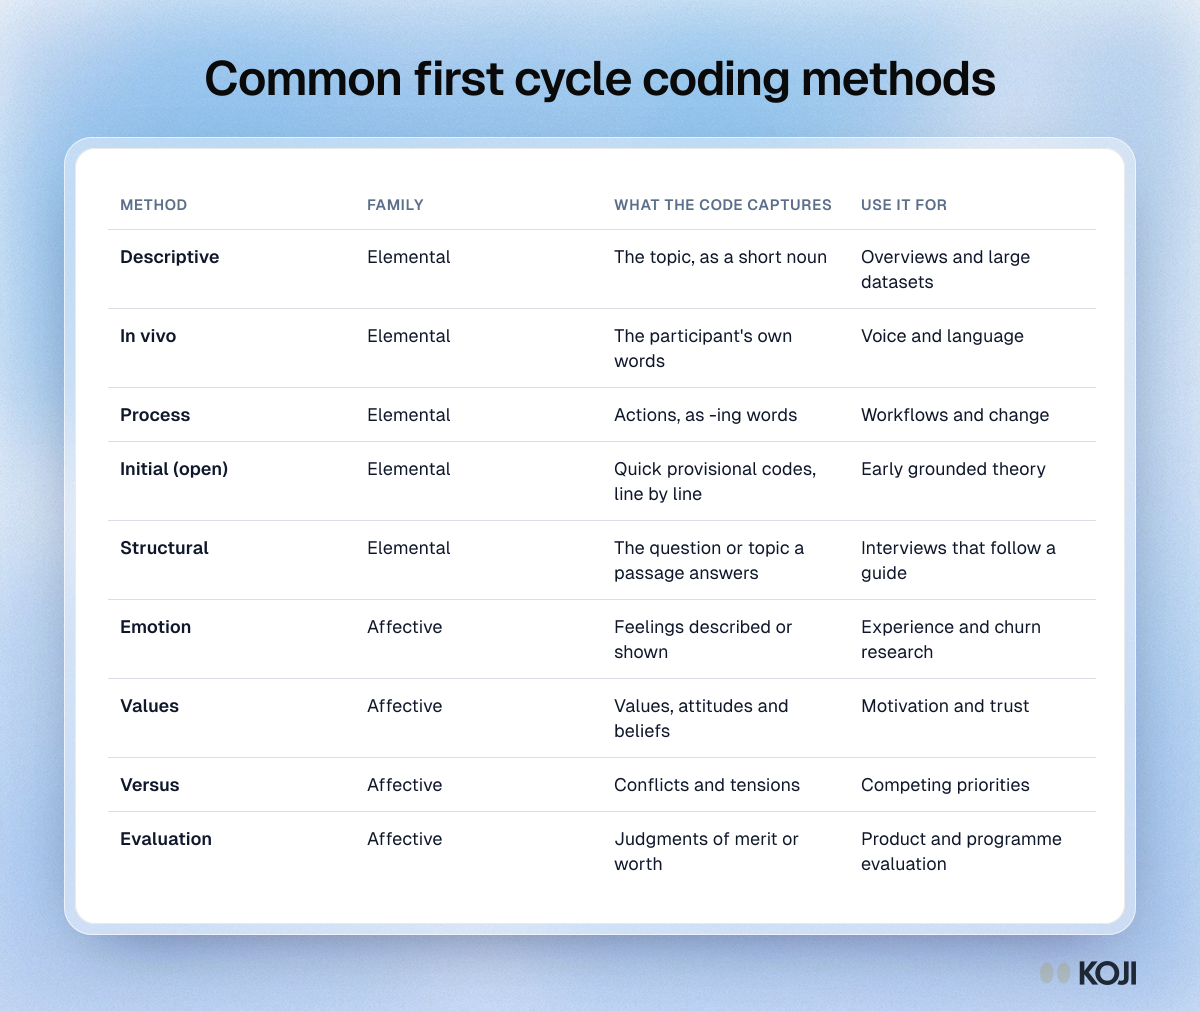
Table of common first cycle coding methods grouped by family, with what each code captures and when to use it.

Reference table

Common first cycle coding methods
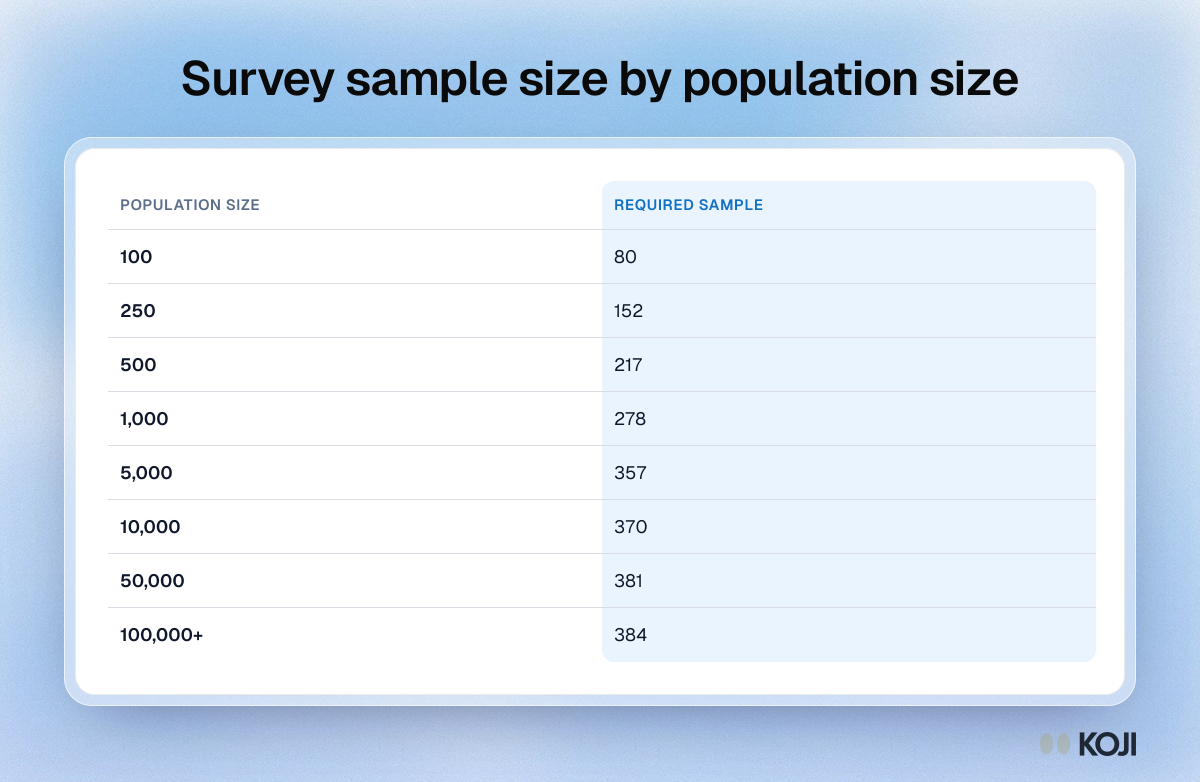
Table of the survey sample size needed at 95% confidence and a 5% margin of error for populations from 100 to 100,000 or more, topping out at 384.

Reference table

Survey sample size by population size
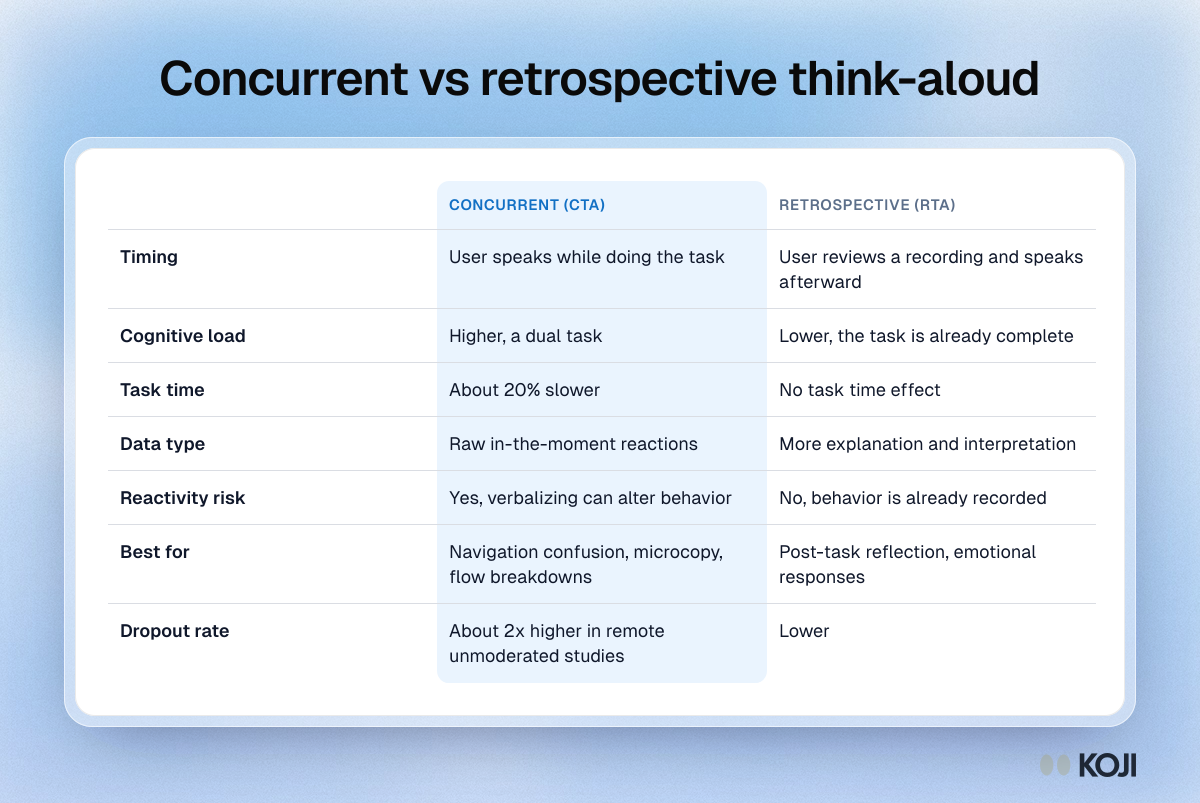
Table comparing concurrent and retrospective think-aloud across timing, cognitive load, task time, data type, reactivity risk, best use and dropout rate.

Reference table

Concurrent vs retrospective think-aloud
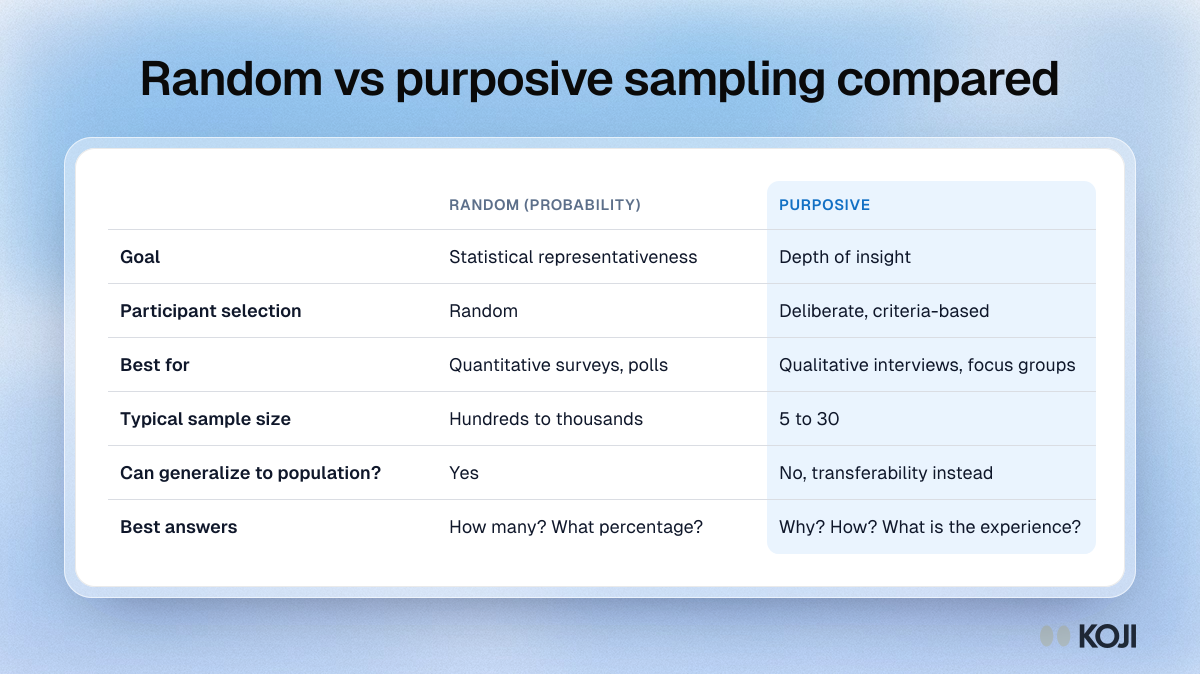
Table comparing random probability sampling with purposive sampling across goal, selection, best use, sample size, generalizing and the questions each answers.

Reference table

Random vs purposive sampling compared
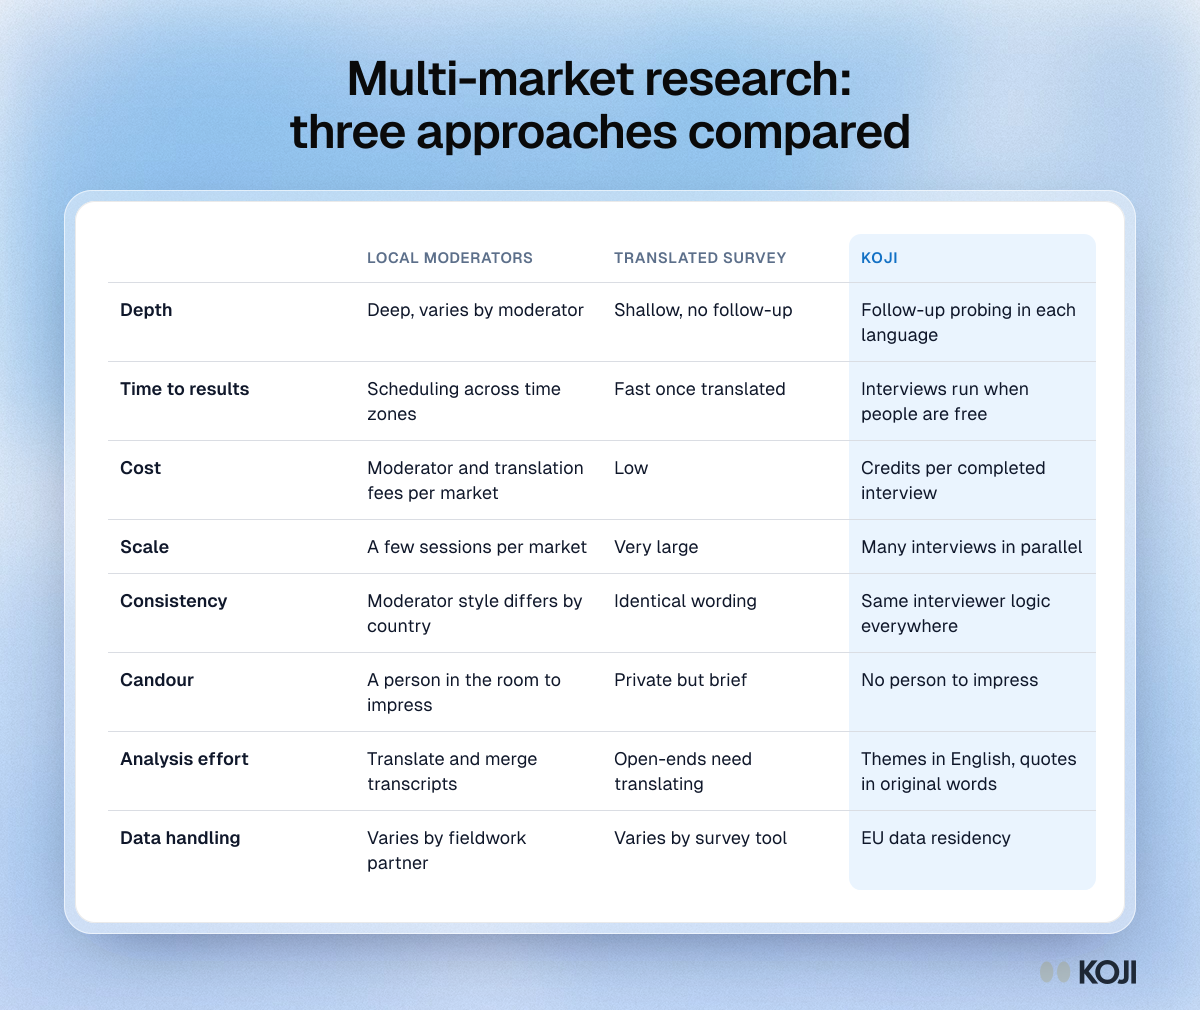
Table comparing local moderators, translated surveys and Koji for multi-market research on depth, cost, scale, consistency, candour and data handling.

Reference table

Multi-market research: three approaches compared
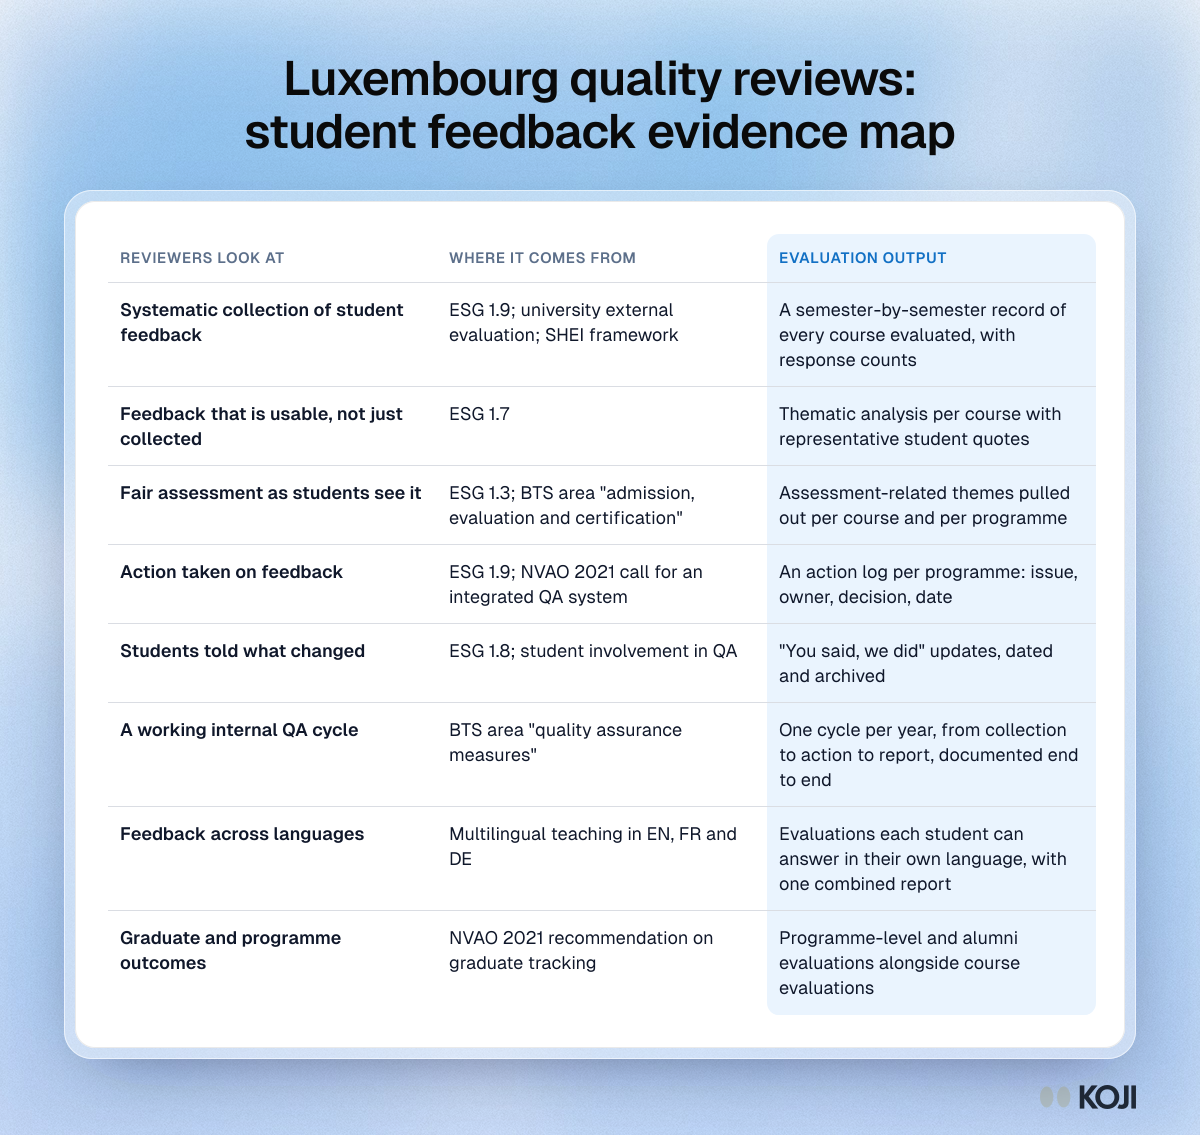
Table mapping what Luxembourg quality reviewers look at to the course evaluation output that answers each expectation.

Reference table

Luxembourg quality reviews: student feedback evidence map
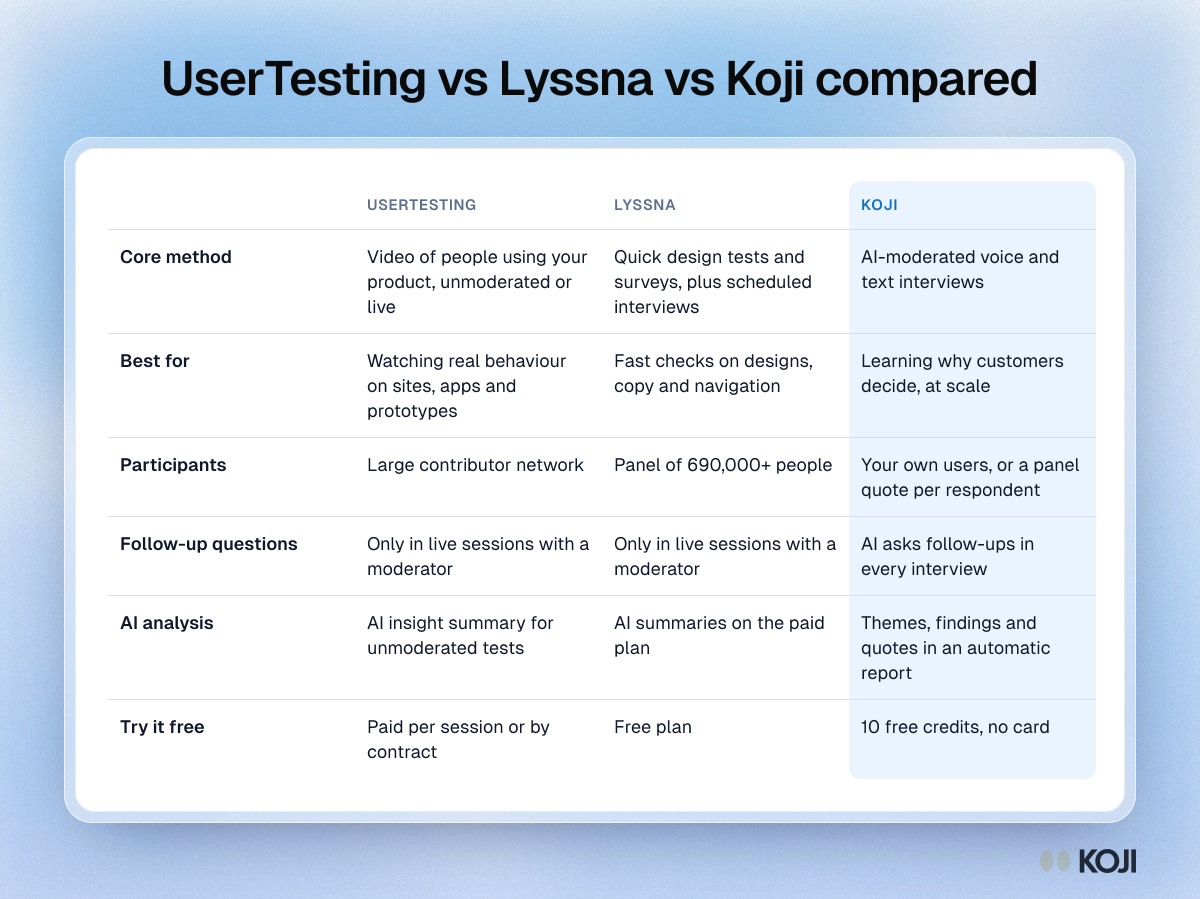
Table comparing UserTesting, Lyssna and Koji on core method, best use, participants, follow-up questions, AI analysis and free access.

Reference table

UserTesting vs Lyssna vs Koji compared
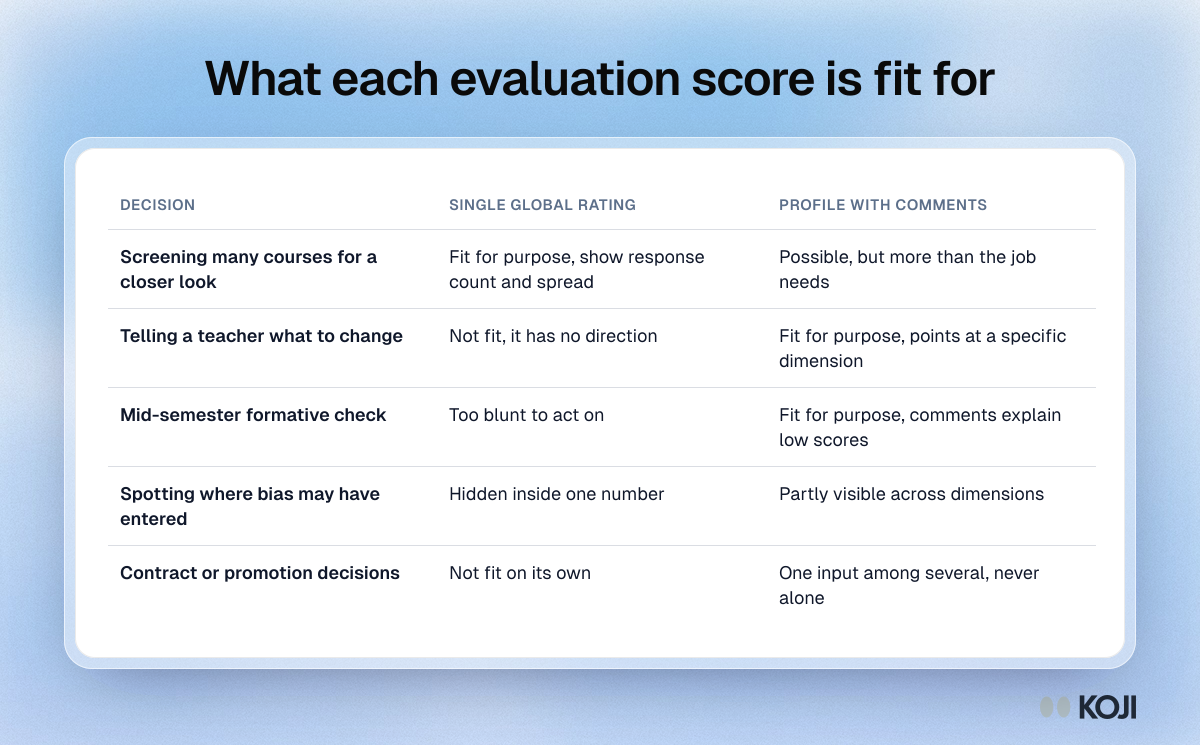
Table comparing a single global rating with a dimension profile across five evaluation decisions, from screening courses to promotion reviews

Reference table

What each evaluation score is fit for
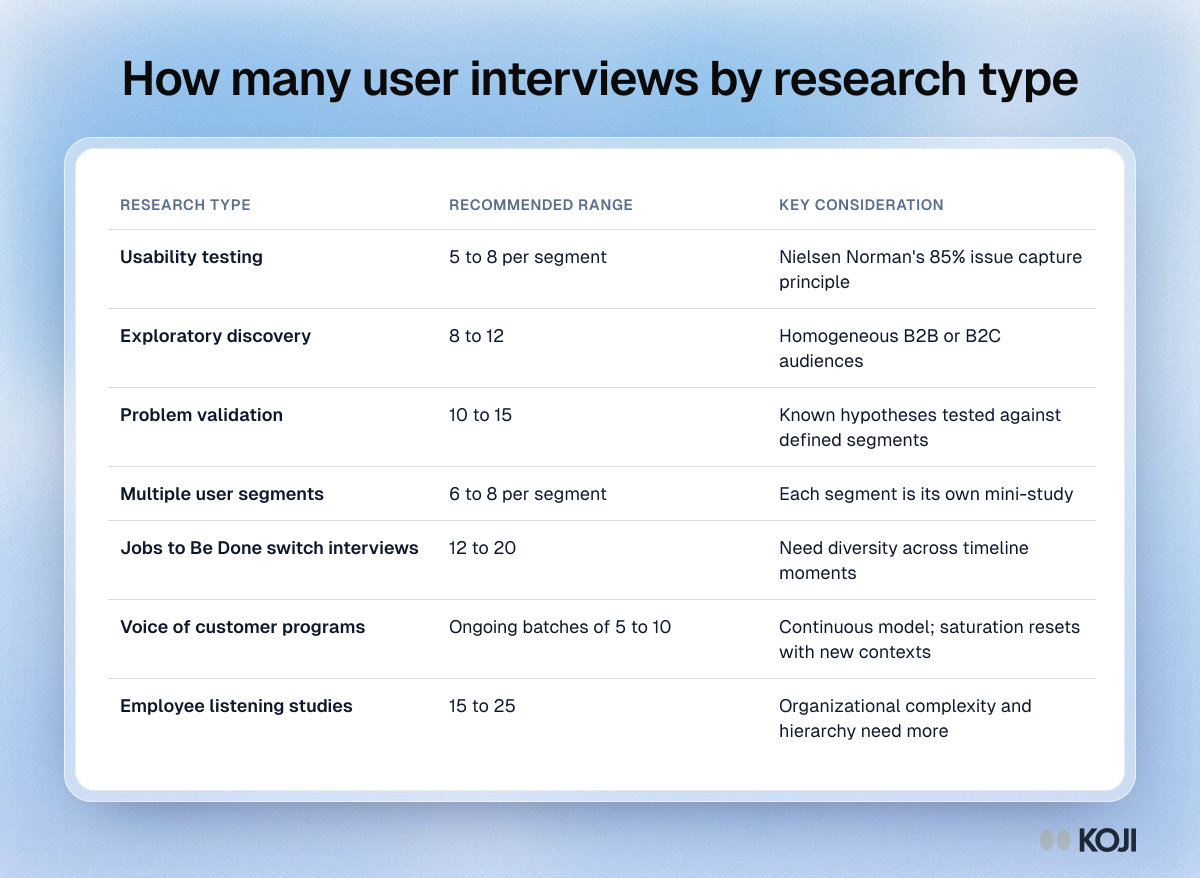
Table of recommended user interview counts for seven research types, from usability testing at 5 to 8 per segment to employee listening studies at 15 to 25.

Reference table

How many user interviews by research type
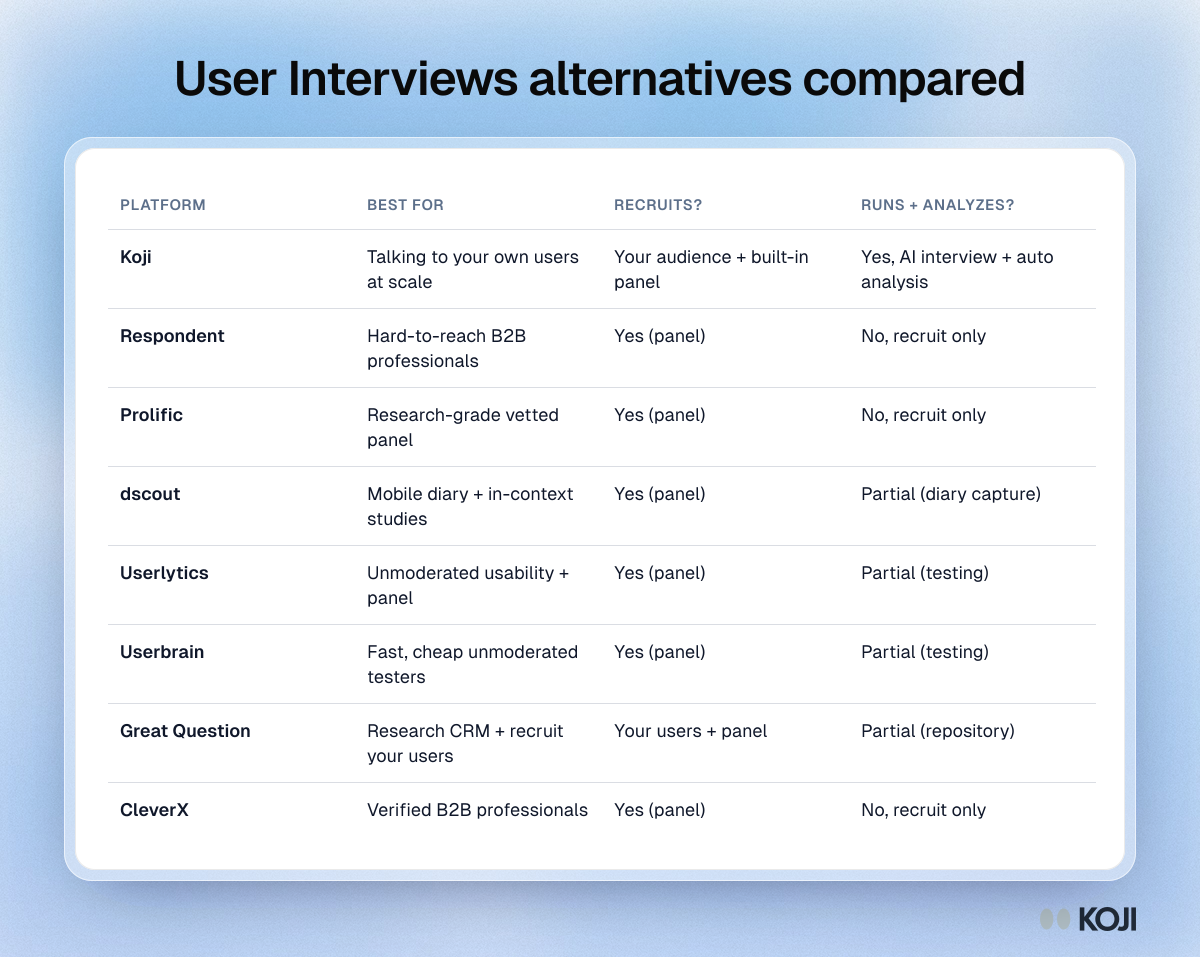
Table comparing eight User Interviews alternatives in 2026 by best use, whether they recruit participants, and whether they run and analyze the sessions.

Reference table

User Interviews alternatives compared
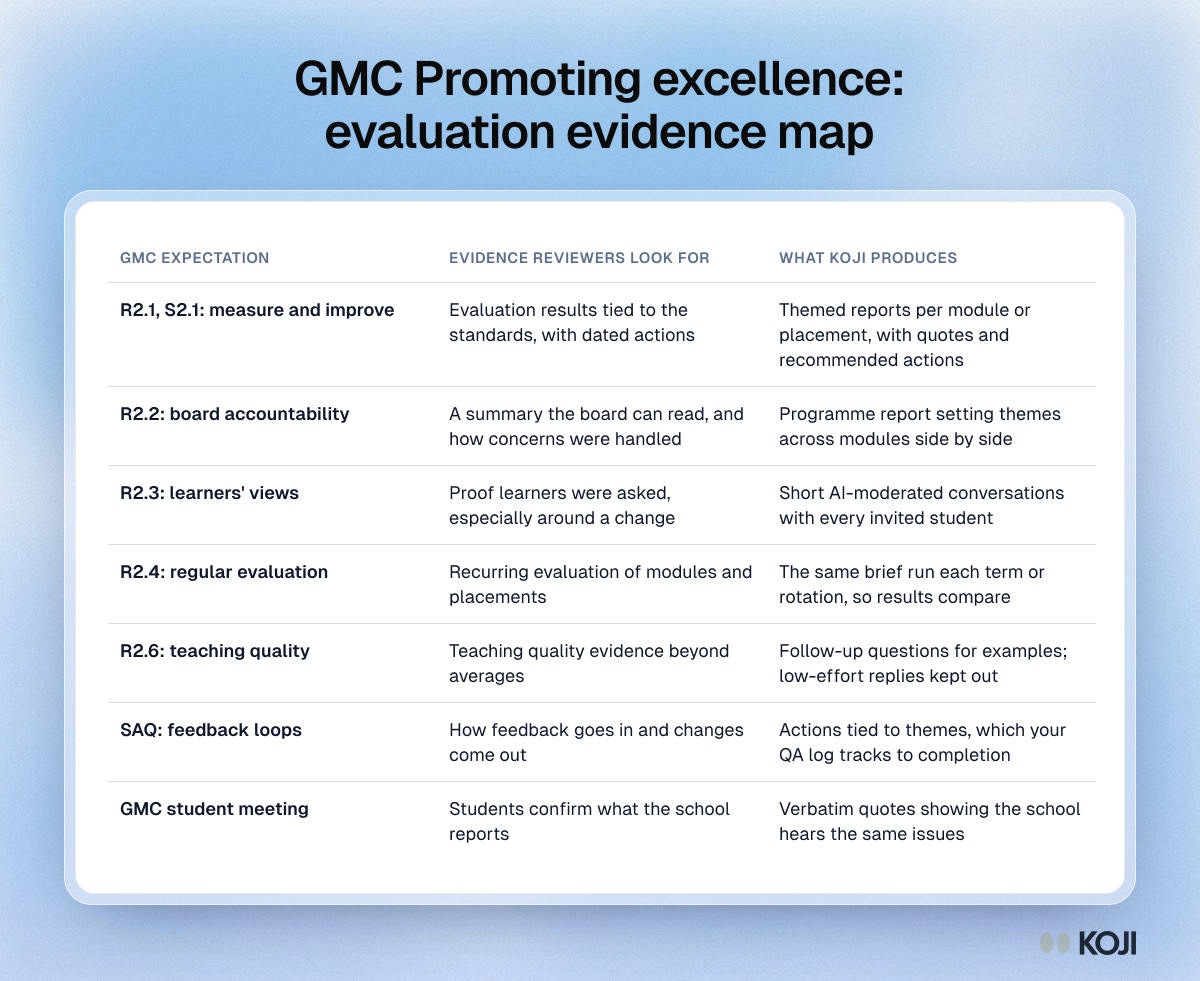
Table mapping GMC Promoting excellence requirements to the evaluation evidence reviewers look for and the Koji output that supports each one.

Reference table

GMC Promoting excellence: evaluation evidence map
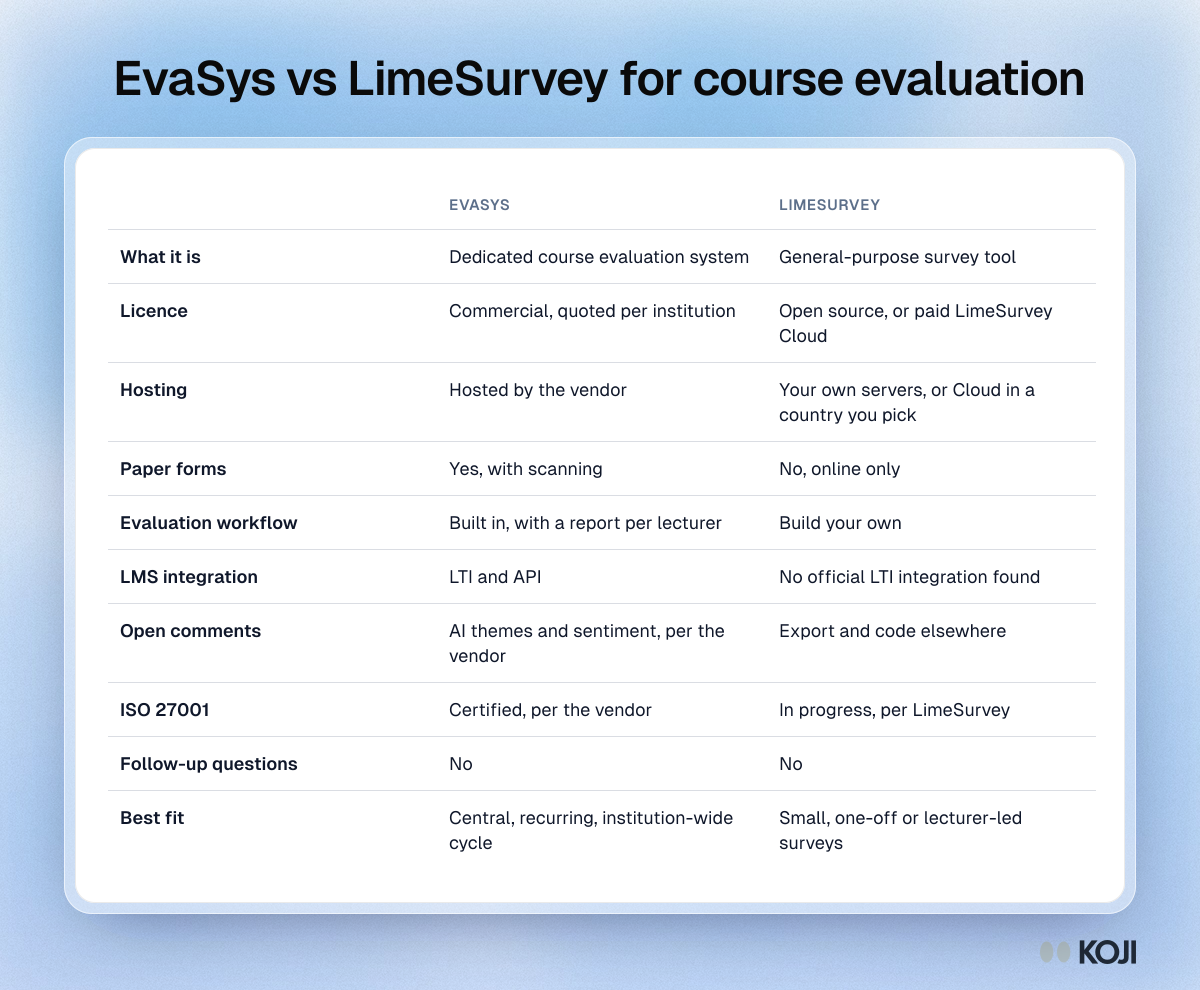
Table comparing EvaSys and LimeSurvey for course evaluation across licence, hosting, paper surveys, workflow, LMS, text analysis and best fit.

Reference table

EvaSys vs LimeSurvey for course evaluation
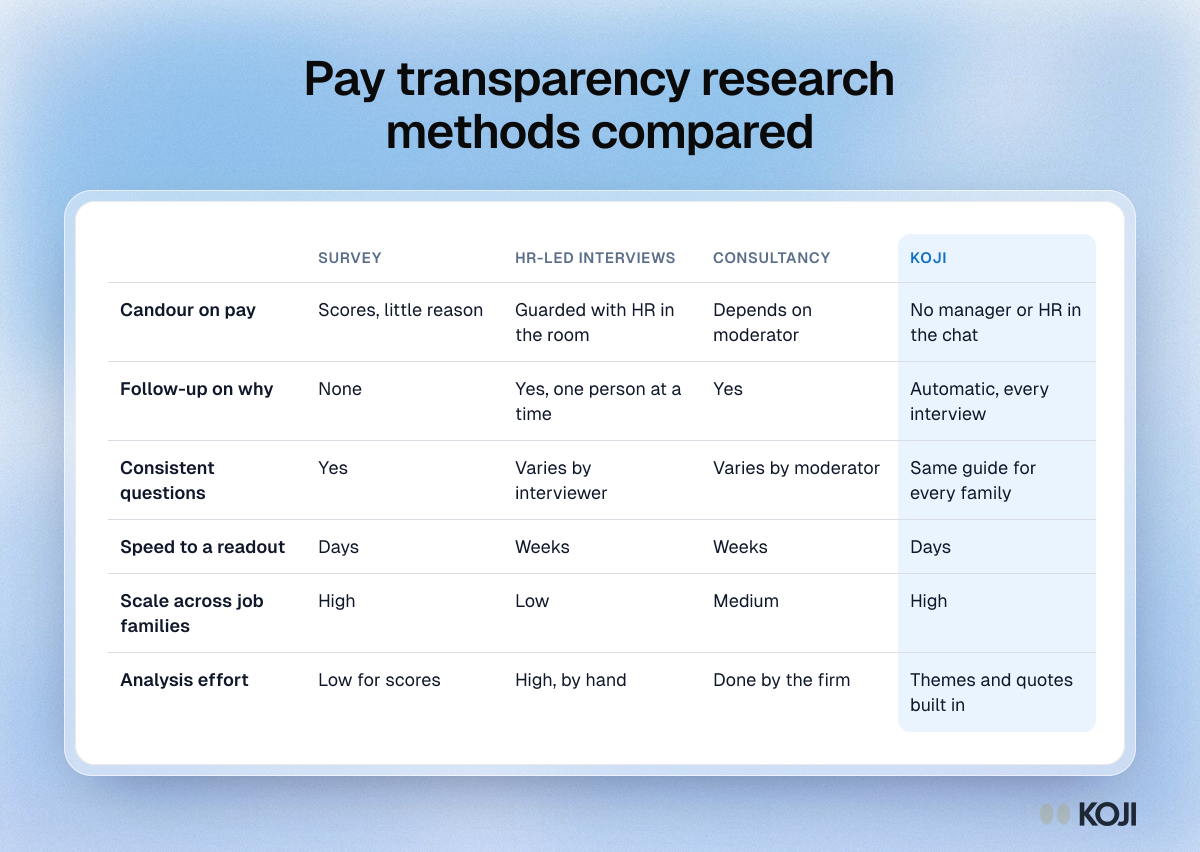
Table comparing survey, HR-led interviews, consultancy and Koji for pay transparency research on candour, follow-up, speed and scale.

Reference table

Pay transparency research methods compared
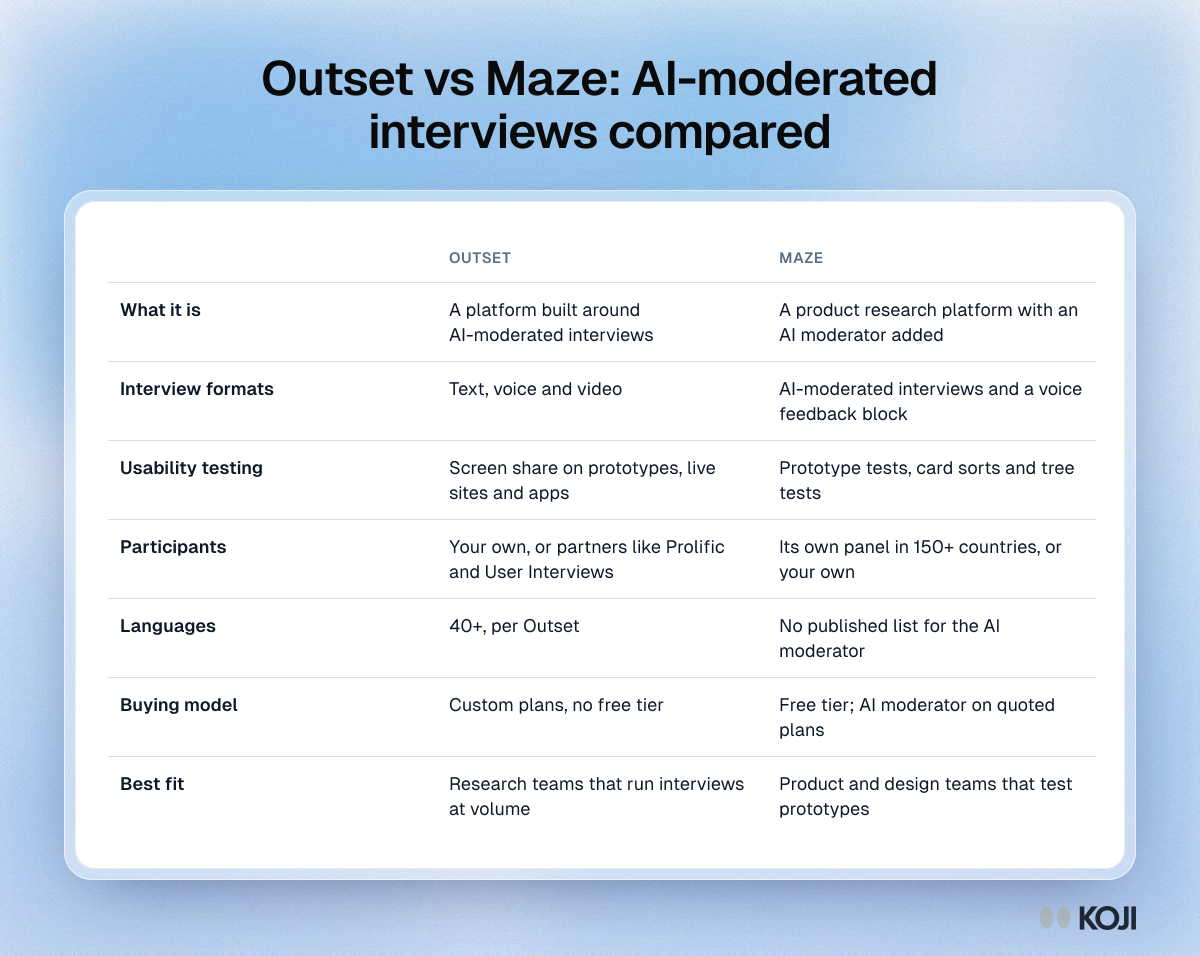
Table comparing Outset and Maze on what each is, interview formats, usability testing, participants, languages, buying model and best fit

Reference table

Outset vs Maze: AI-moderated interviews compared
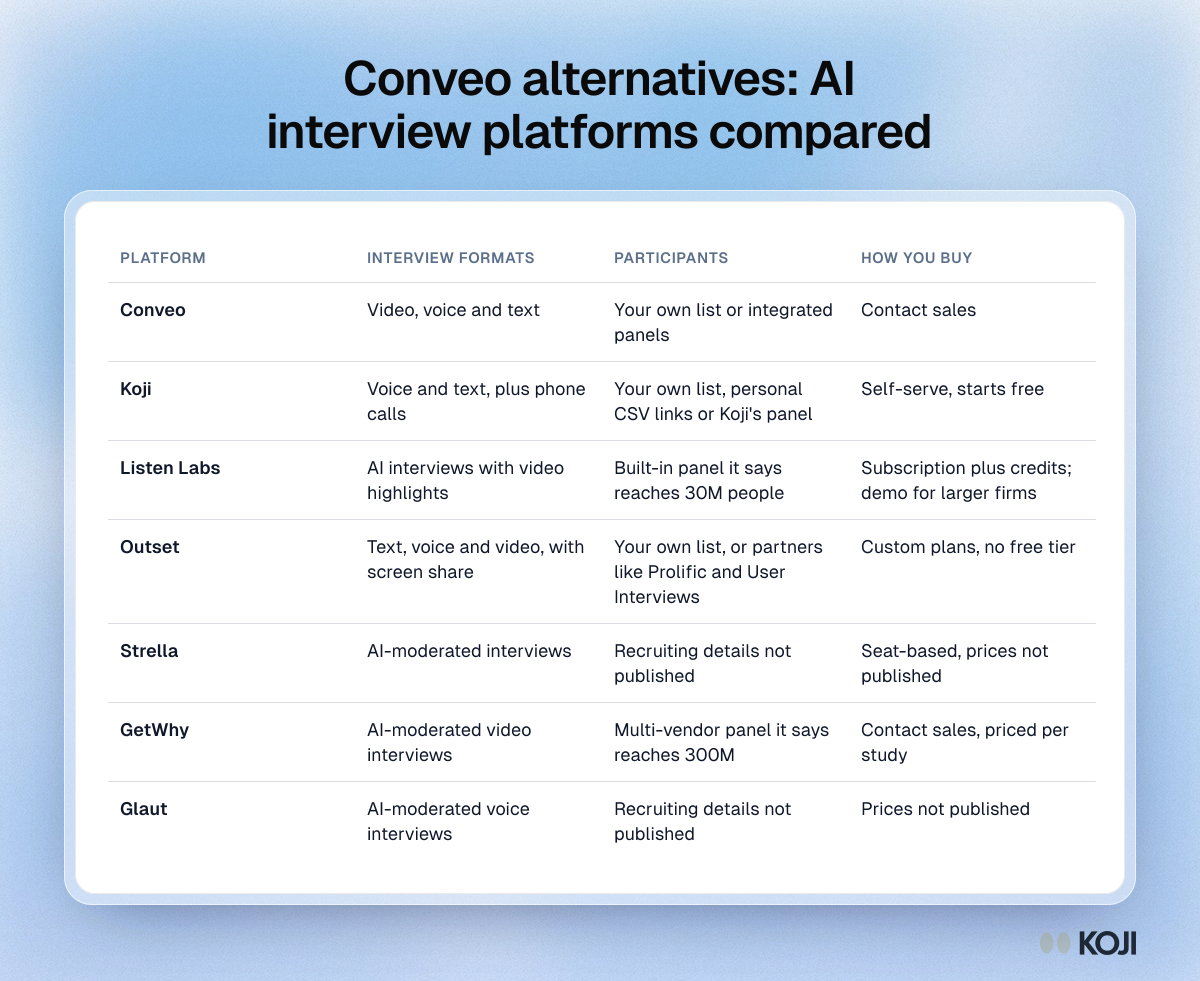
Table comparing Conveo with six alternatives on interview formats, where participants come from and how you buy

Reference table

Conveo alternatives: AI interview platforms compared
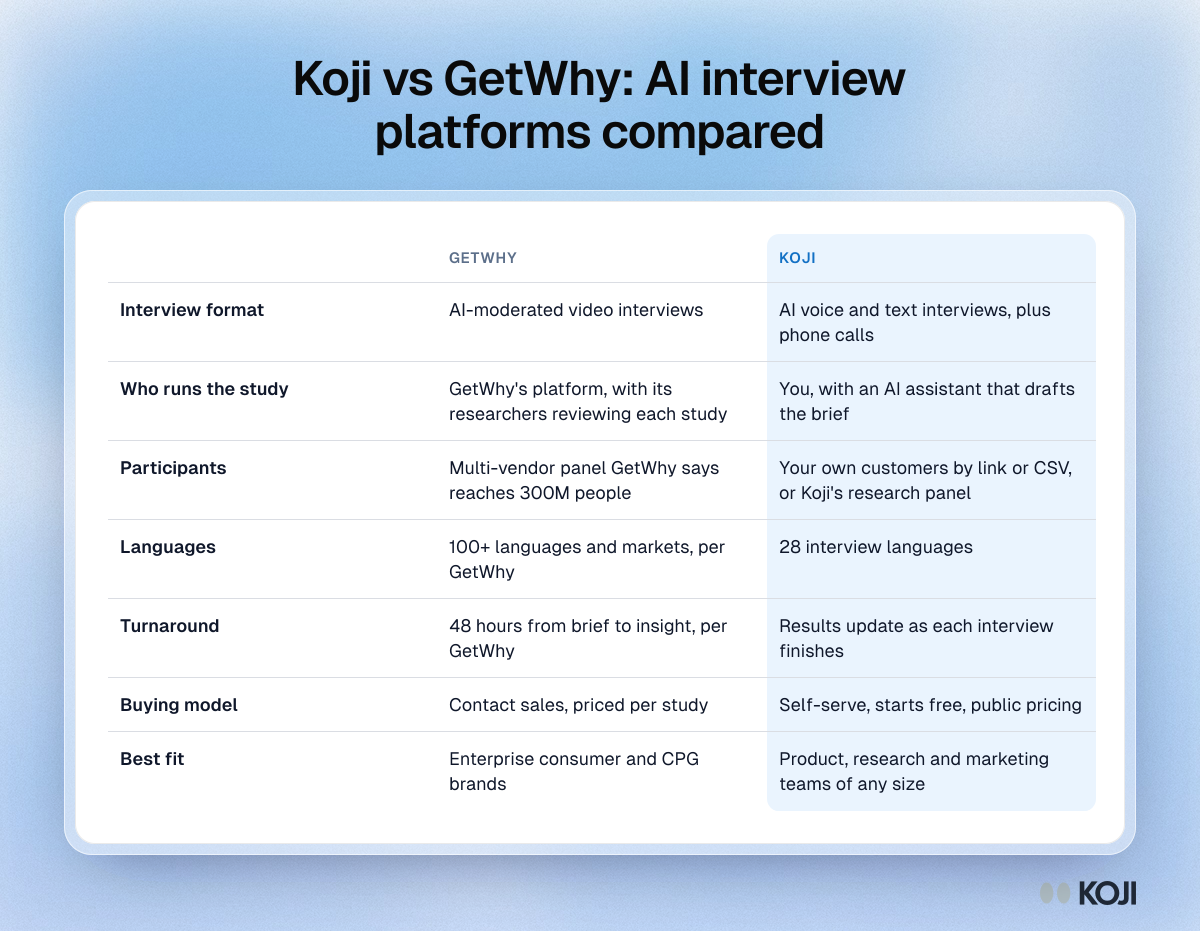
Table comparing GetWhy and Koji on interview format, who runs the study, participants, languages, turnaround, buying model and best fit

Reference table

Koji vs GetWhy: AI interview platforms compared
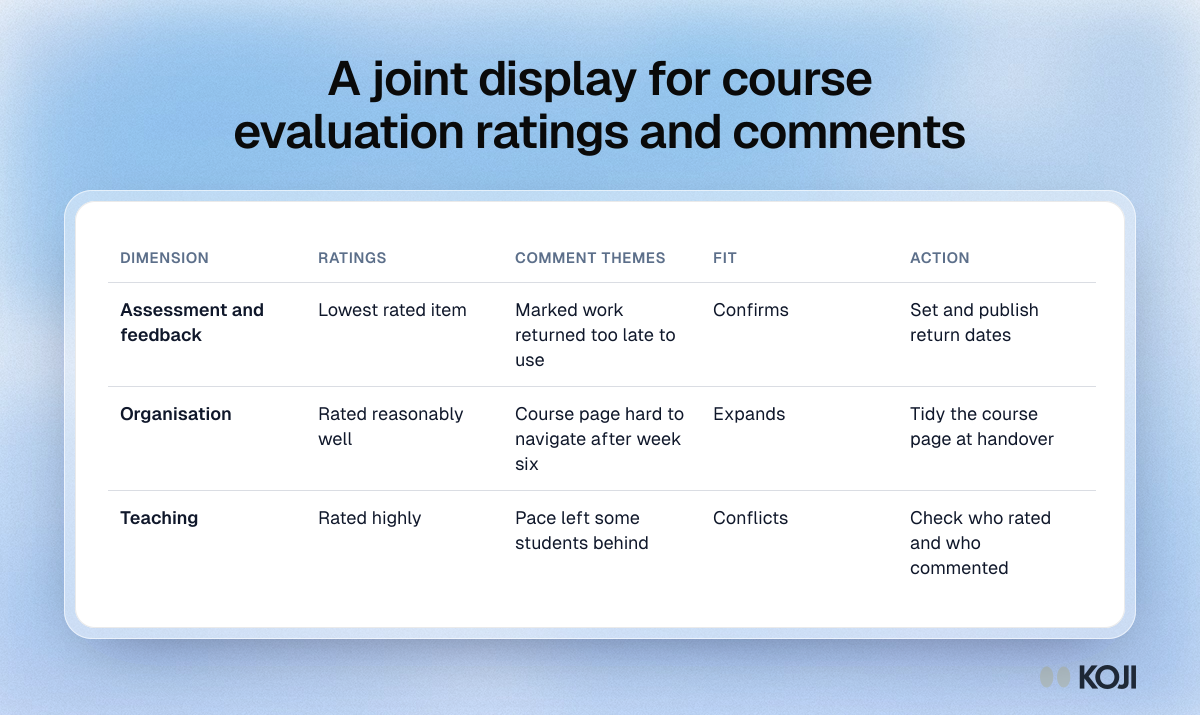
Table showing a joint display for course evaluation: each dimension lists its rating, comment themes, whether they confirm, expand or conflict, and the action.

Reference table

A joint display for course evaluation ratings and comments
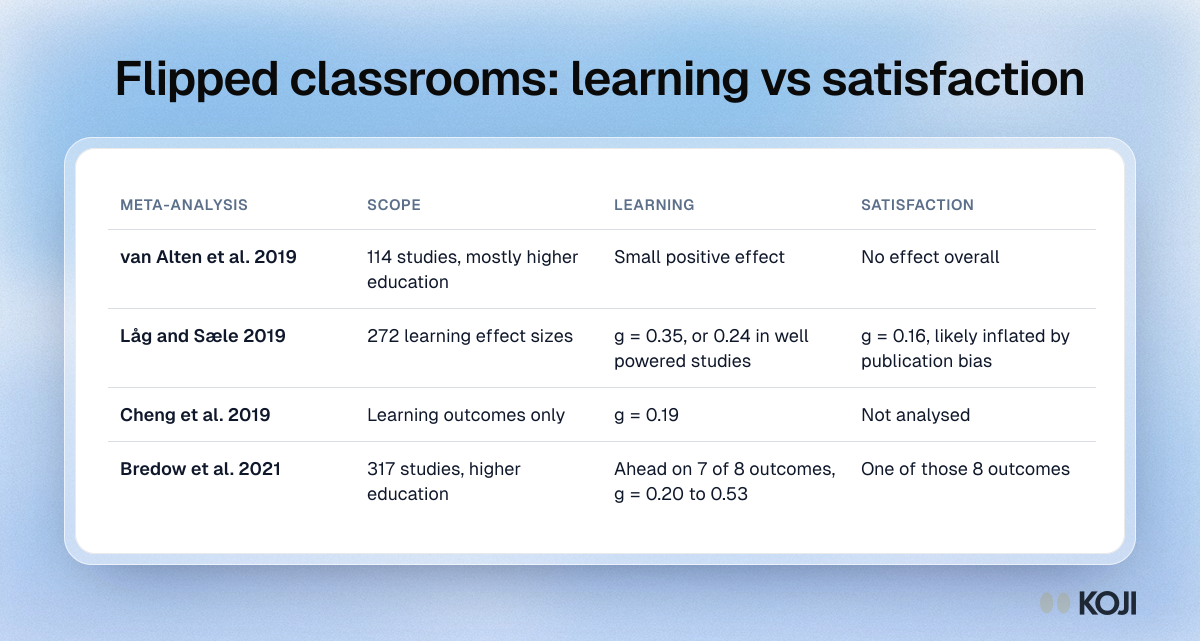
Table comparing four meta-analyses of flipped classrooms: effects on learning outcomes are small to moderate, effects on satisfaction are smaller or absent.

Reference table

Flipped classrooms: learning vs satisfaction
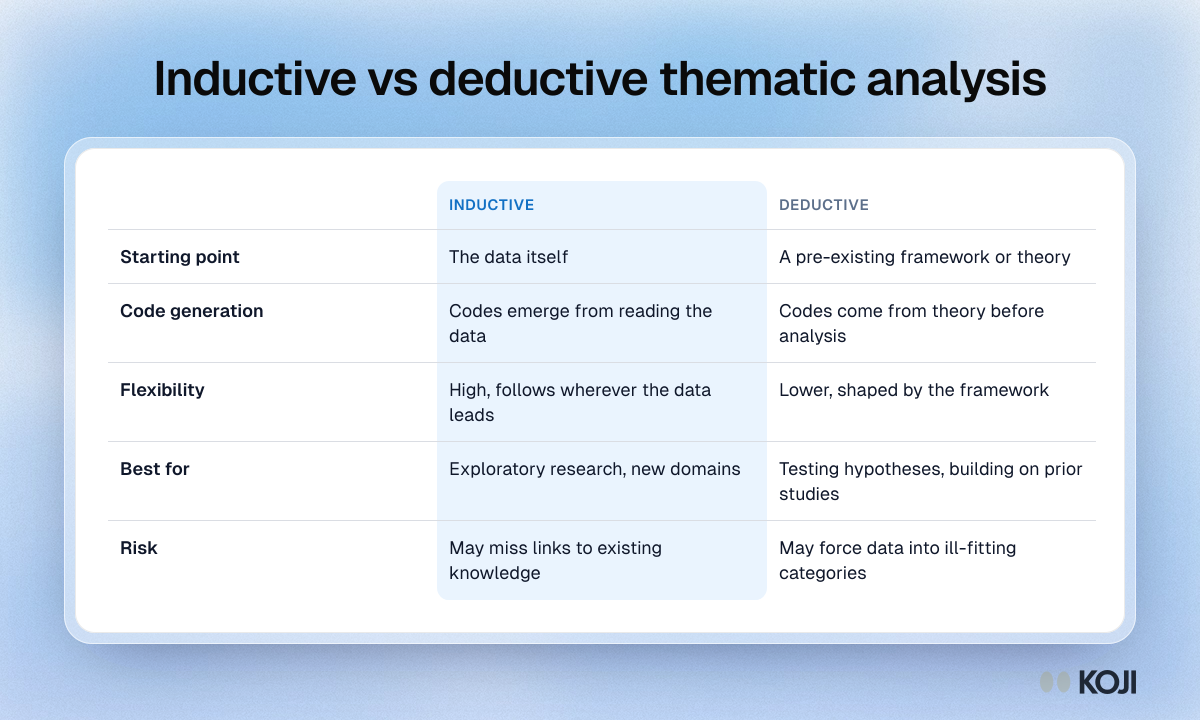
Table comparing inductive and deductive thematic analysis on starting point, code generation, flexibility, best use and risk.

Reference table

Inductive vs deductive thematic analysis
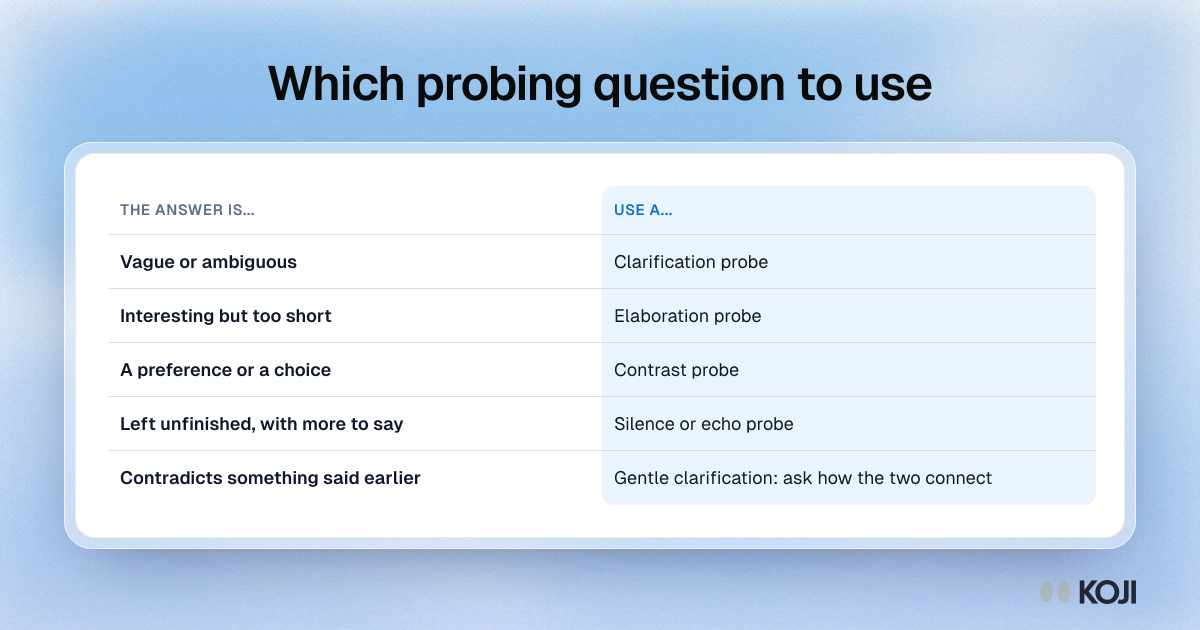
Table matching the kind of interview answer to the probe to use: clarification, elaboration, contrast, silence, echo or a gentle check on contradictions.

Reference table

Which probing question to use
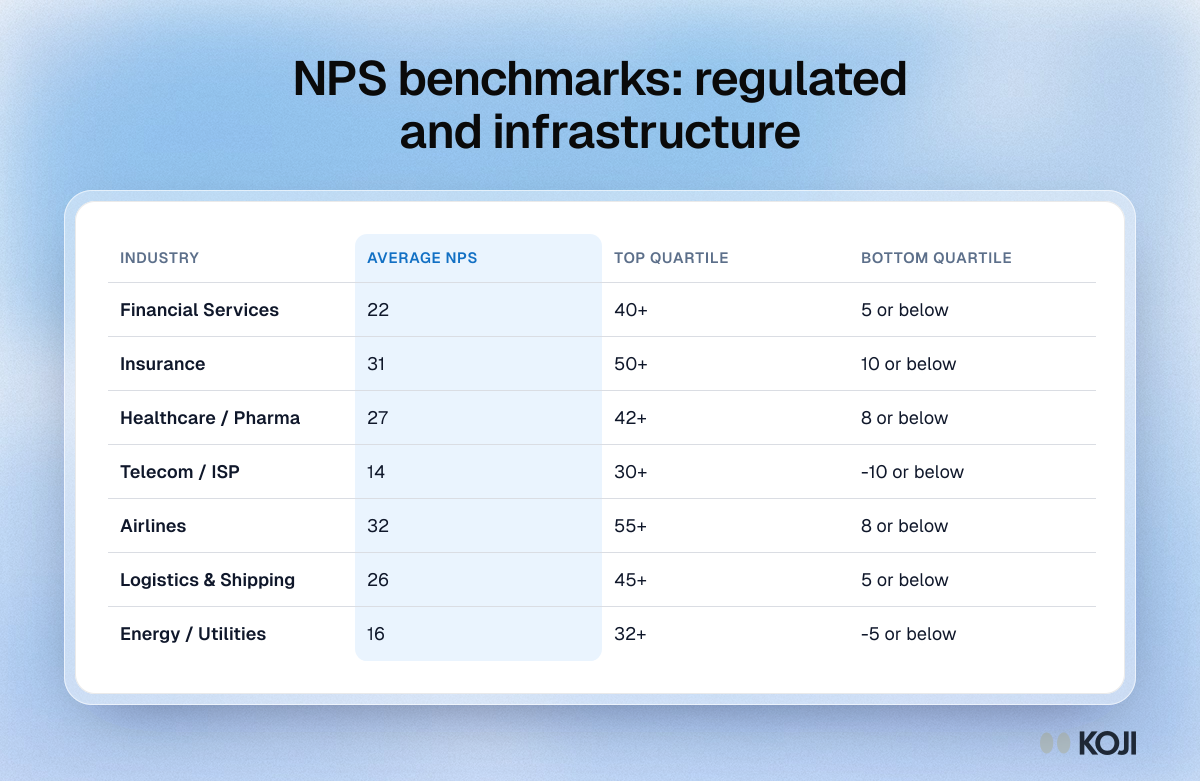
Table of 2026 NPS benchmarks for seven regulated industries, including finance, insurance, healthcare and telecom, with quartile cut-offs.

Reference table

NPS benchmarks: regulated and infrastructure
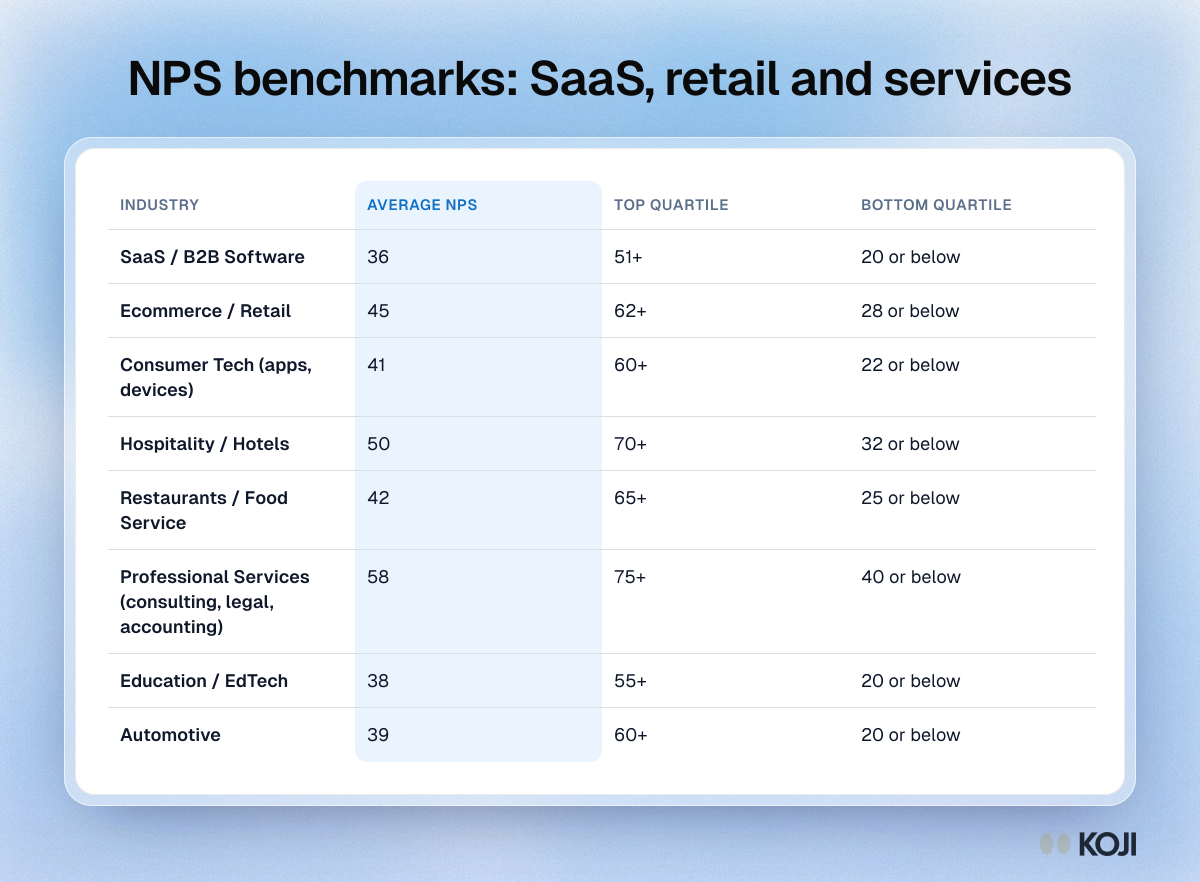
Table of 2026 NPS benchmarks for eight industries, including SaaS, ecommerce and hospitality, with average, top quartile and bottom quartile scores.

Reference table

NPS benchmarks: SaaS, retail and services
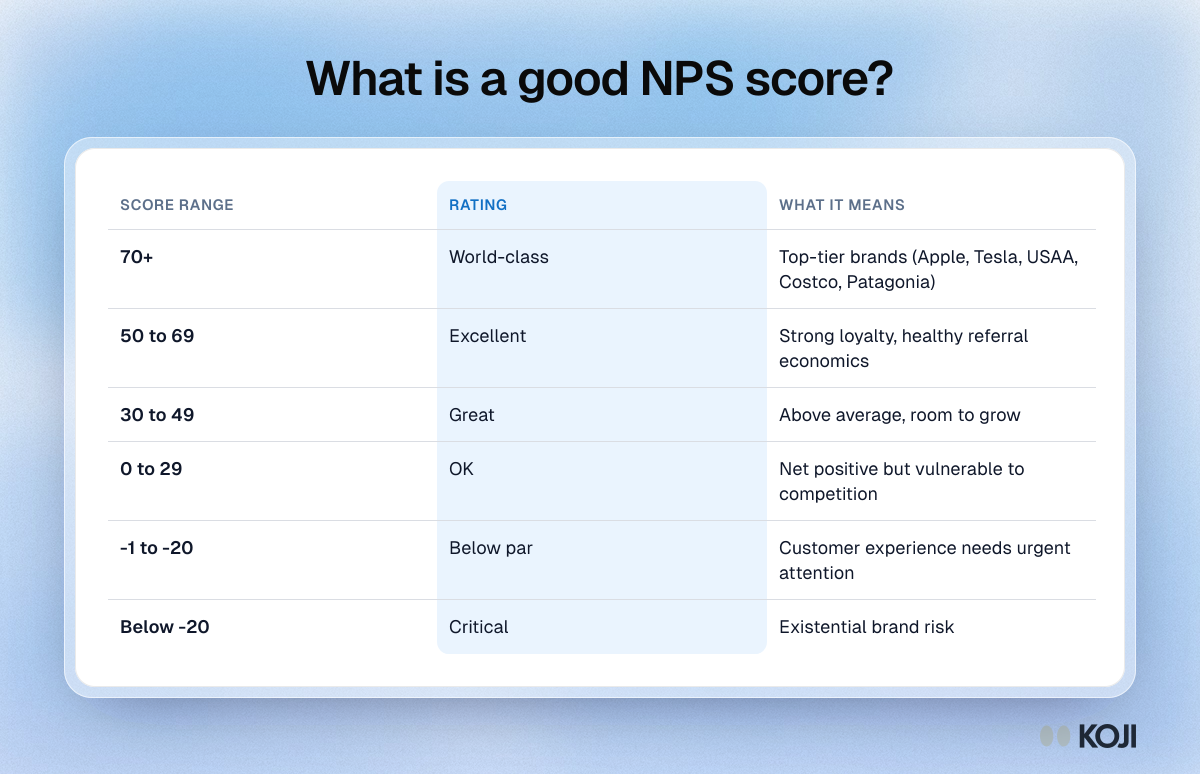
Table showing how to read a Net Promoter Score, from 70 and above rated world-class down to below minus 20 rated critical, with what each range means.

Reference table

What is a good NPS score?
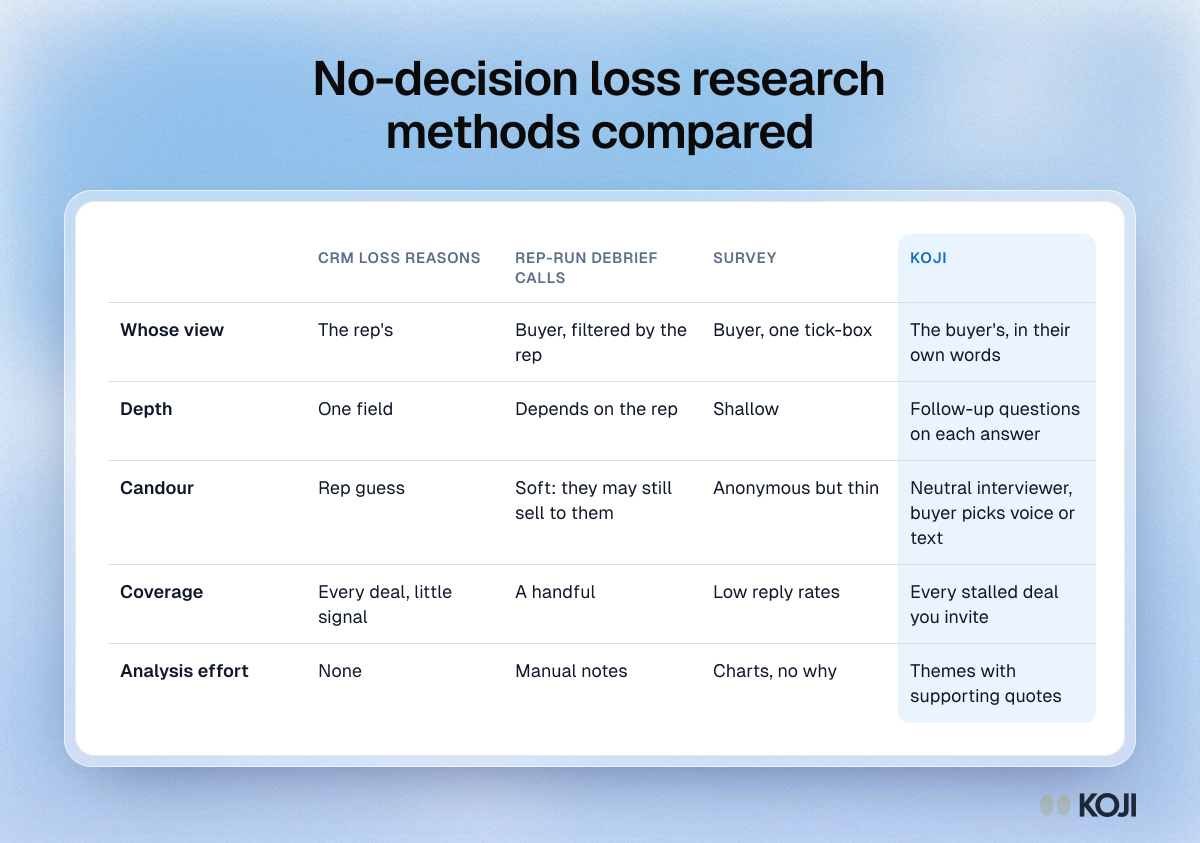
Table comparing CRM loss reasons, rep-run debrief calls, surveys and Koji for no-decision loss research on view, depth, candour, coverage and analysis effort.

Reference table

No-decision loss research methods compared
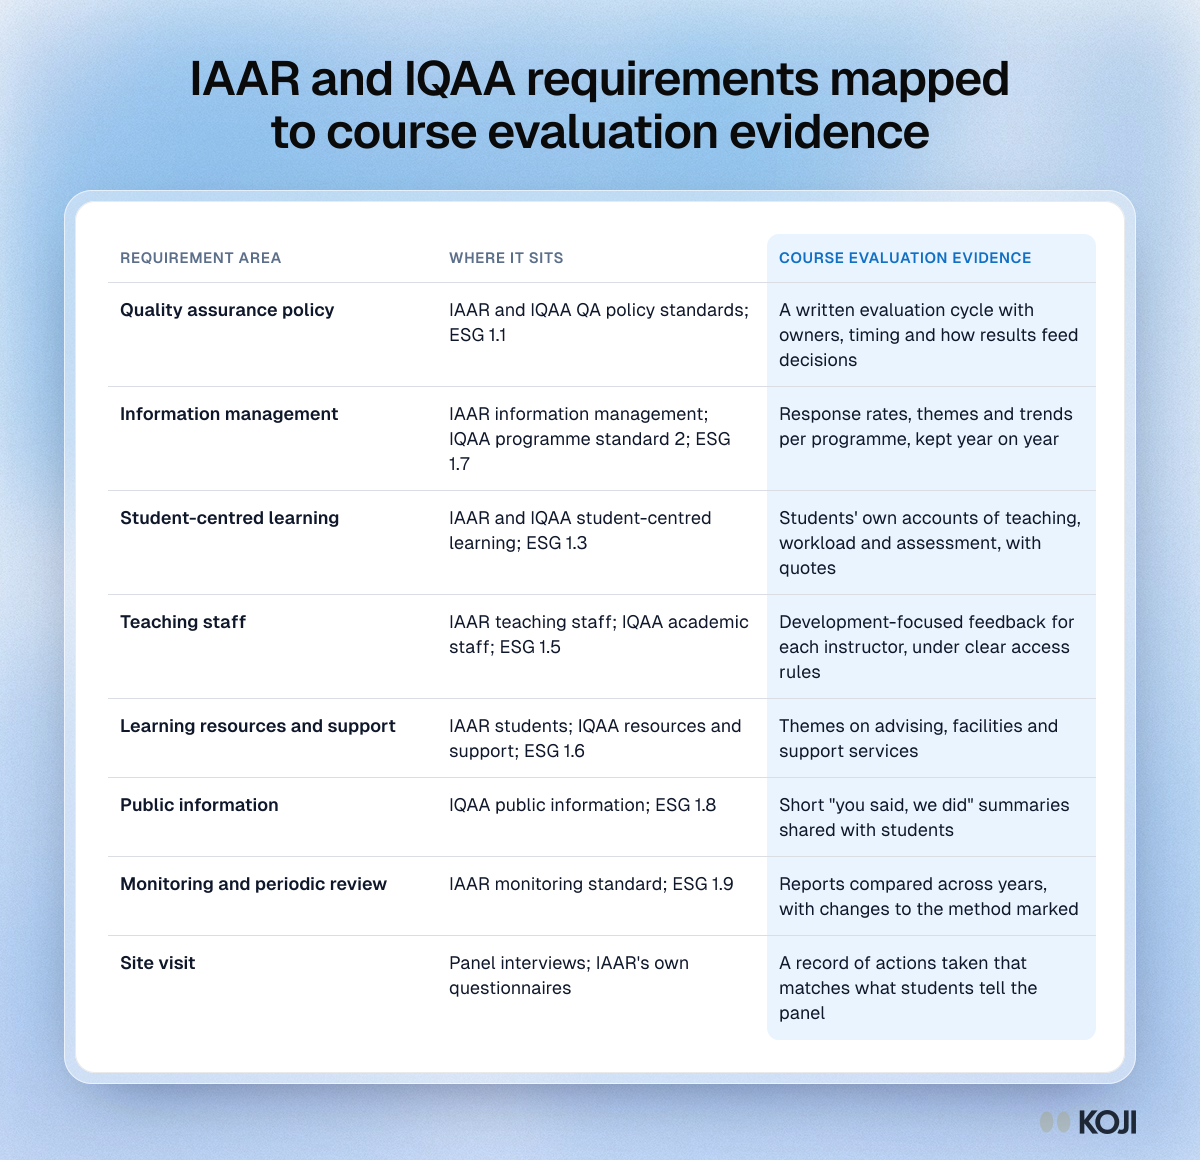
Table mapping IAAR and IQAA accreditation requirements in Kazakhstan to course evaluation evidence, from QA policy to periodic review.

Reference table

IAAR and IQAA requirements mapped to course evaluation evidence
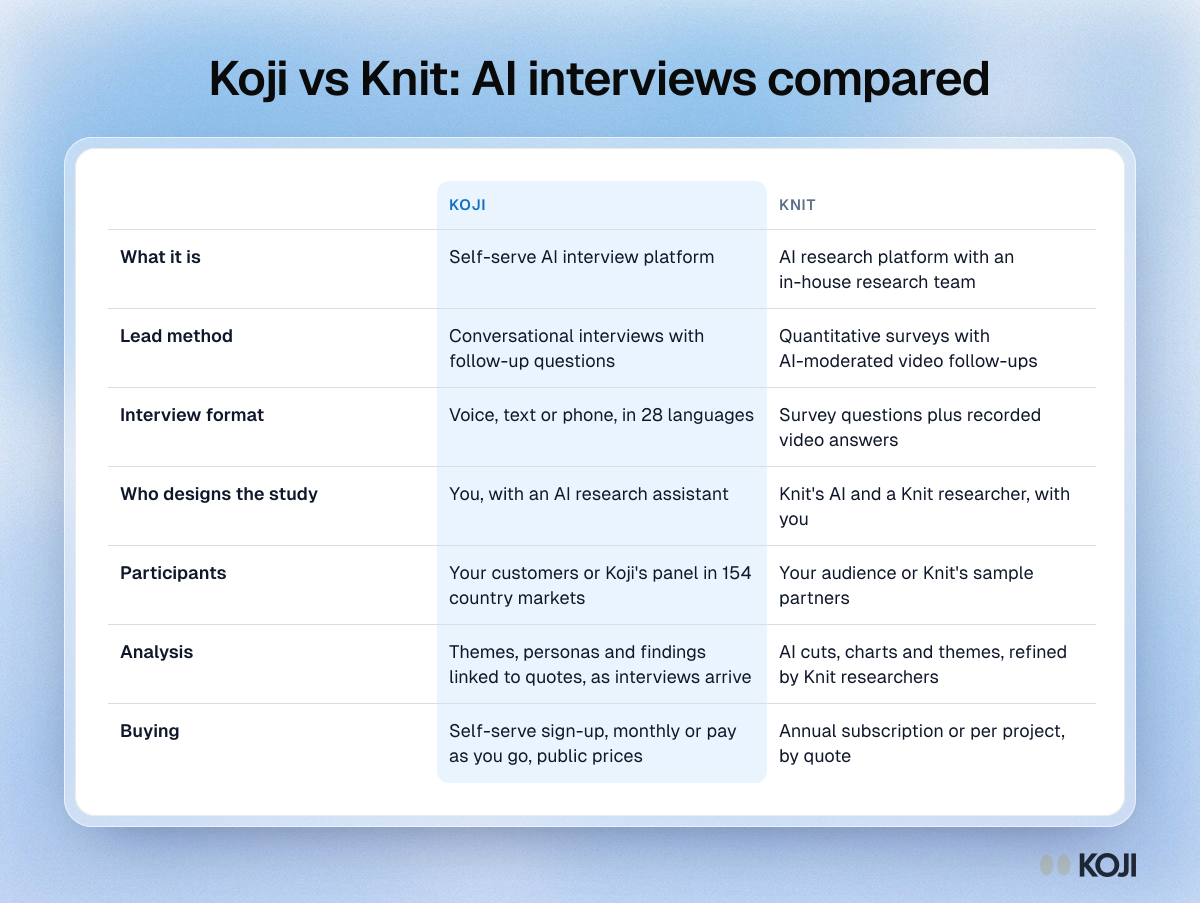
Table comparing Koji and Knit on method, interview format, study design, participants, analysis and how you buy

Reference table

Koji vs Knit: AI interviews compared
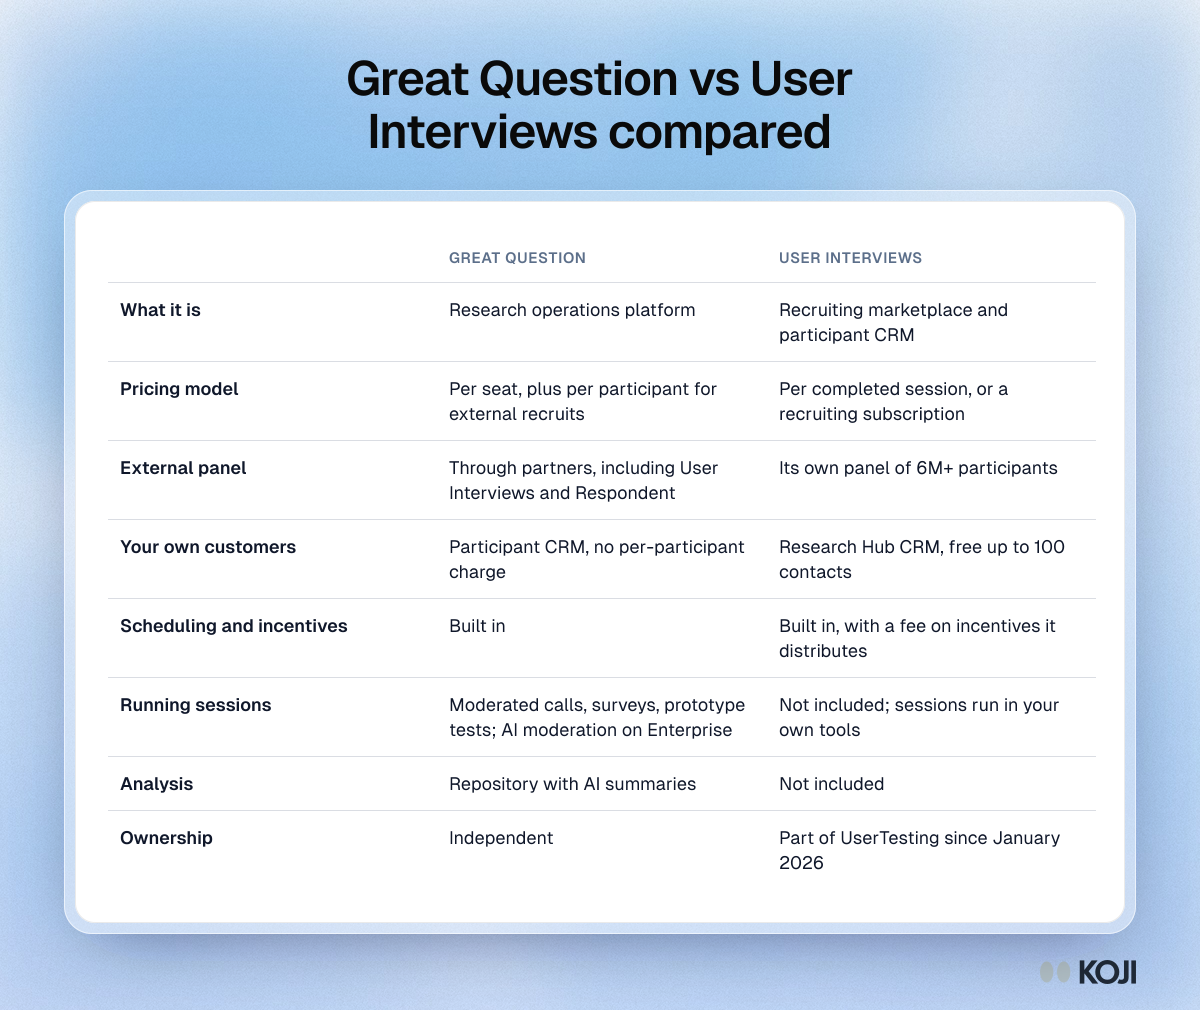
Table comparing Great Question and User Interviews on pricing model, panel access, CRM, scheduling, running sessions and analysis

Reference table

Great Question vs User Interviews compared
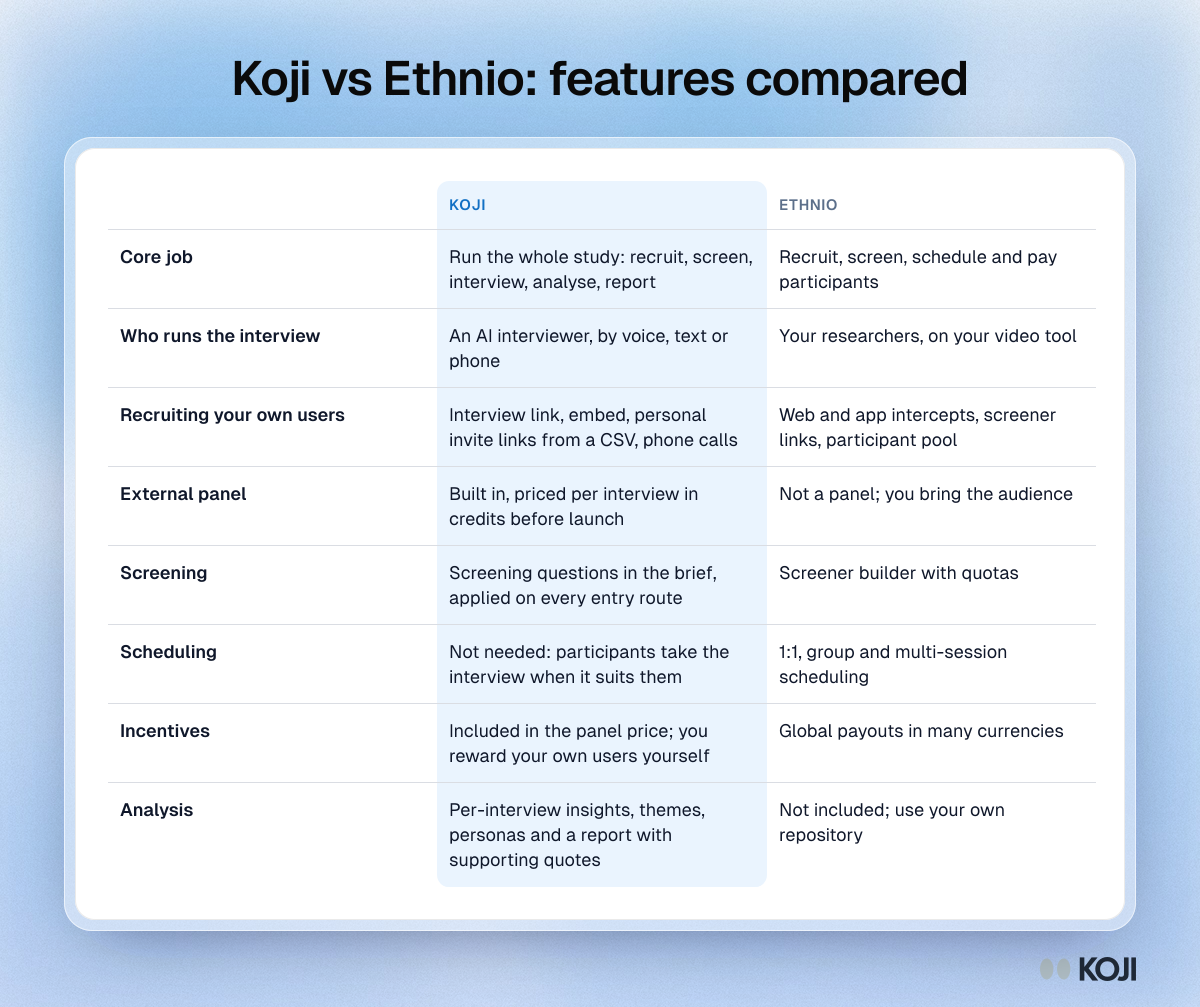
Table comparing Koji and Ethnio on core job, who runs the interview, recruiting, panel access, scheduling and analysis

Reference table

Koji vs Ethnio: features compared
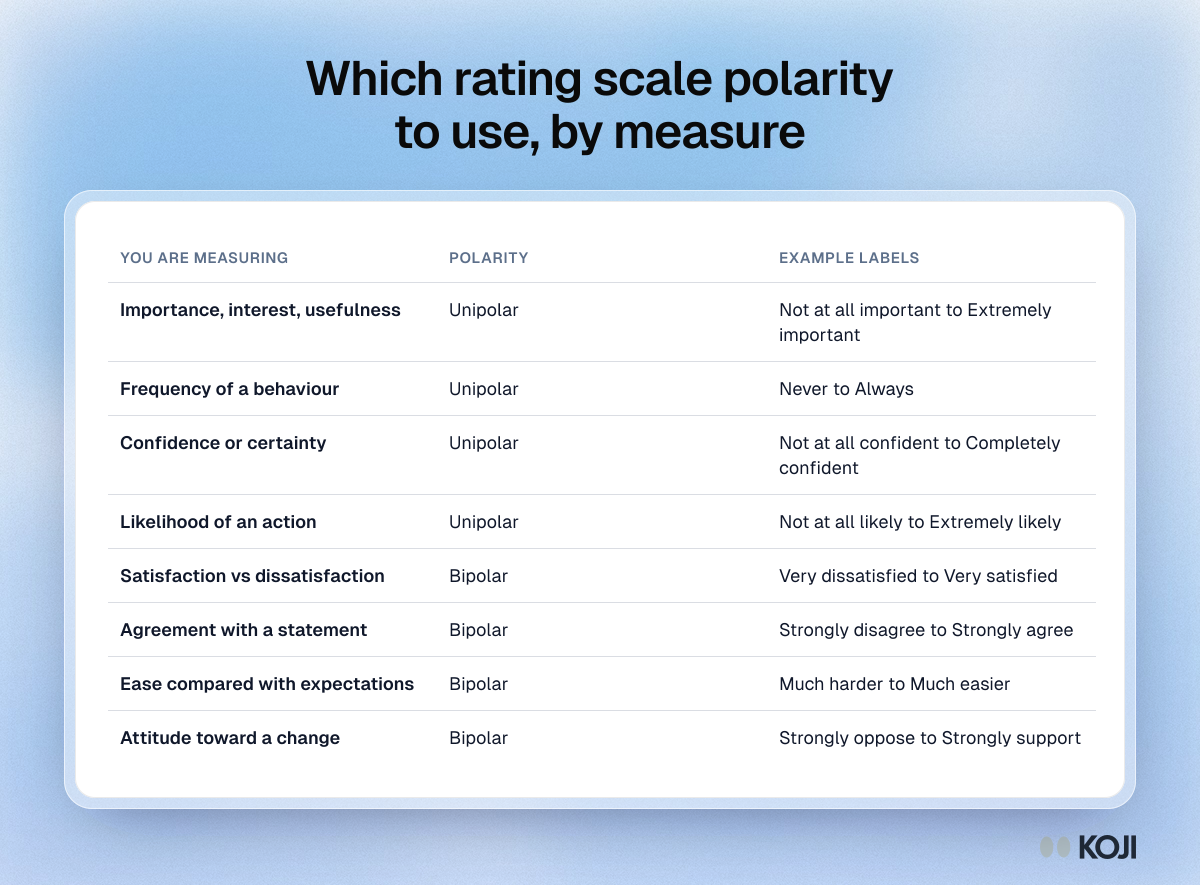
Table of common survey measures and their polarity, from importance and frequency to satisfaction and agreement, with example labels

Reference table

Which rating scale polarity to use, by measure