Free to save and share

Frameworks and cheat sheets for customer research

Every framework, checklist and comparison from our guides, as an image you can download, drop into a deck or share with your team.
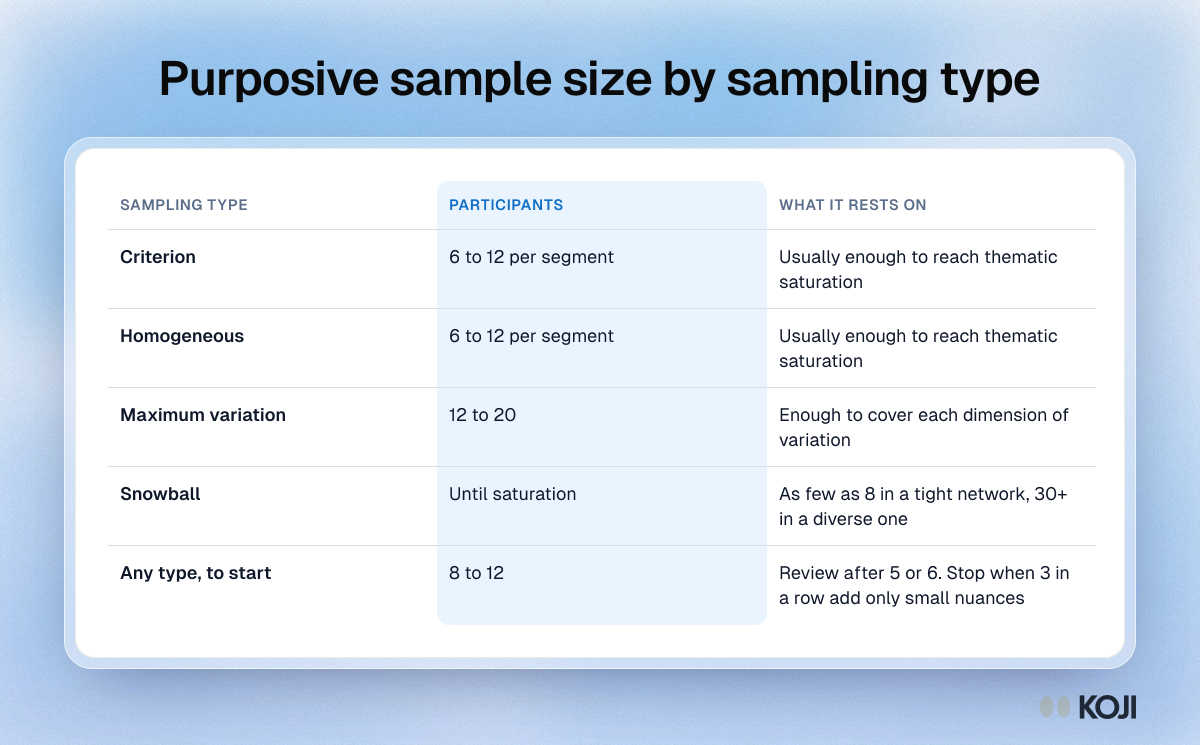
Table of how many participants each type of purposive sampling needs, from 6 to 12 per segment for criterion sampling to 12 to 20 for maximum variation.

Reference table

Purposive sample size by sampling type
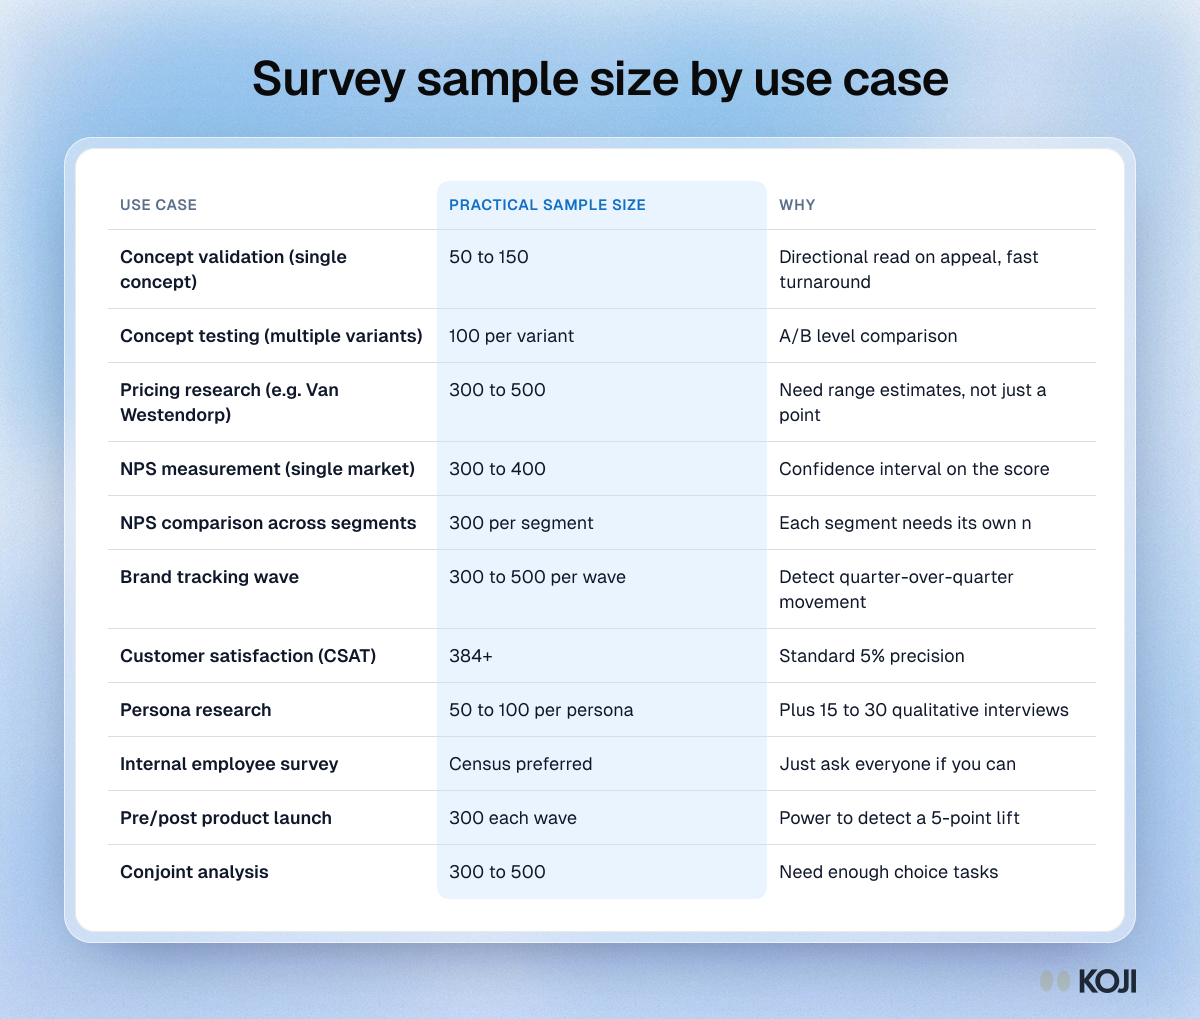
Table of practical survey sample sizes for 11 use cases, from 50 to 150 for one concept to 300 to 500 for pricing and conjoint studies.

Reference table

Survey sample size by use case
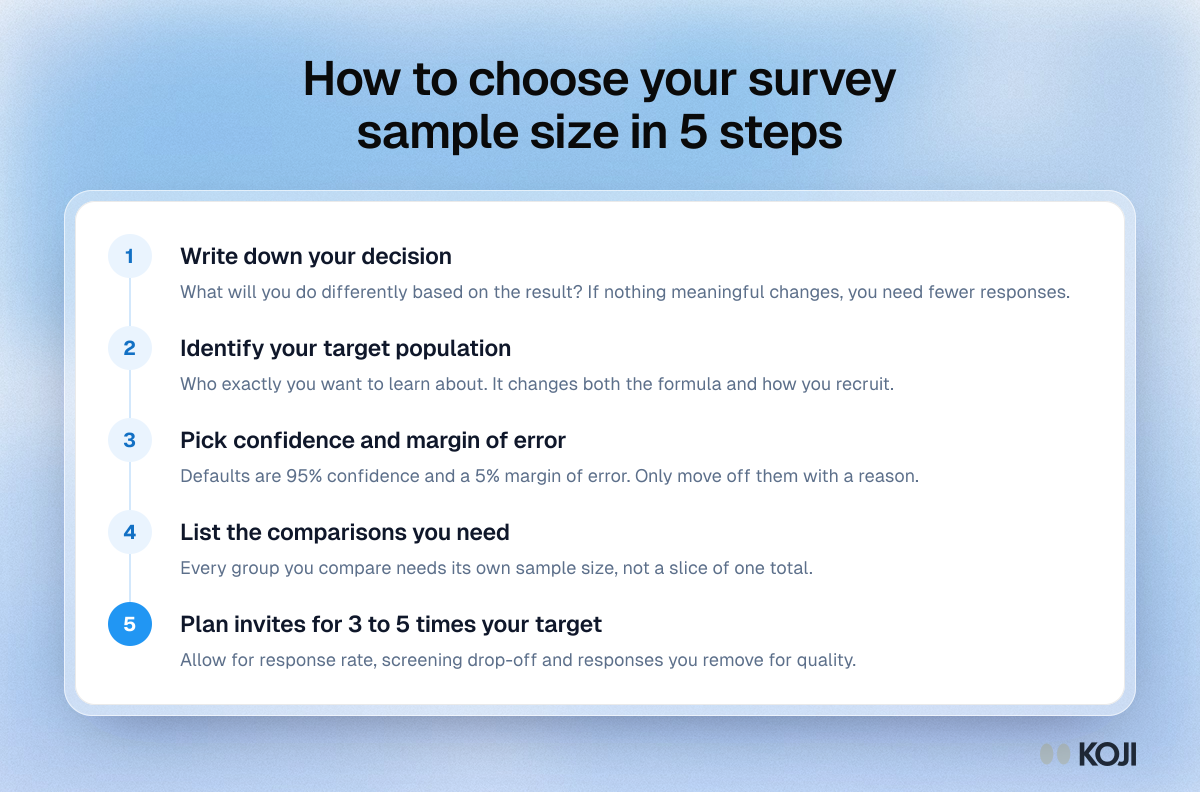
Process in five steps for choosing a survey sample size: name the decision, define the population, set confidence, list comparisons, plan invites.

Process

How to choose your survey sample size in 5 steps
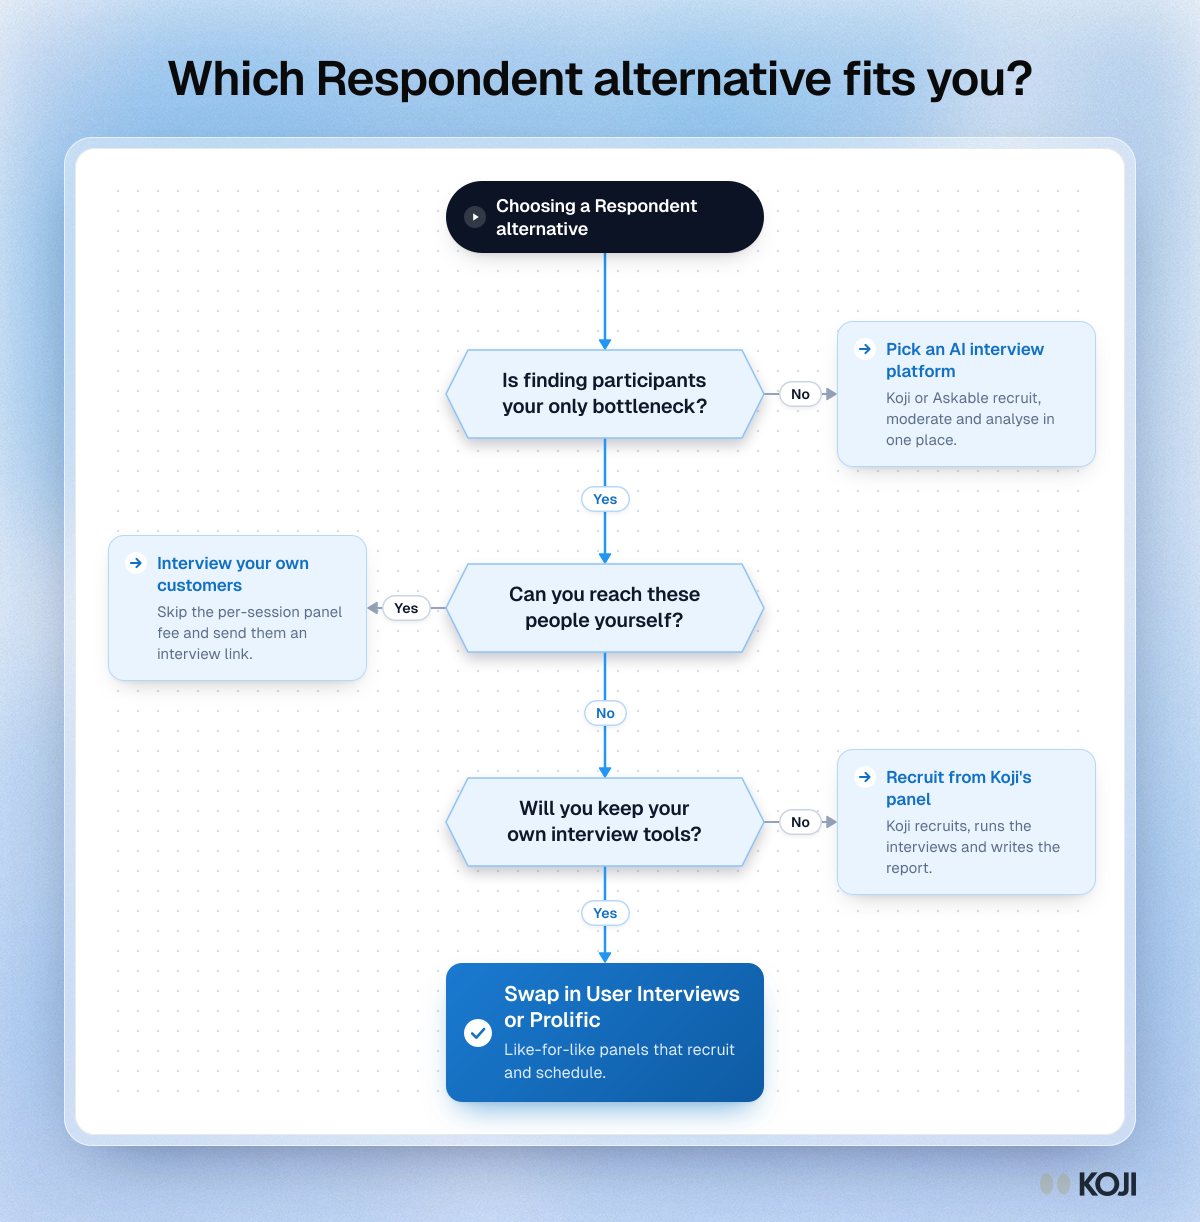
Flowchart for choosing a Respondent alternative: yes/no questions about recruiting, your own audience and keeping your interview tools.

Flowchart

Which Respondent alternative fits you?
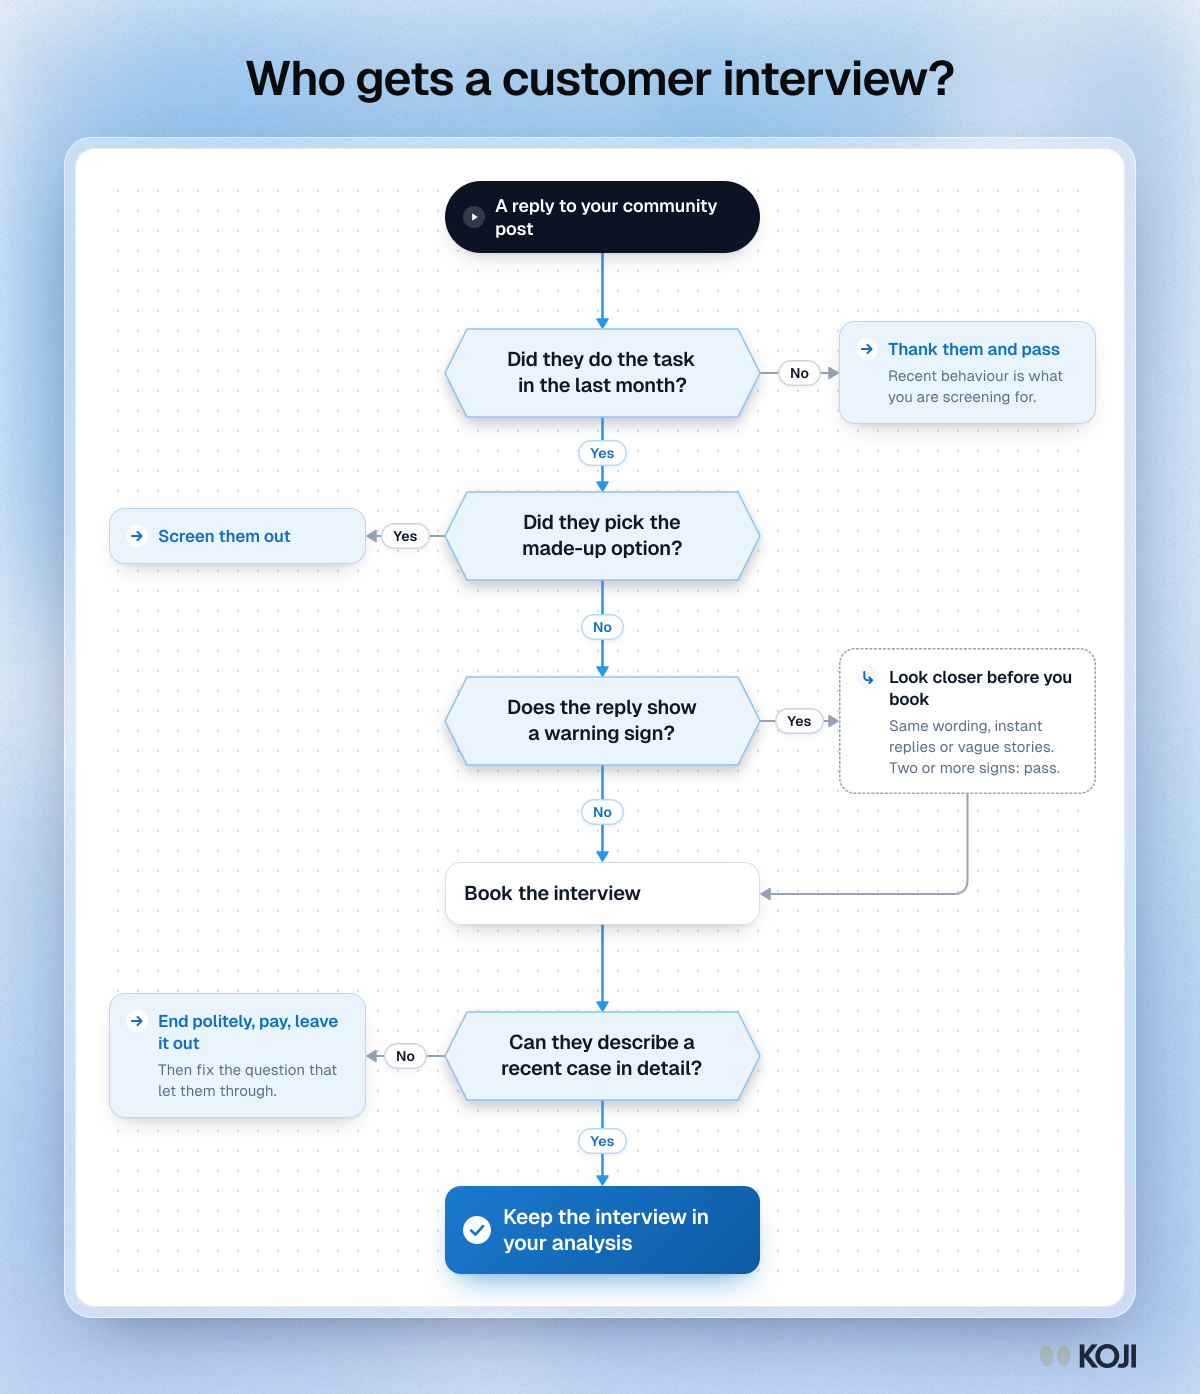
Flowchart for deciding who gets a customer interview: four checks on recency, the foil, warning signs and a recent story.

Flowchart

Who gets a customer interview?
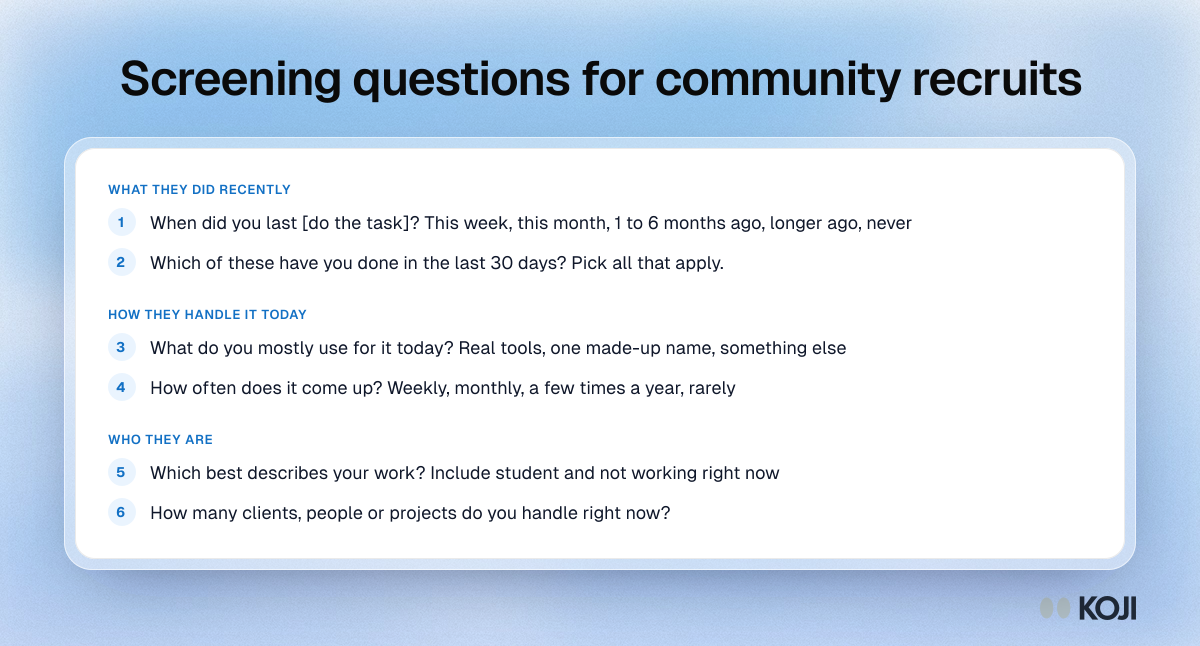
Question bank of screening questions for interview recruits from online communities: what they did recently, how they handle it today, who they are.

Question bank

Screening questions for community recruits
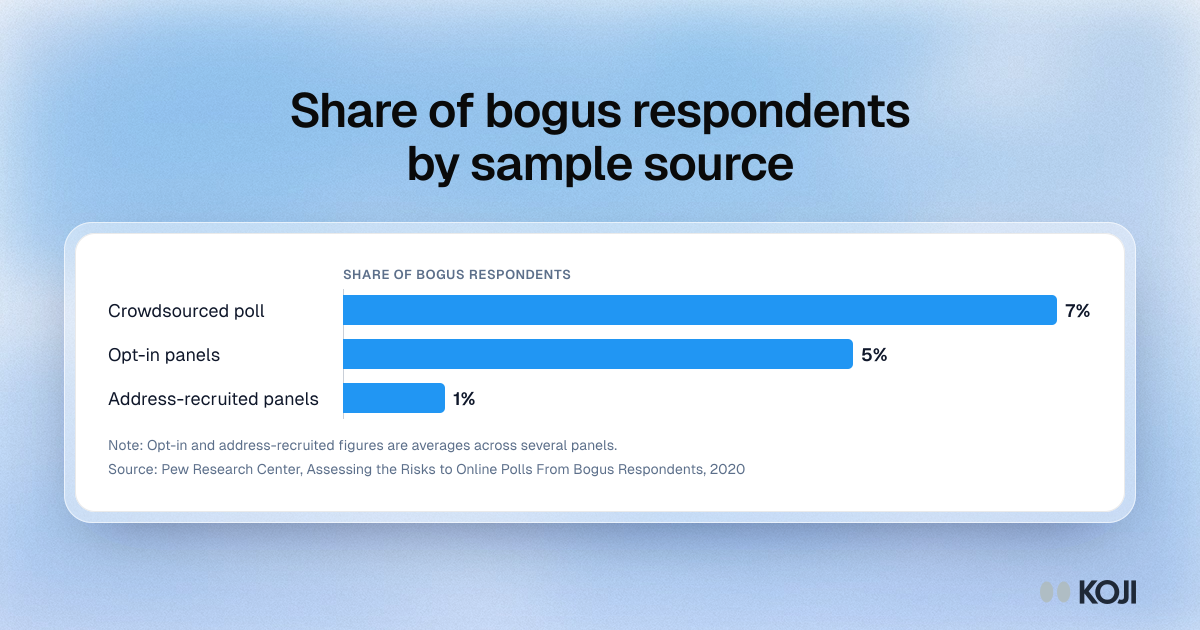
Bar chart of bogus respondents by sample source in Pew's 2020 study: 7% in a crowdsourced poll, 5% in opt-in panels, 1% in address-recruited panels.

Bar chart

Share of bogus respondents by sample source
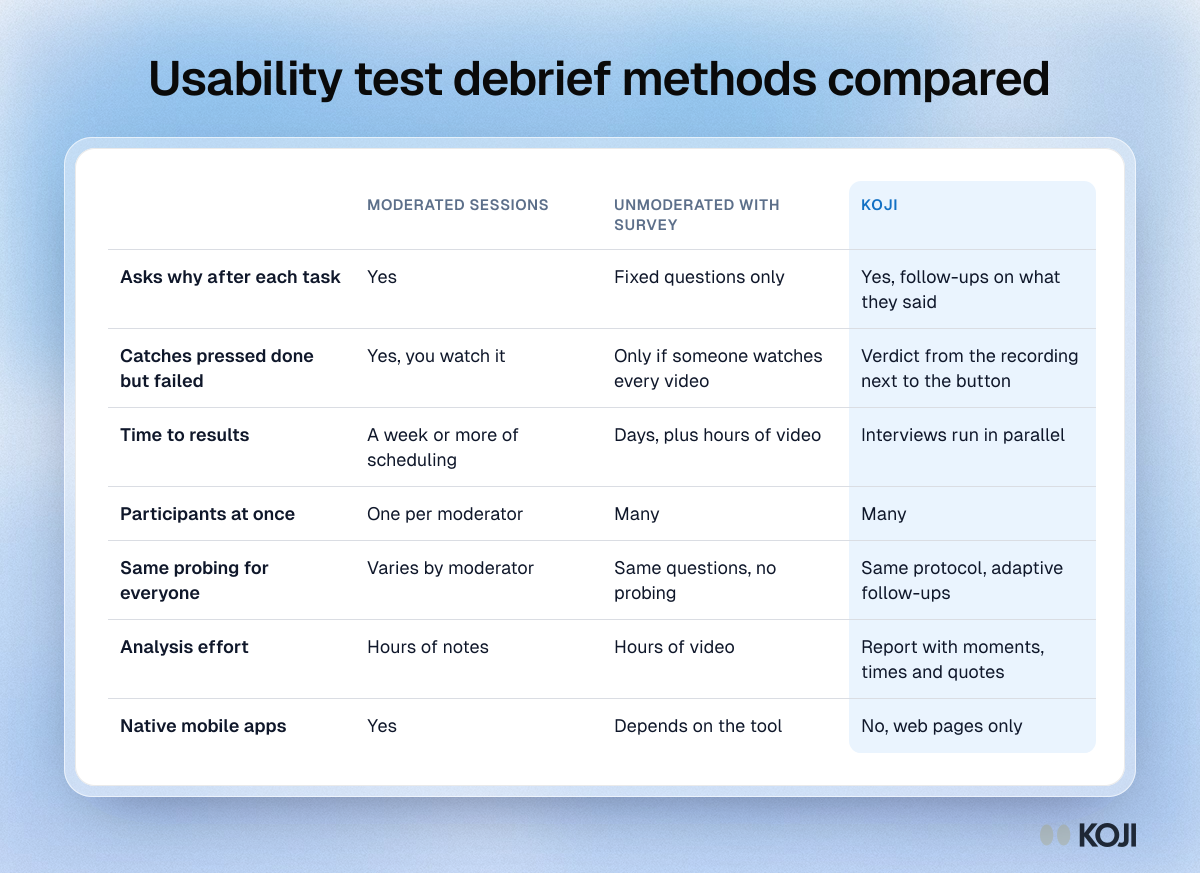
Comparison table of three ways to run a usability test debrief, Koji highlighted, on follow-ups, catching false successes, speed and analysis effort.

Reference table

Usability test debrief methods compared
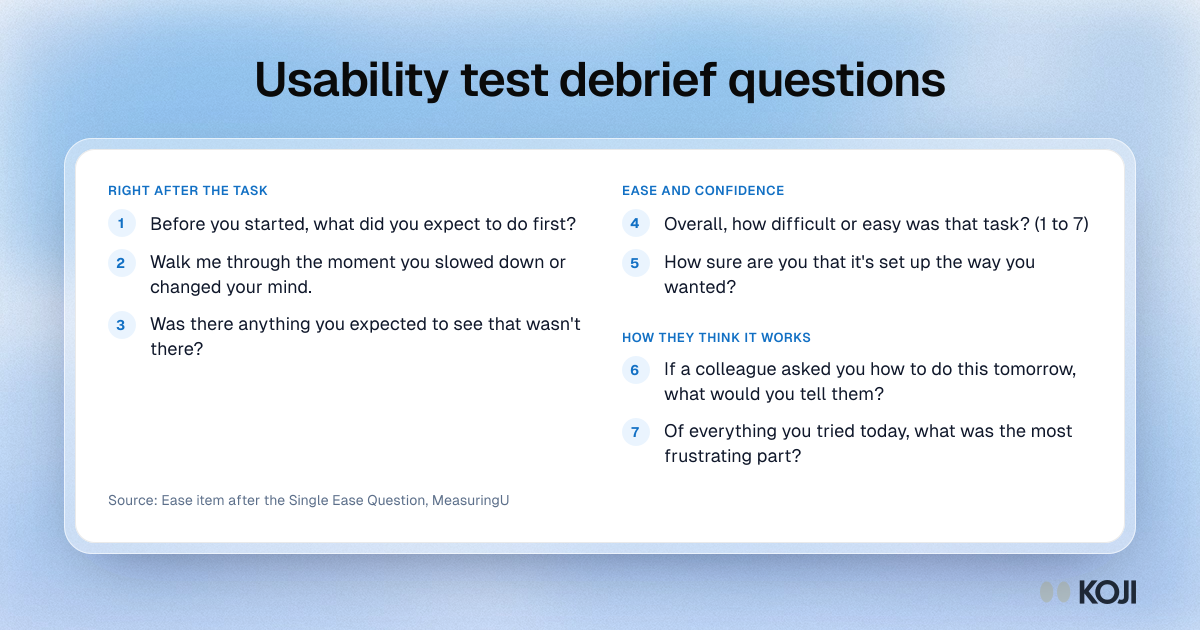
Question bank of seven usability test debrief questions in three sections: right after the task, ease and confidence, how they think it works.

Question bank

Usability test debrief questions
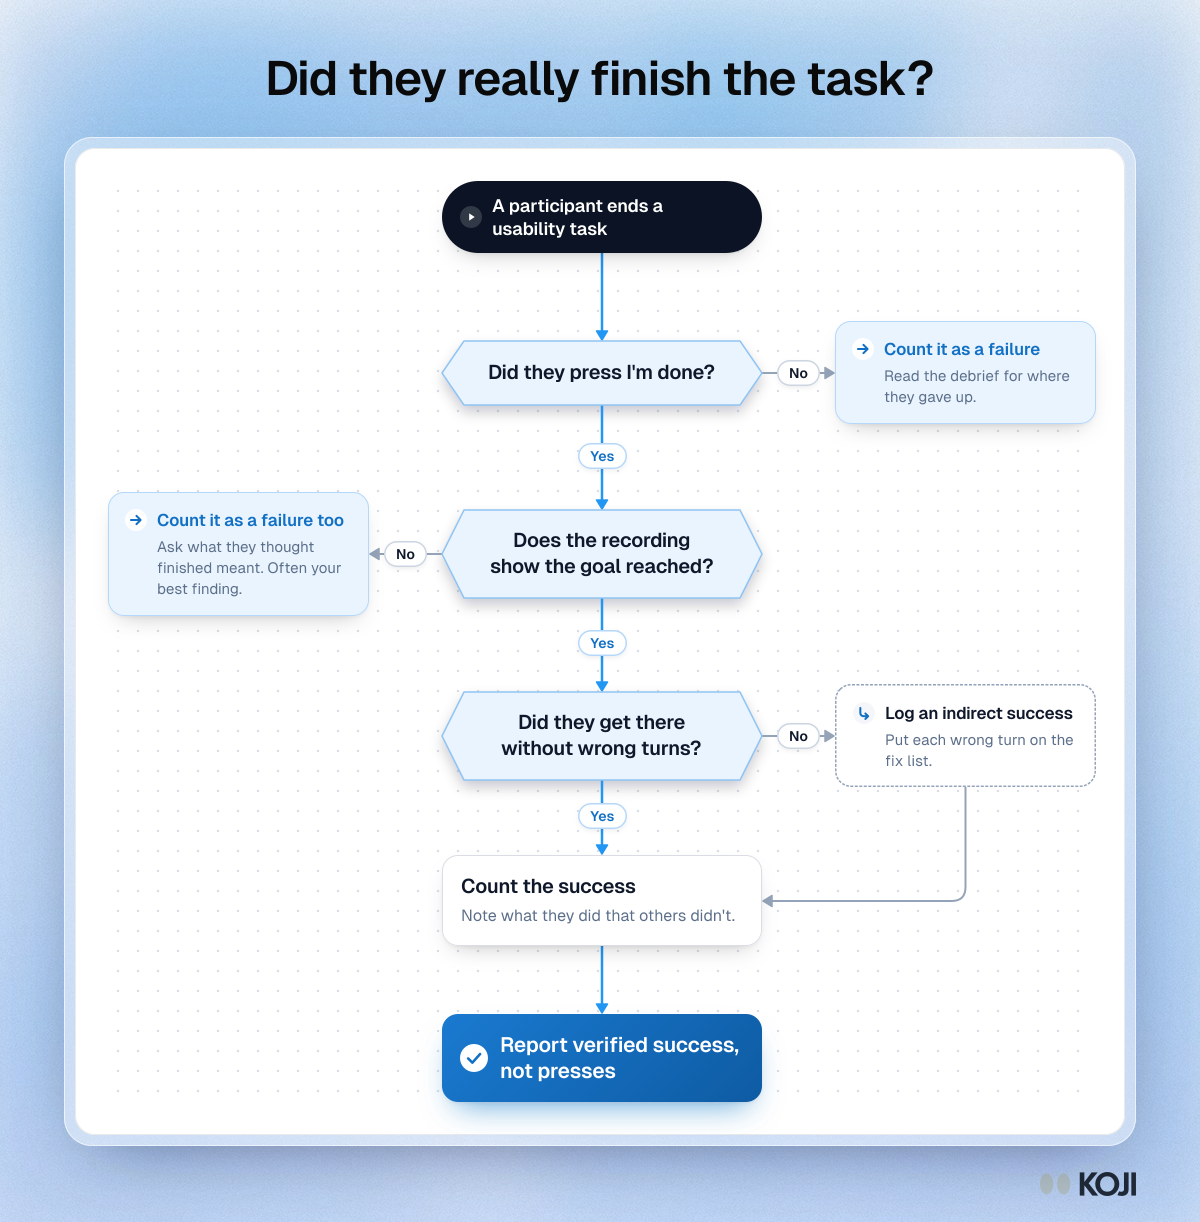
Flowchart for counting usability task success: did they press done, does the recording show the goal reached, and were there wrong turns.

Flowchart

Did they really finish the task?
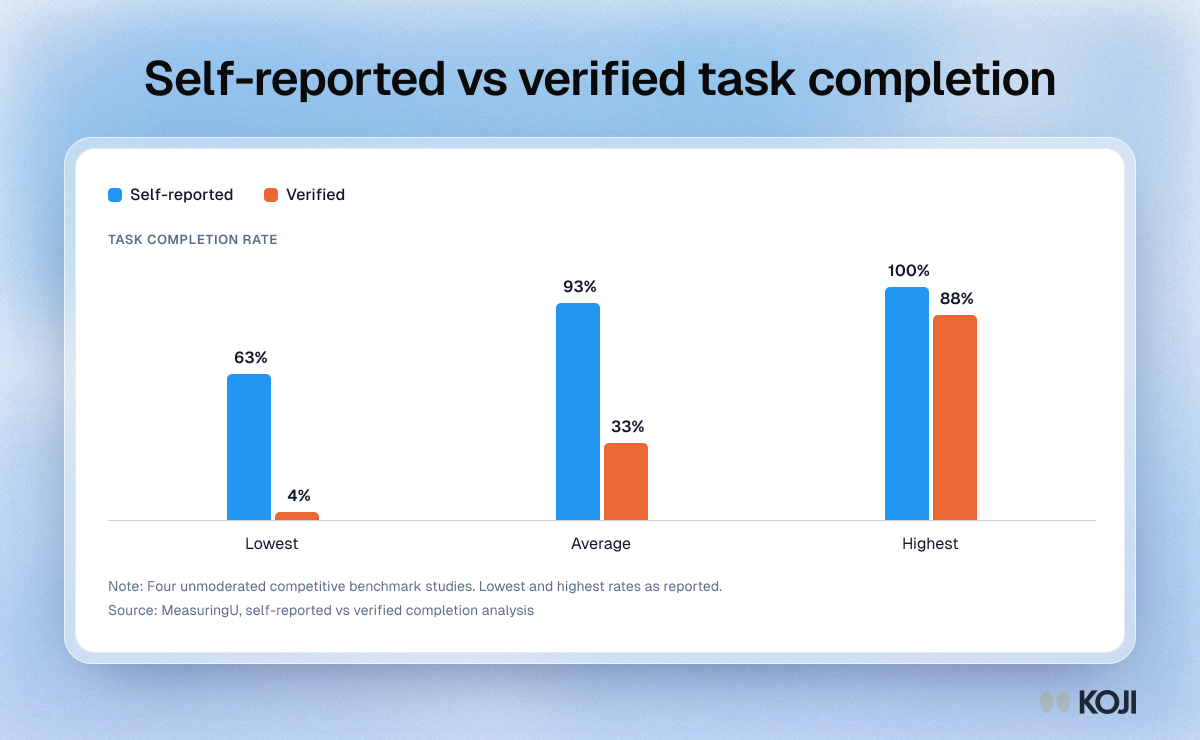
Column chart of self-reported vs verified task completion in four unmoderated studies: average 93% said, 33% verified, lowest 63% vs 4%.
Column chart

Self-reported vs verified task completion

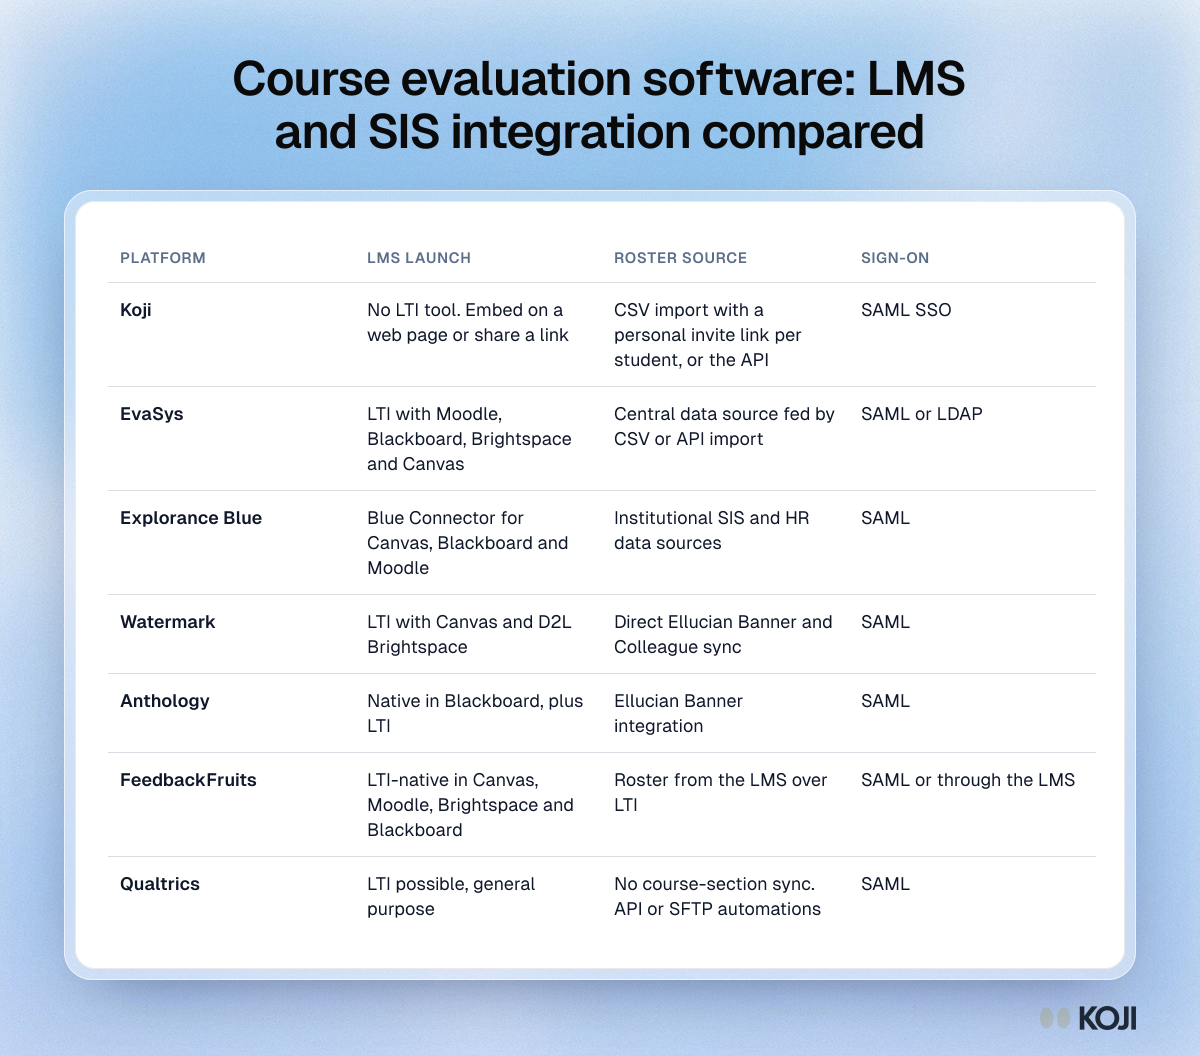
Table comparing how seven course evaluation tools reach students in the LMS, where their roster comes from and how users sign in.

Reference table

Course evaluation software: LMS and SIS integration compared
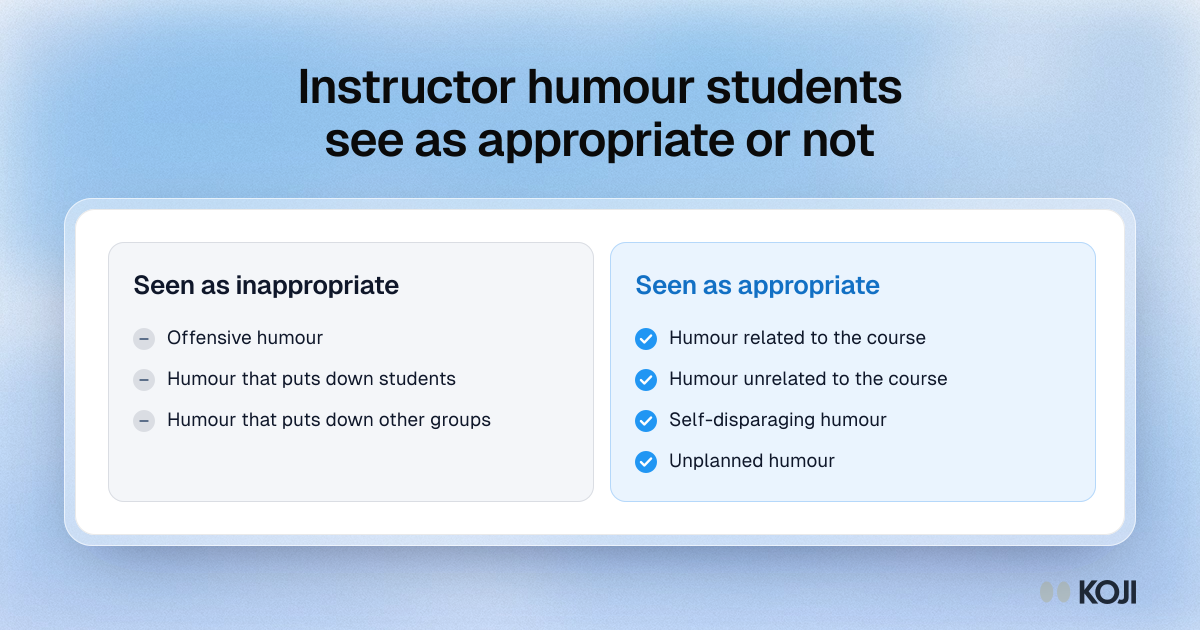
Comparison of teacher humour students see as inappropriate, such as offensive or disparaging jokes, and appropriate, such as course-related or unplanned humour.

Comparison

Instructor humour students see as appropriate or not
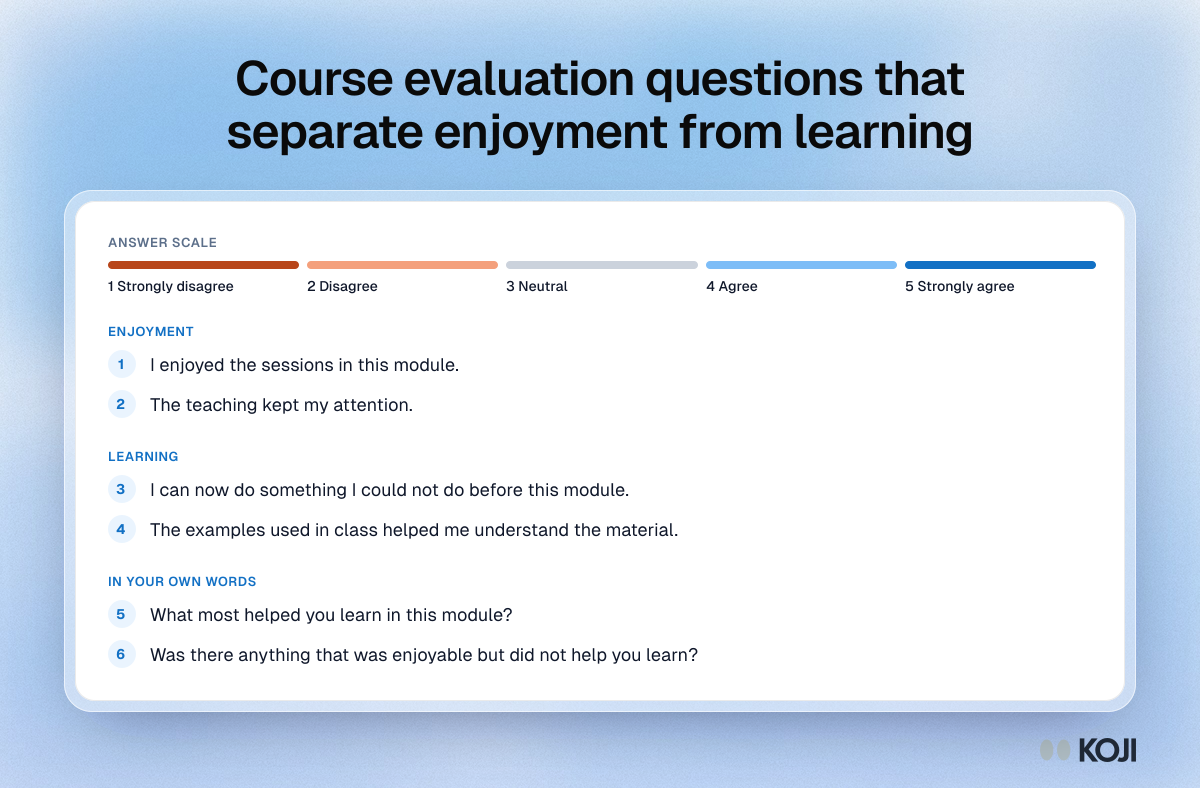
Question bank for separating enjoyment from learning in course evaluations, with rated items on enjoyment and learning and open questions on what helped.

Question bank

Course evaluation questions that separate enjoyment from learning
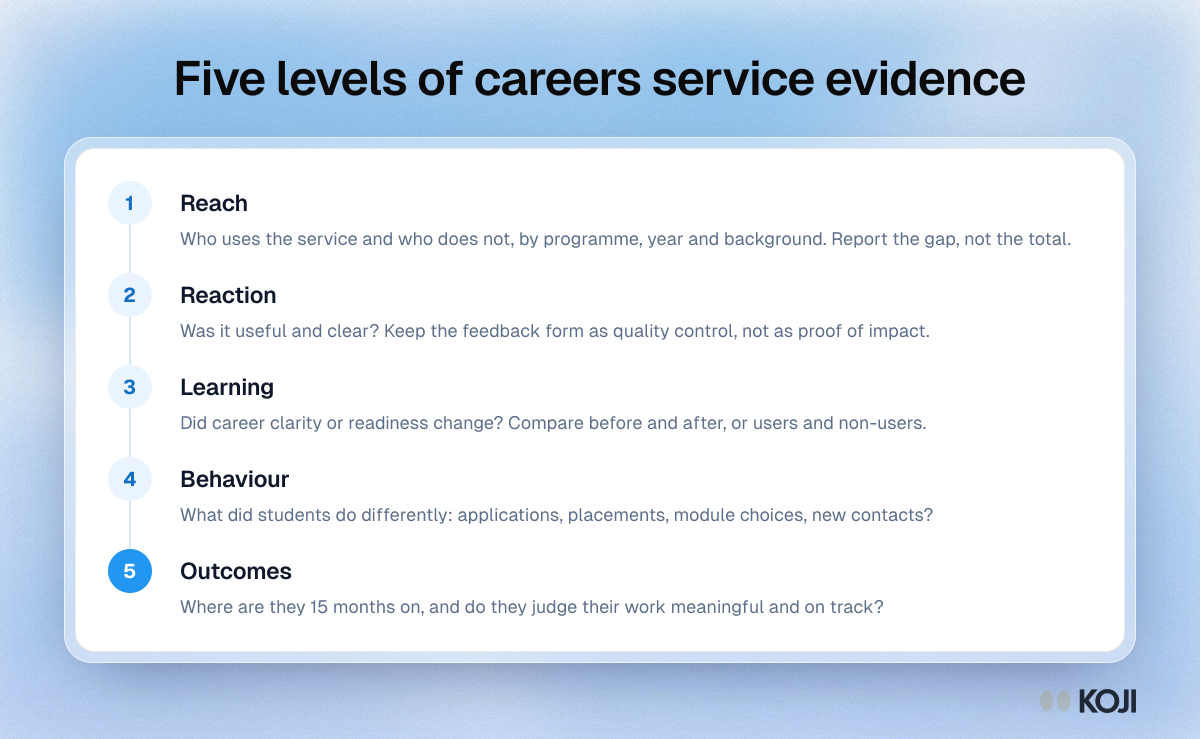
Process showing five levels of careers service evidence: reach, reaction, learning, behaviour and outcomes, each with what to measure.

Process

Five levels of careers service evidence
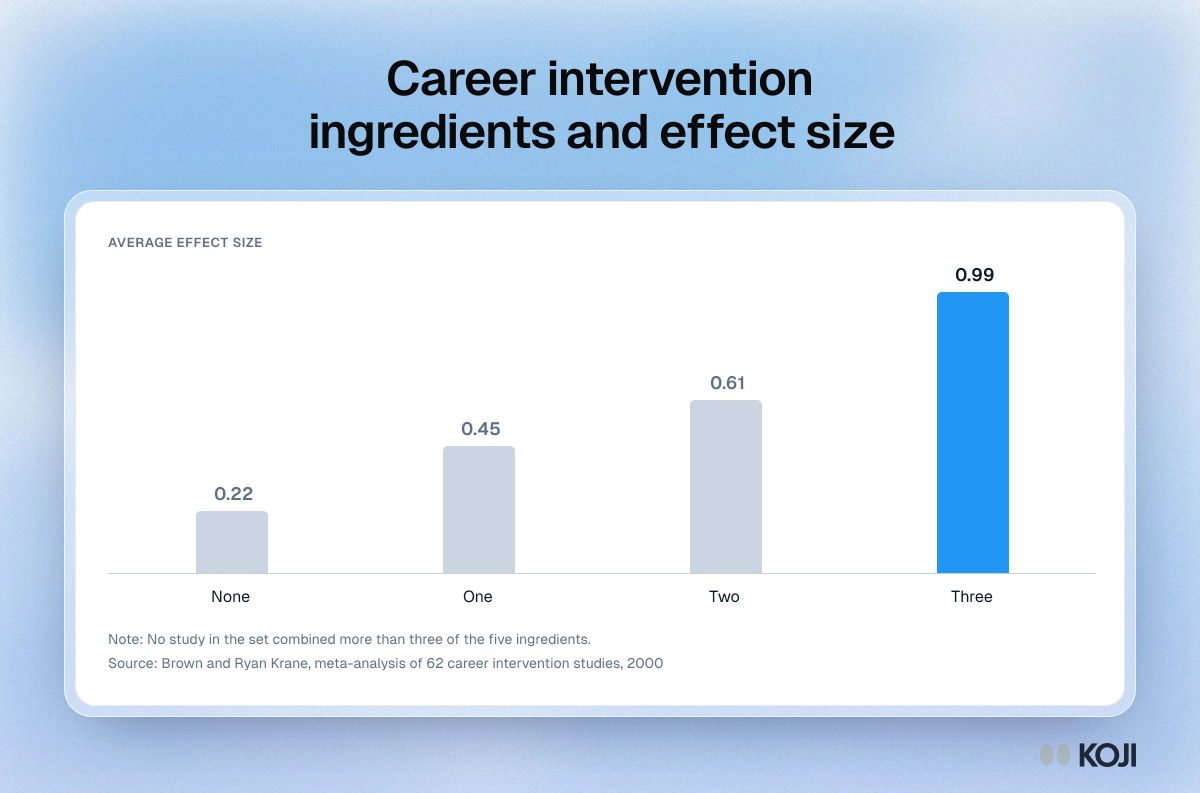
Column chart of average effect size by number of critical ingredients in a career intervention: 0.22 with none, 0.45 with one, 0.61 with two, 0.99 with three.

Column chart

Career intervention ingredients and effect size
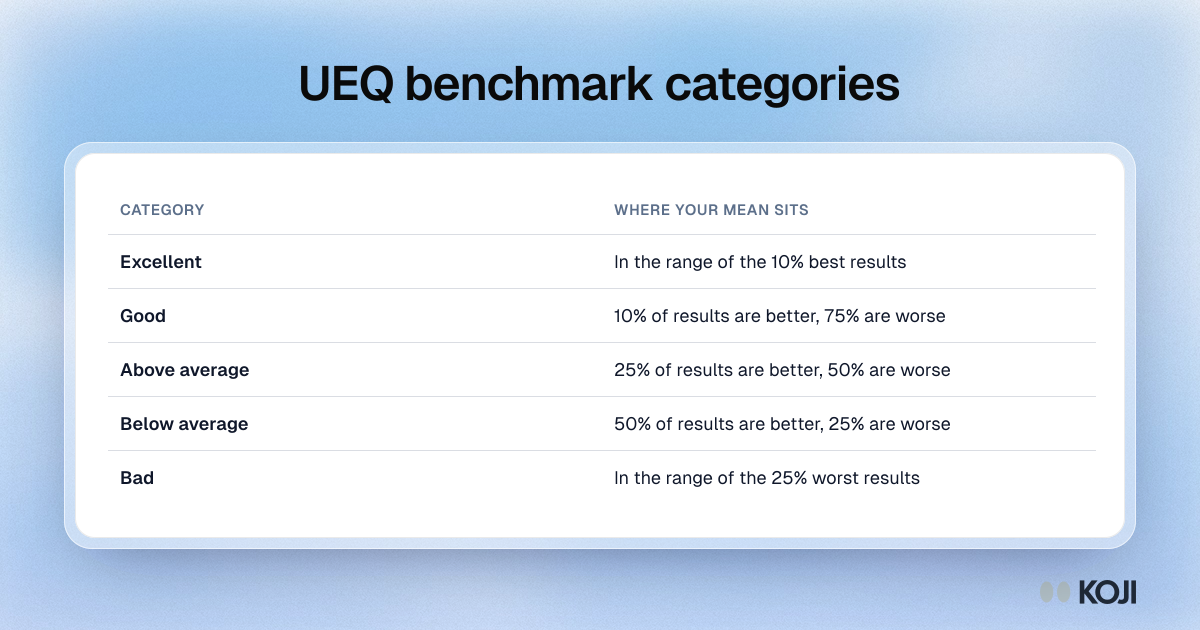
Table of the five UEQ benchmark categories, from excellent for the top 10% of results to bad for the bottom 25%.

Reference table

UEQ benchmark categories
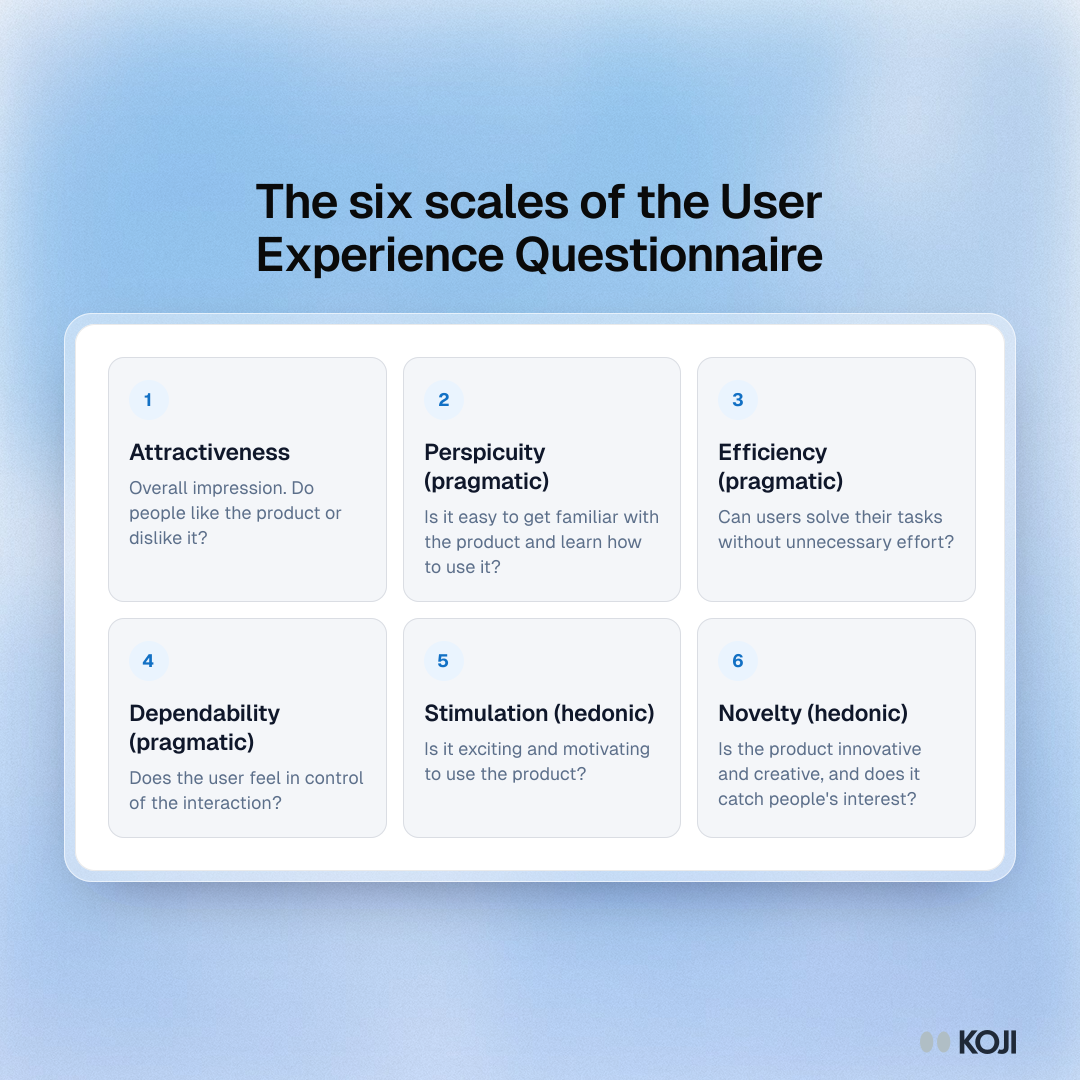
Framework of the six UEQ scales: attractiveness, three pragmatic scales (perspicuity, efficiency, dependability) and two hedonic (stimulation, novelty).

Framework

The six scales of the User Experience Questionnaire
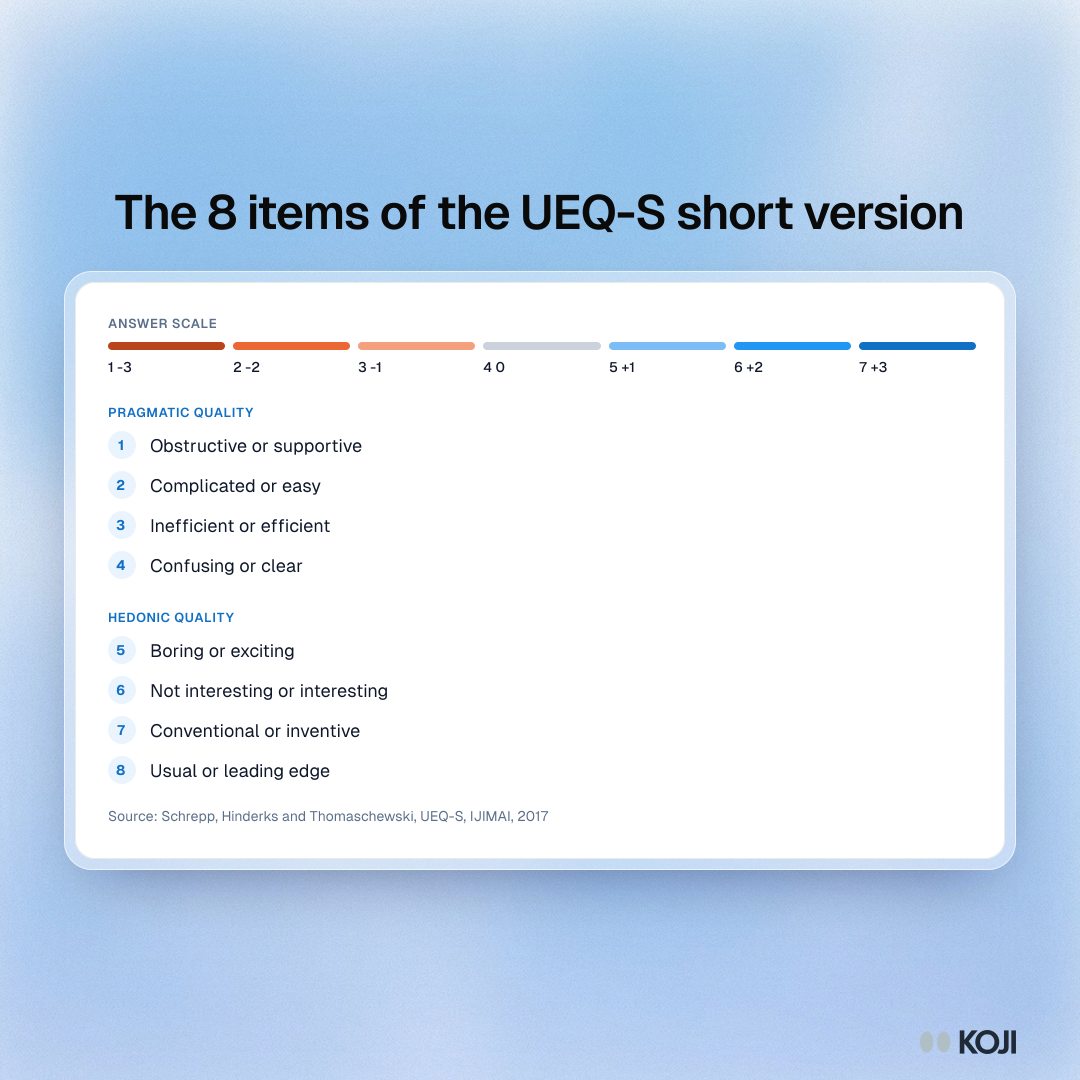
Question bank of the eight UEQ-S word pairs, four for pragmatic quality and four for hedonic quality, rated on a 7-point scale from -3 to +3.

Question bank

The 8 items of the UEQ-S short version
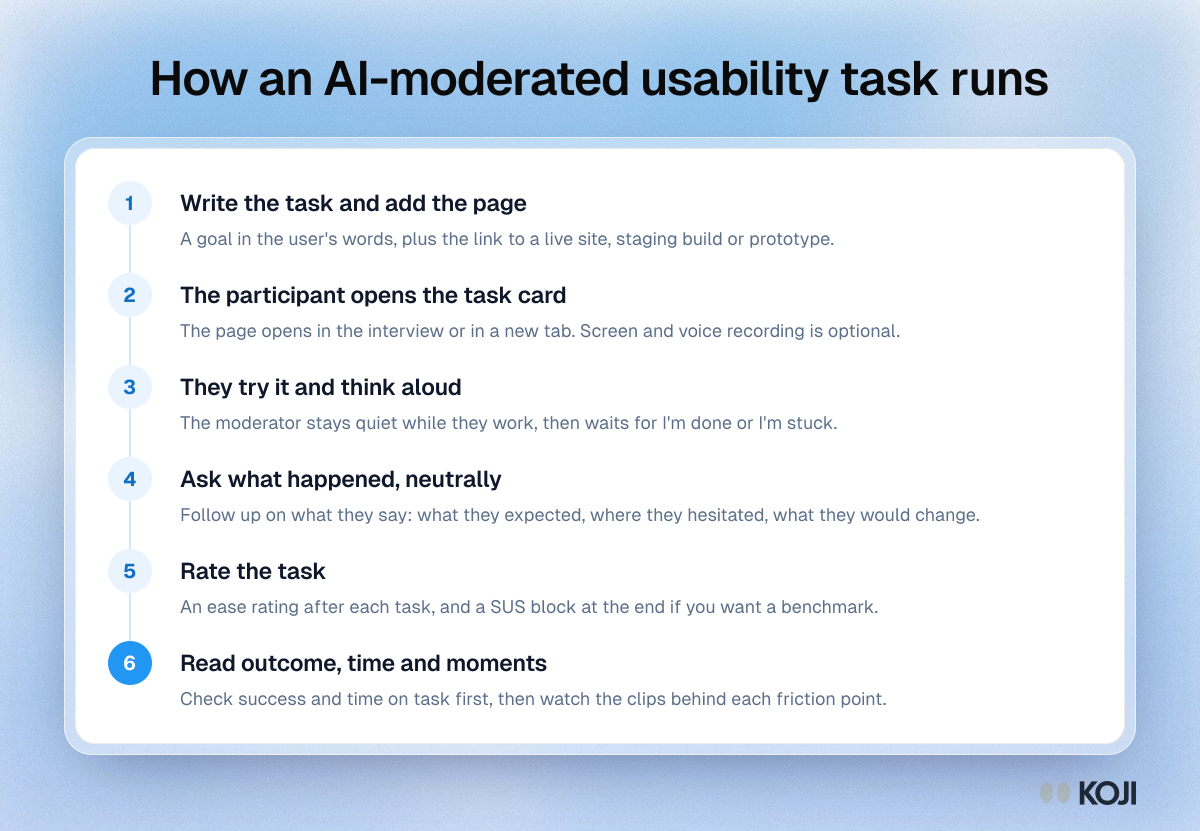
Process diagram of an AI-moderated usability task in six steps, from writing the task and page link to reading outcome, time on task and recorded moments.

Process

How an AI-moderated usability task runs
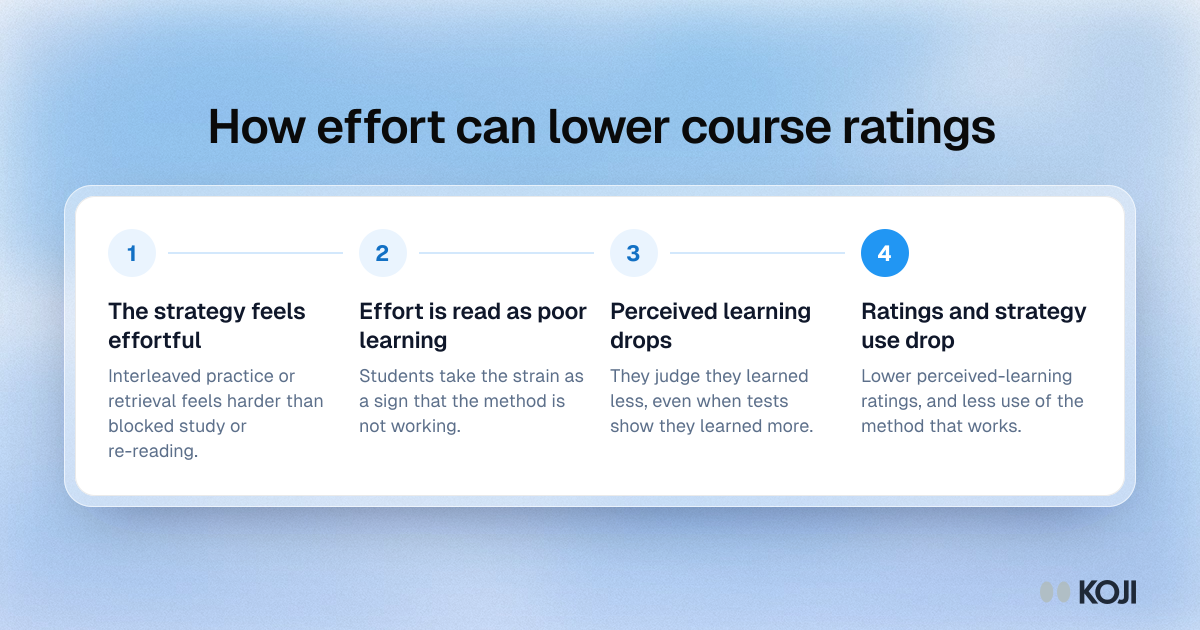
Process showing how effort can lower a course rating: the strategy feels effortful, effort reads as poor learning, perceived learning and ratings drop.

Process

How effort can lower course ratings
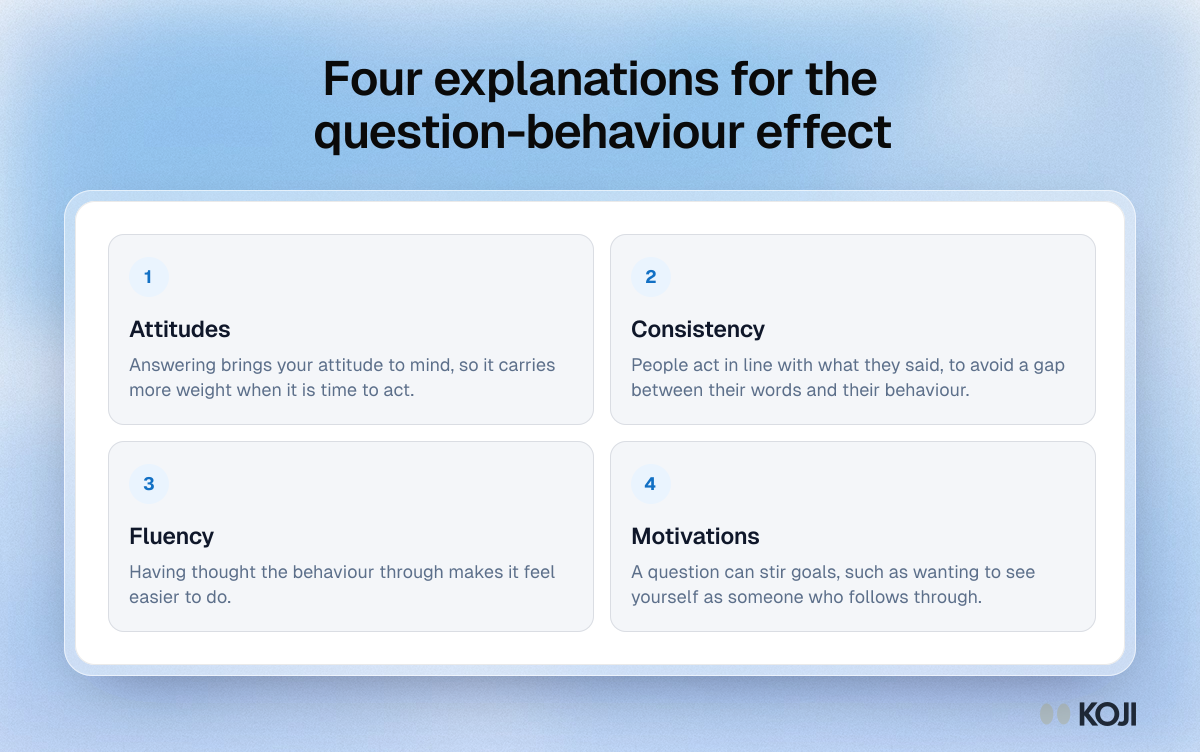
Framework of four explanations for the question-behaviour effect: attitudes, consistency, fluency and motivations, after Spangenberg et al. 2016.

Framework

Four explanations for the question-behaviour effect
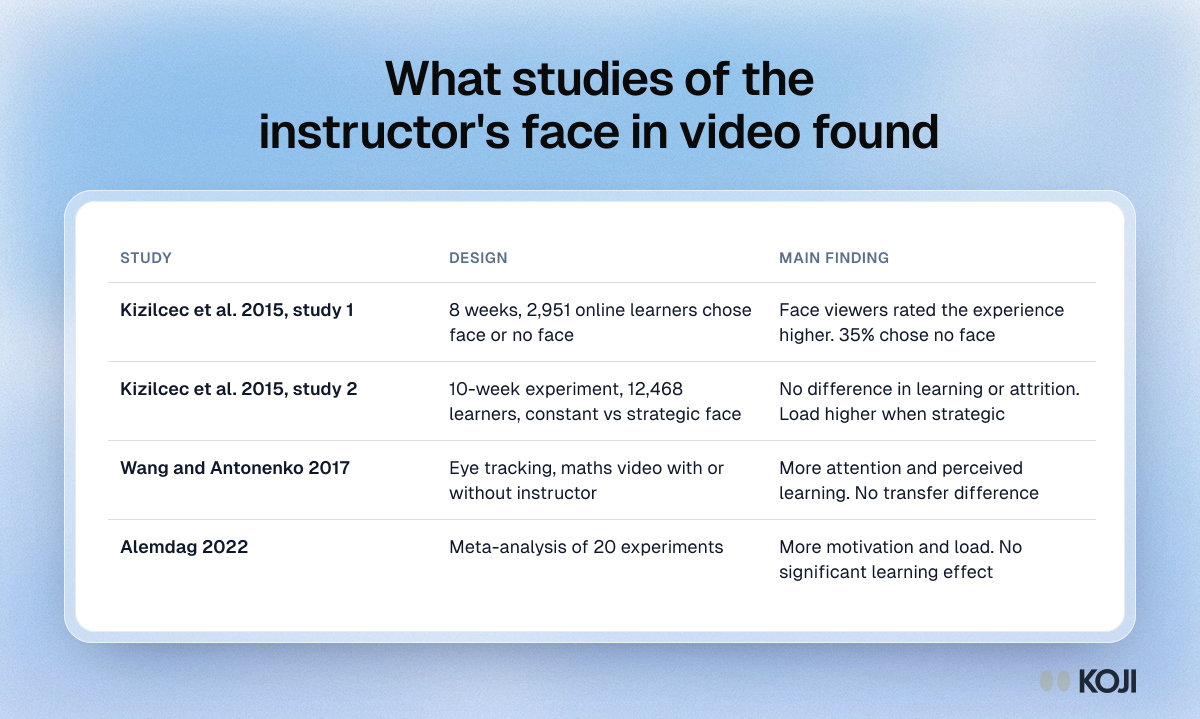
Table of four studies on the instructor's face in video lectures, with design and main finding: Kizilcec 2015, Wang and Antonenko 2017, Alemdag 2022.

Reference table

What studies of the instructor's face in video found
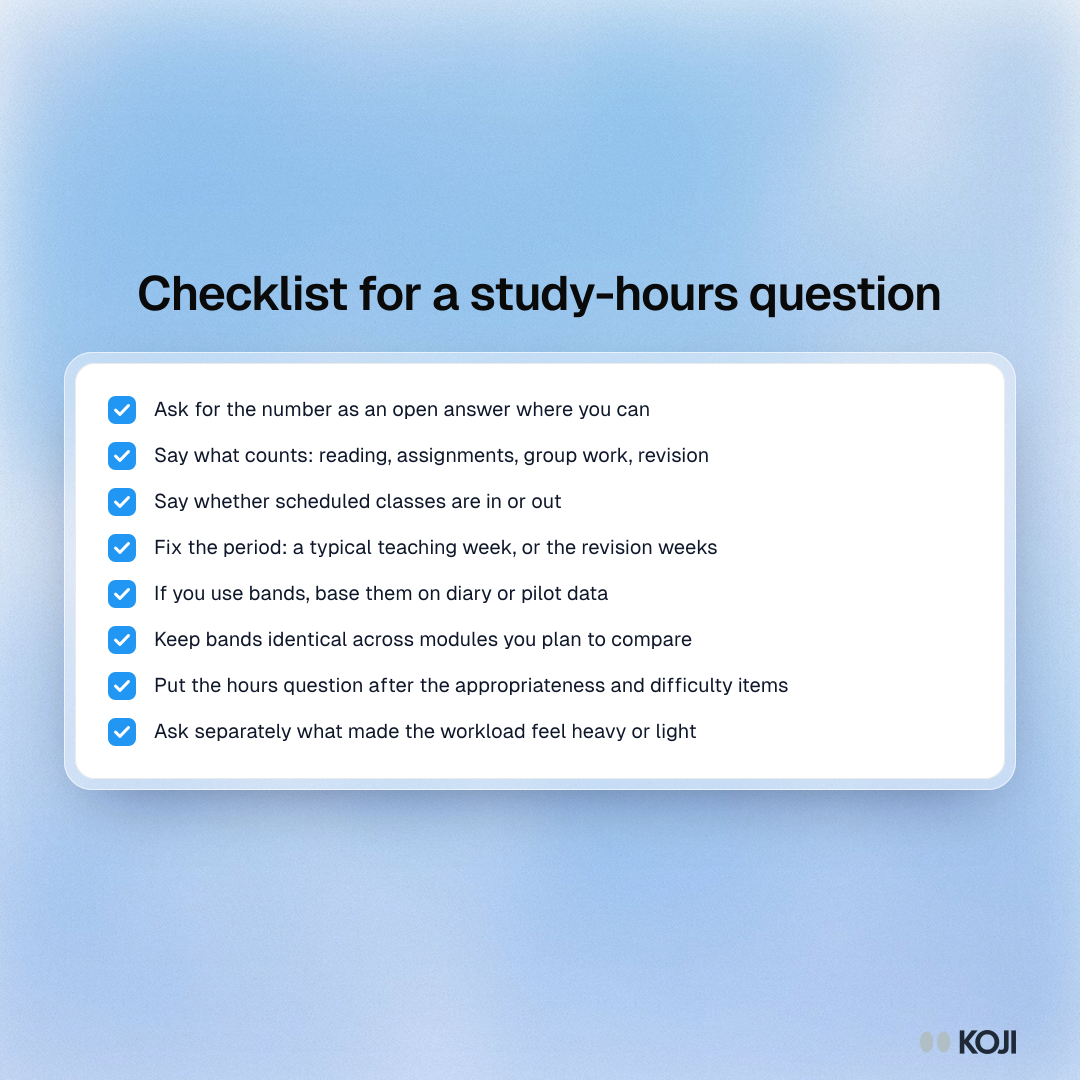
Checklist for a study-hours question in a course evaluation: eight checks on answer ranges, what counts as study time and the reference period.

Checklist

Checklist for a study-hours question
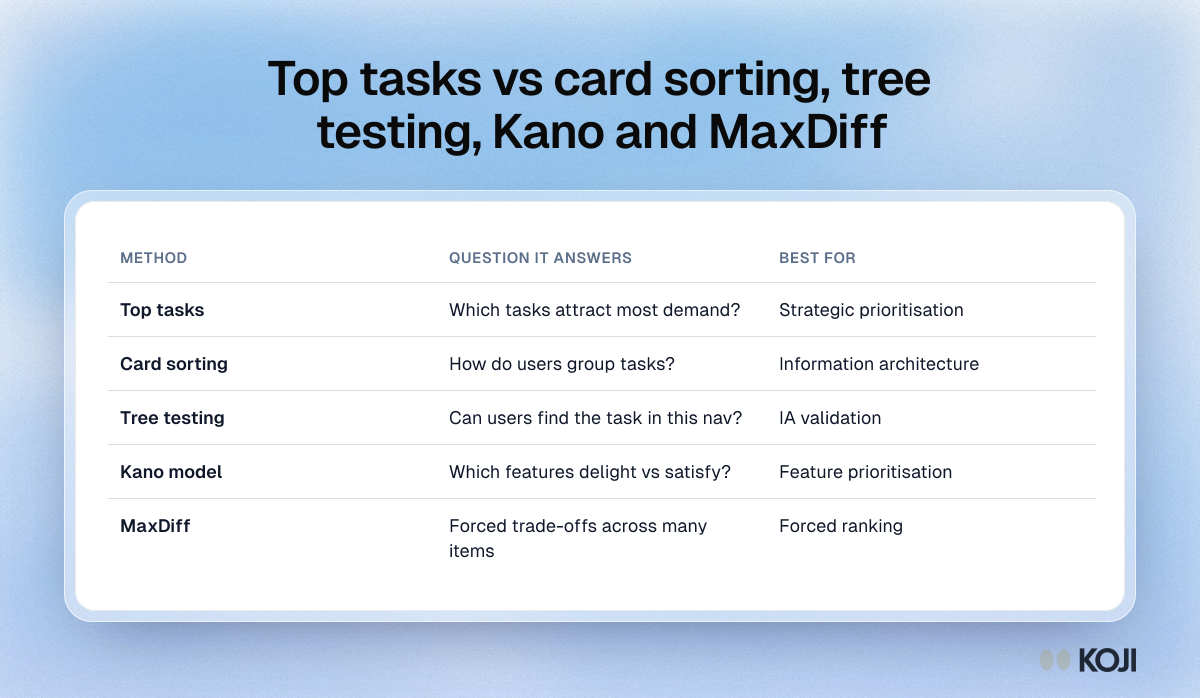
Table comparing top tasks, card sorting, tree testing, the Kano model and MaxDiff by the question each answers and what each is best for.

Reference table

Top tasks vs card sorting, tree testing, Kano and MaxDiff
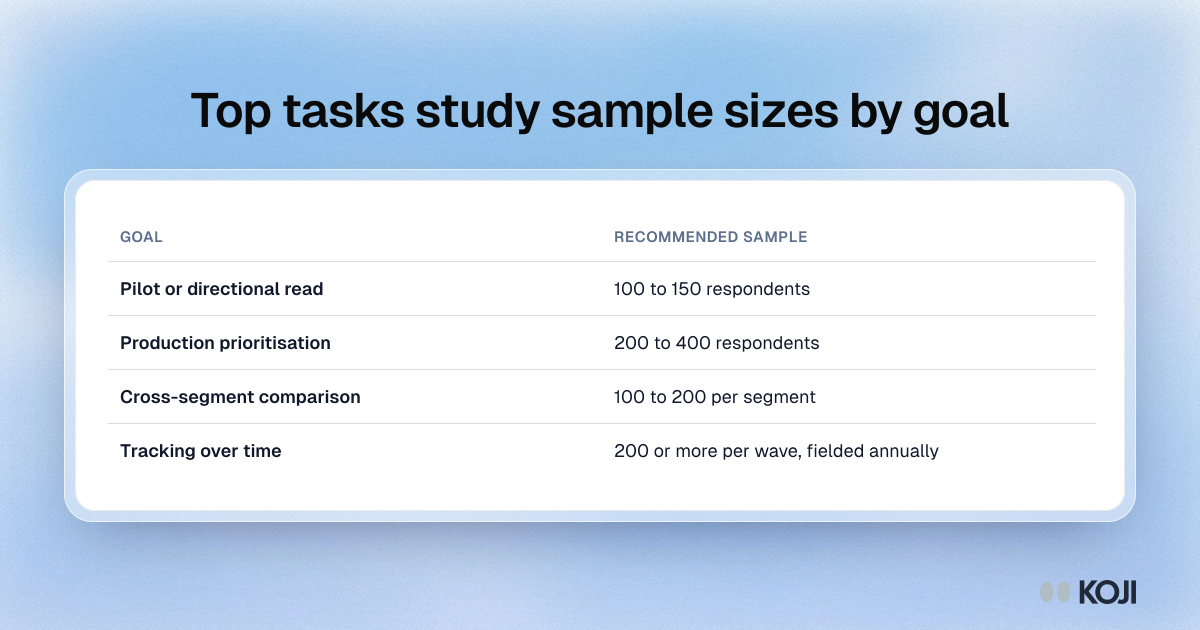
Table of recommended top tasks sample sizes: 100 to 150 for a pilot, 200 to 400 for prioritisation, 100 to 200 per segment, and 200 or more per yearly wave.

Reference table

Top tasks study sample sizes by goal
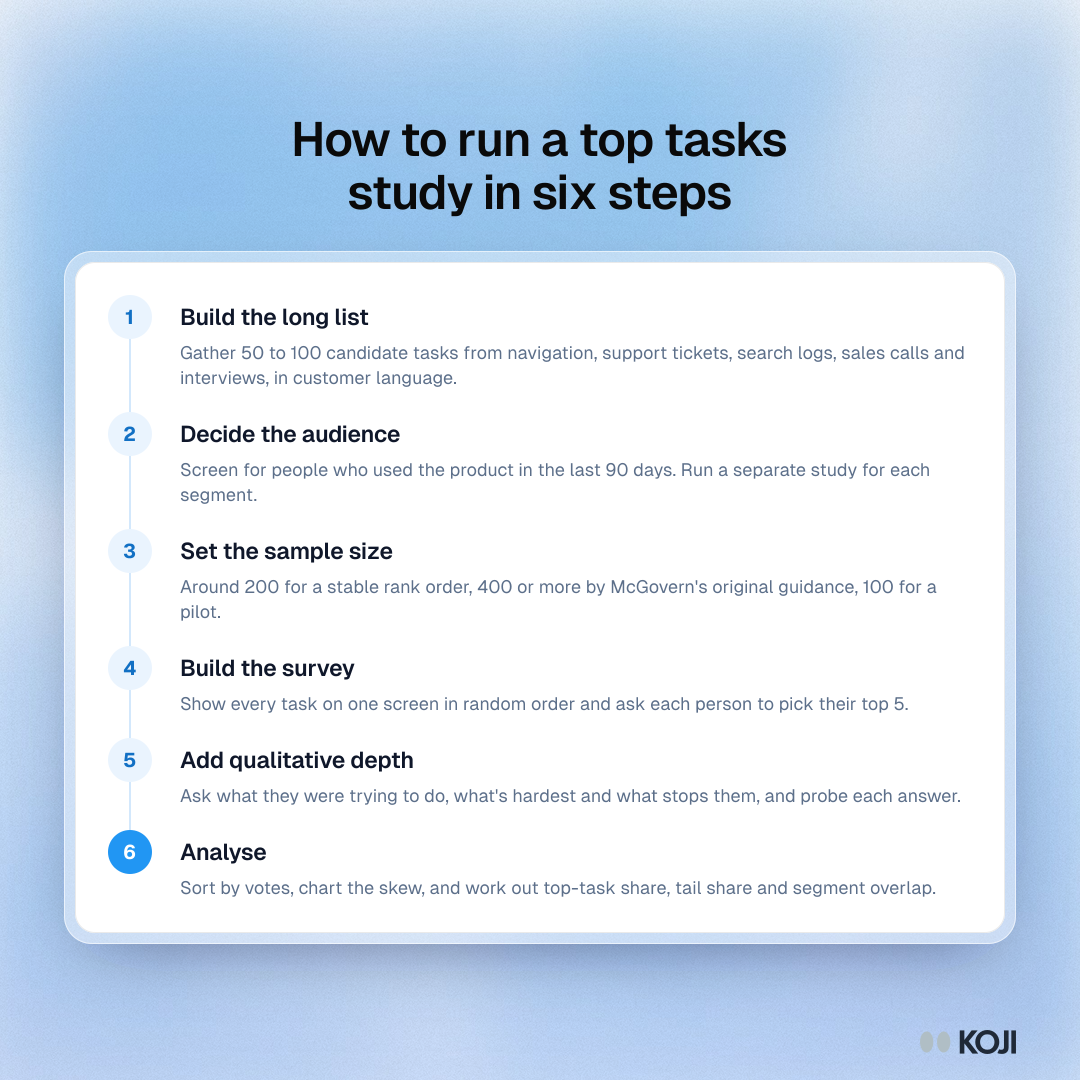
Process showing six steps of a top tasks study: build the long list, pick the audience, set the sample, build the survey, add follow-ups, analyse the votes.

Process

How to run a top tasks study in six steps
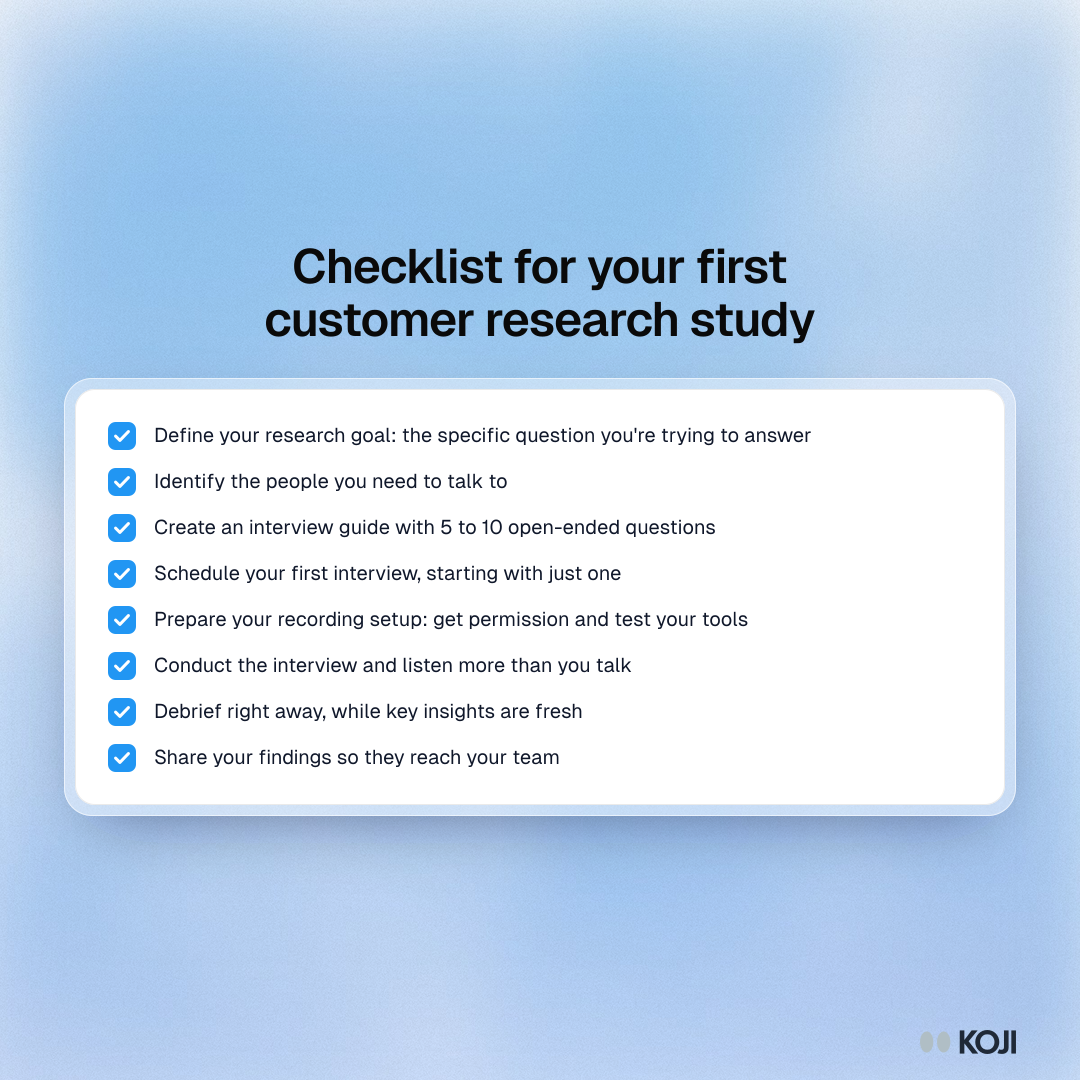
Checklist of eight steps for a first customer research study, from defining the goal and writing a guide to recording, debriefing and sharing findings.

Checklist

Checklist for your first customer research study
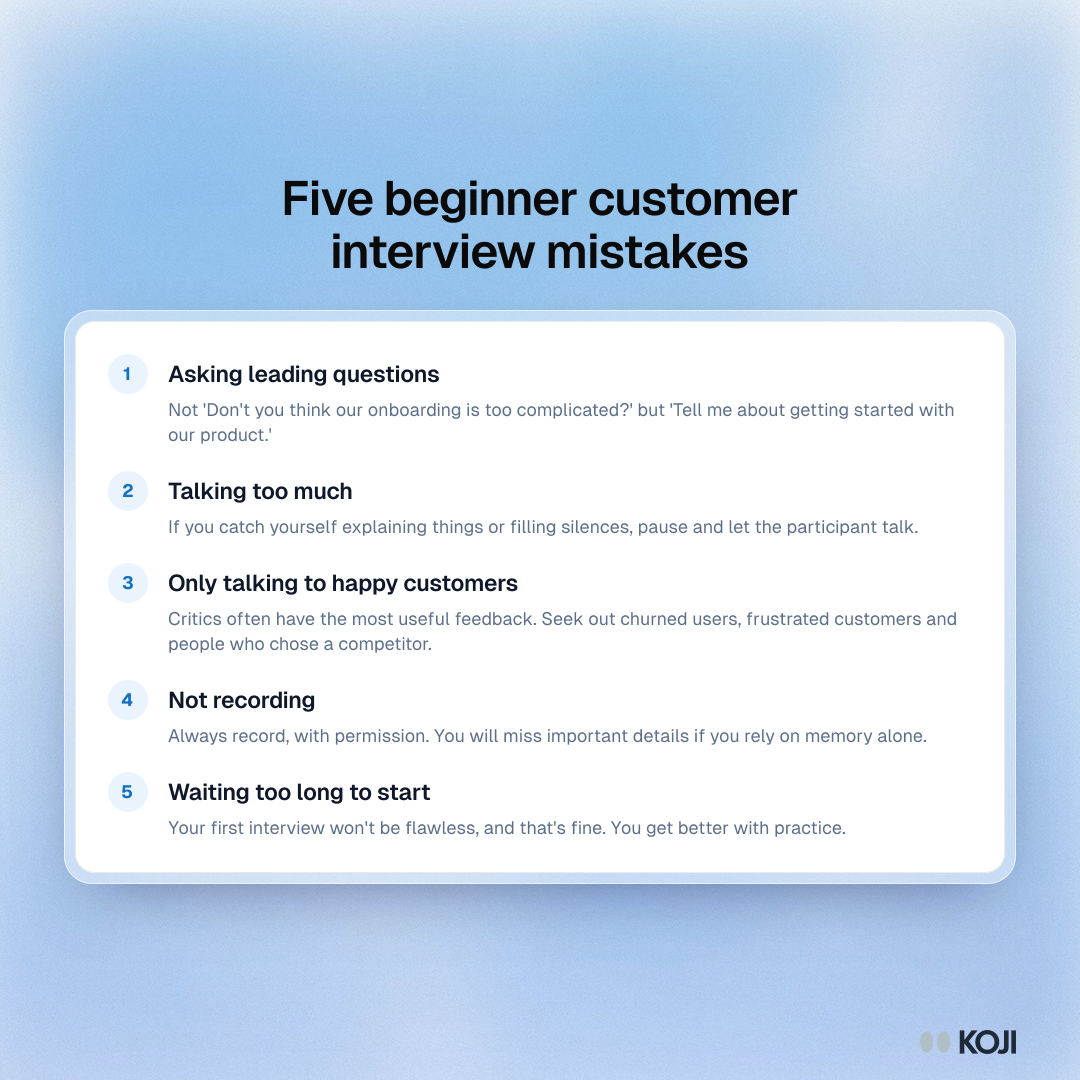
List of five beginner customer interview mistakes: leading questions, talking too much, only happy customers, not recording and waiting too long to start.

Guide

Five beginner customer interview mistakes
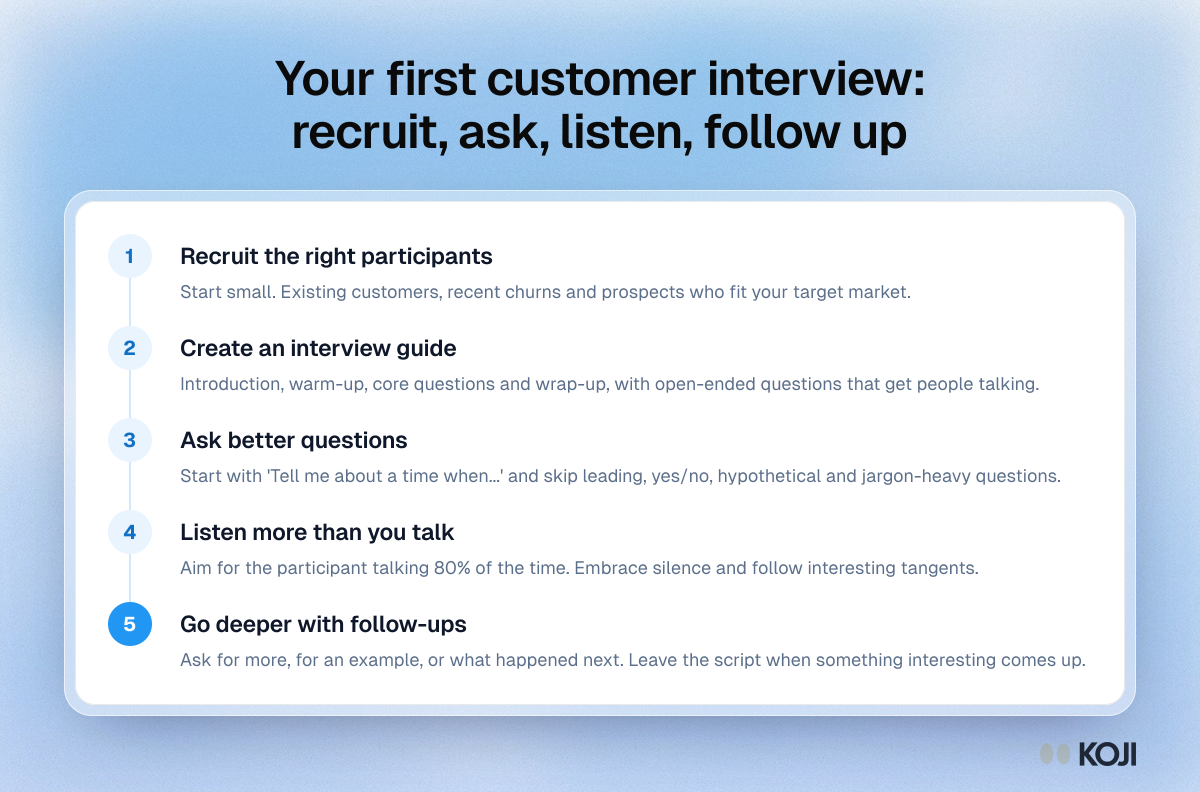
Process showing five steps for a first customer interview: recruit the right people, write a guide, ask better questions, listen, and follow up.

Process

Your first customer interview: recruit, ask, listen, follow up
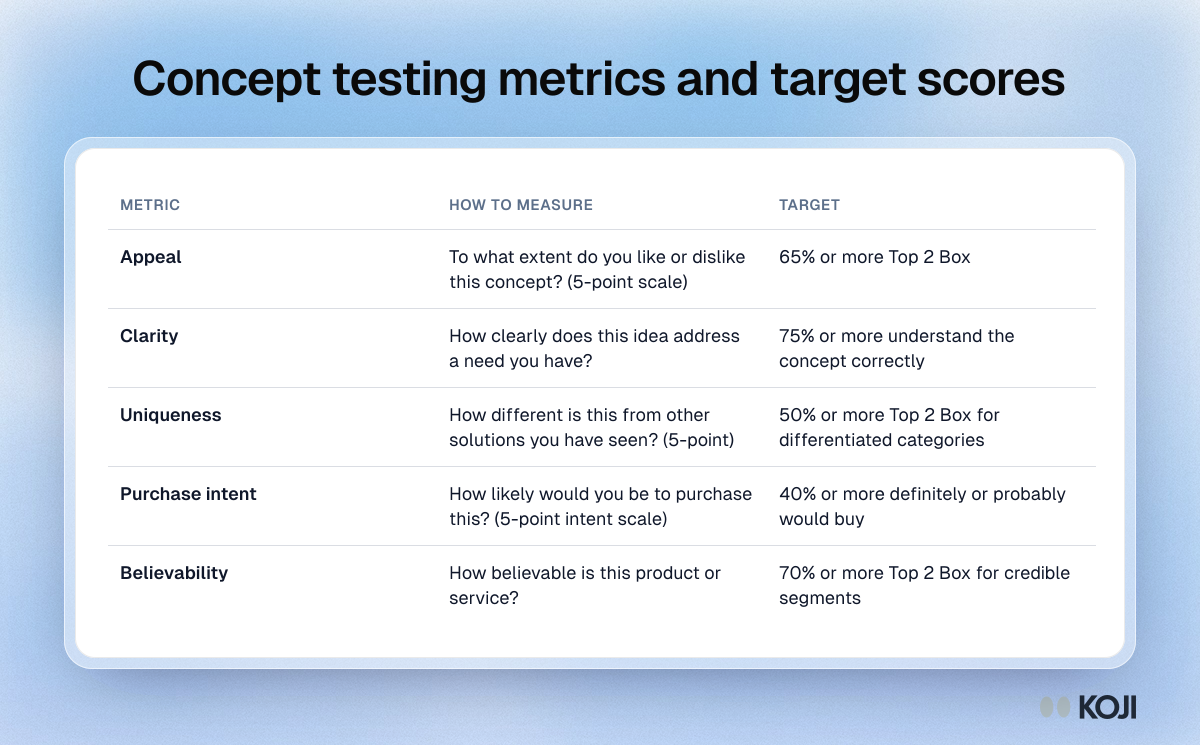
Table of five concept testing metrics, appeal, clarity, uniqueness, purchase intent and believability, with the question to ask and a target score for each.

Reference table

Concept testing metrics and target scores
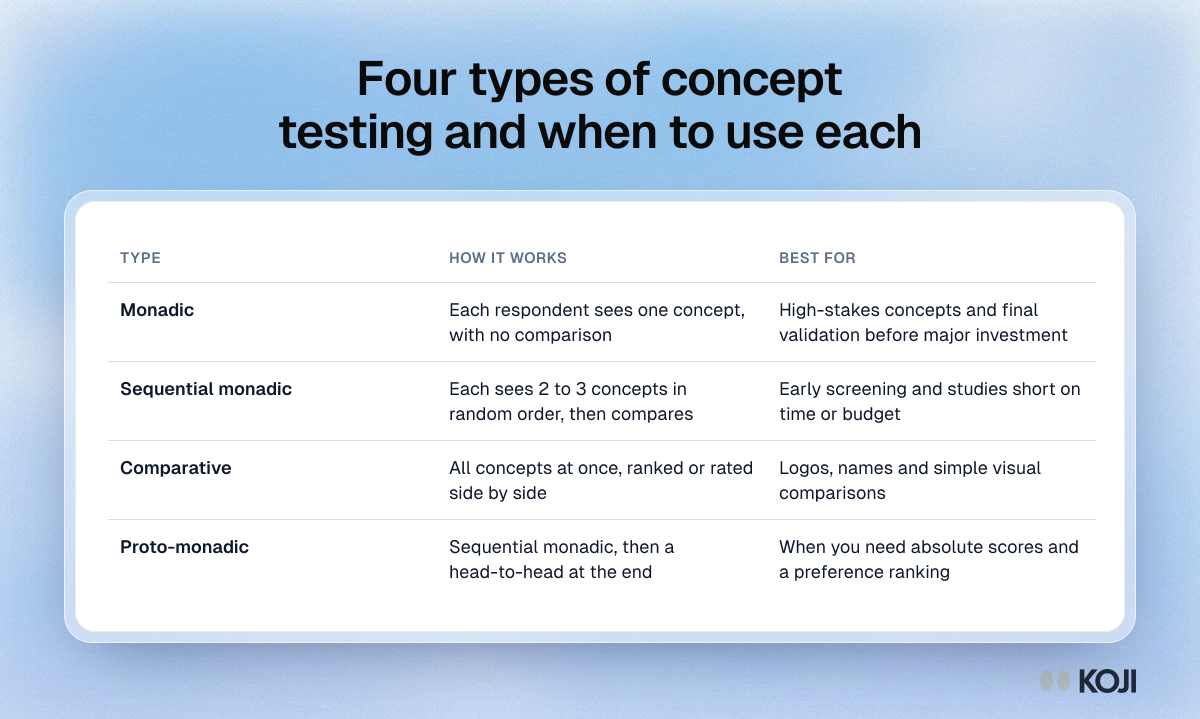
Table of four concept testing types, monadic, sequential monadic, comparative and proto-monadic, with how each works and what it suits best.

Reference table

Four types of concept testing and when to use each
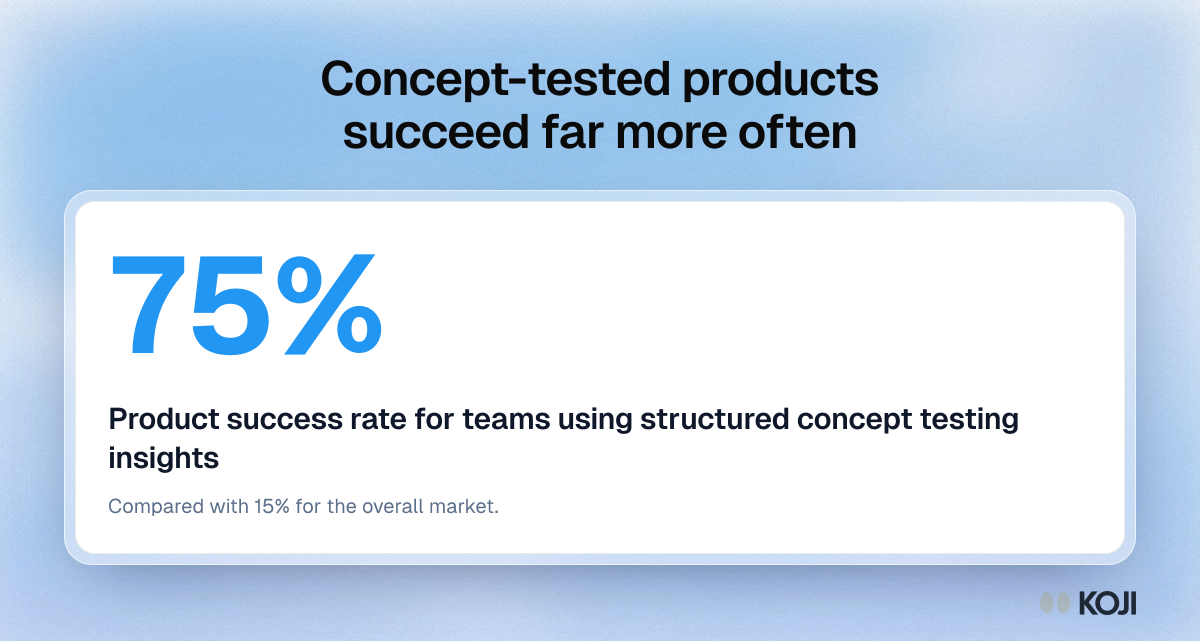
Stat card: a 75% product success rate for teams using structured concept testing insights, against 15% for the overall market, from NIQ BASES data.

Key figure

Concept-tested products succeed far more often
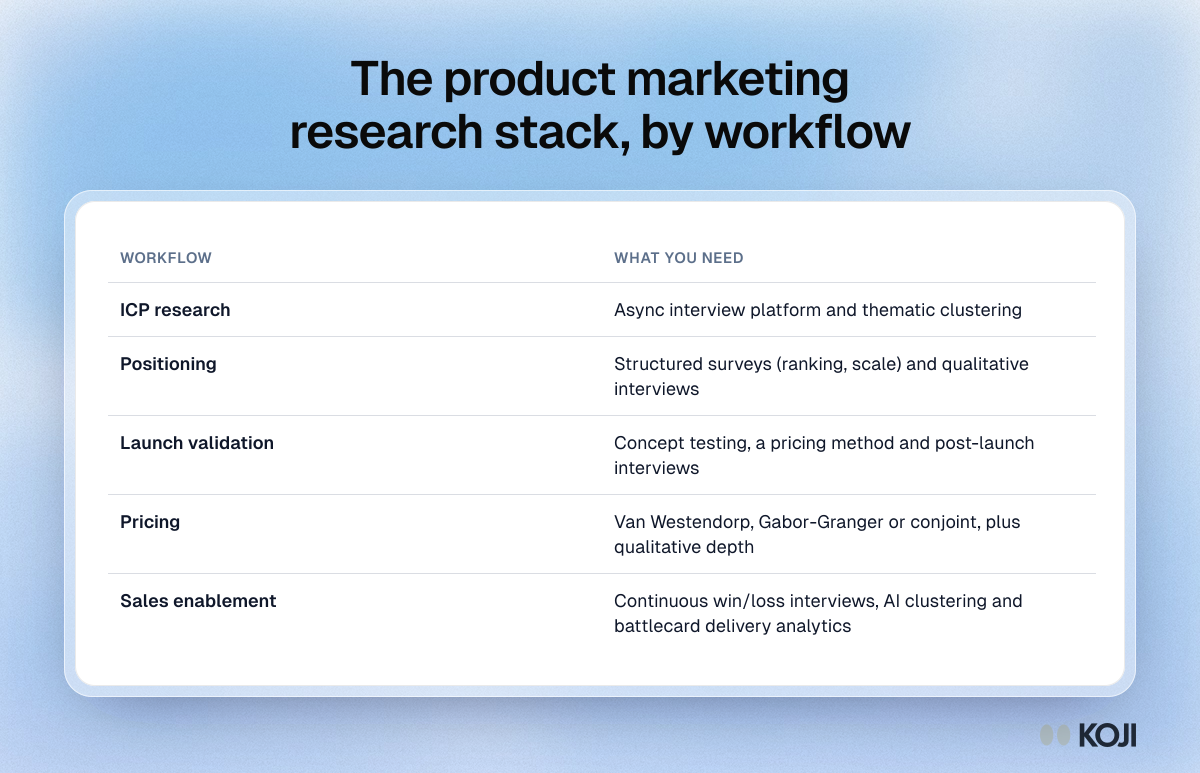
Table of the research a product marketer needs for each workflow: ICP, positioning, launch validation, pricing and sales enablement.

Reference table

The product marketing research stack, by workflow
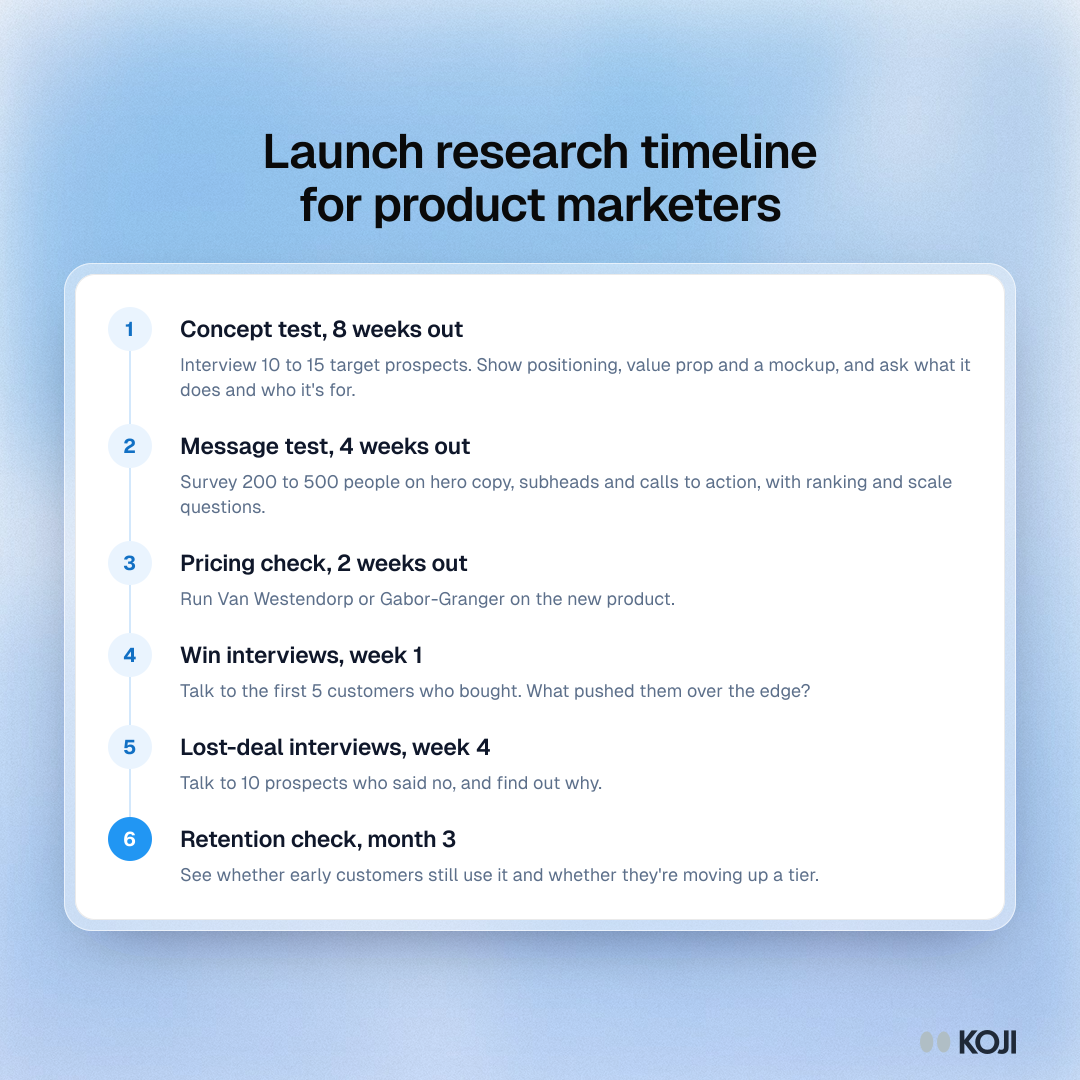
Process of a launch research timeline: concept test, message test and pricing check before launch, then win, lost-deal and retention interviews after.

Process

Launch research timeline for product marketers
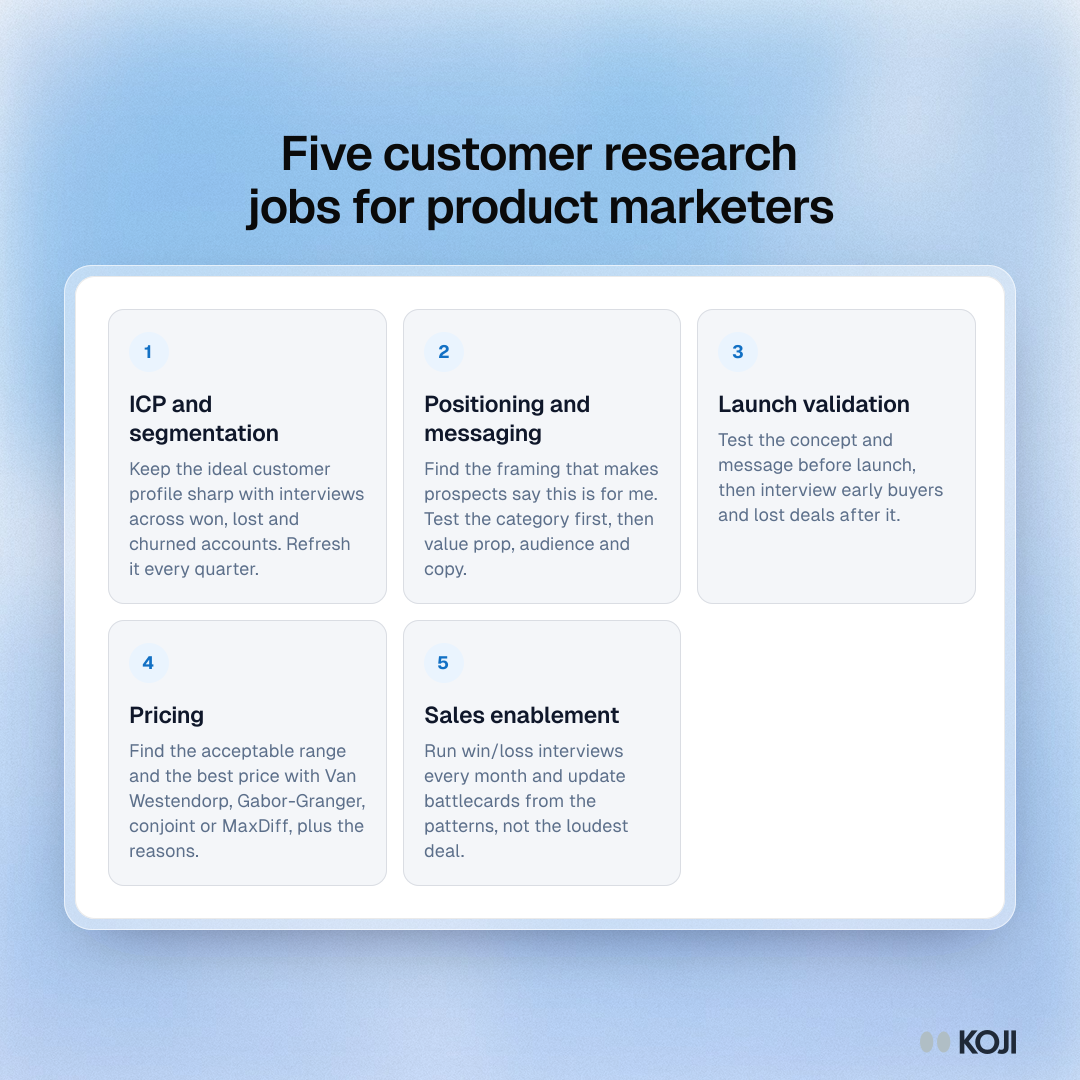
Framework of five product marketing research jobs: ICP and segmentation, positioning and messaging, launch validation, pricing, and sales enablement.

Framework

Five customer research jobs for product marketers
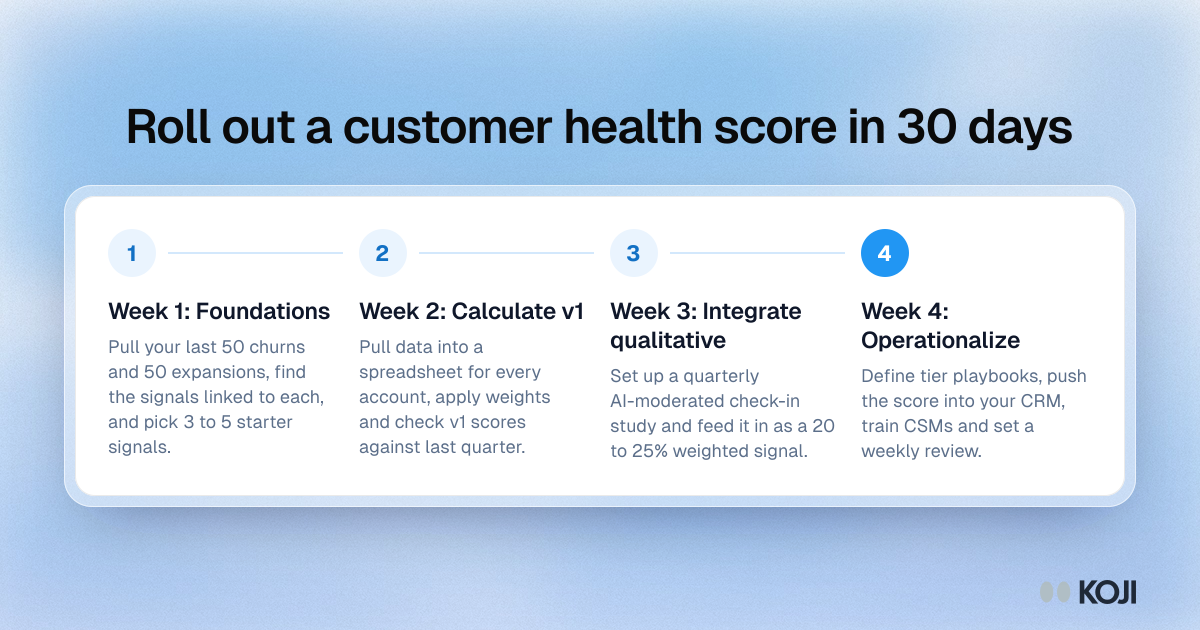
Process showing a four-week customer health score rollout: foundations, a first version, adding qualitative signal, then tier playbooks and training.

Process

Roll out a customer health score in 30 days
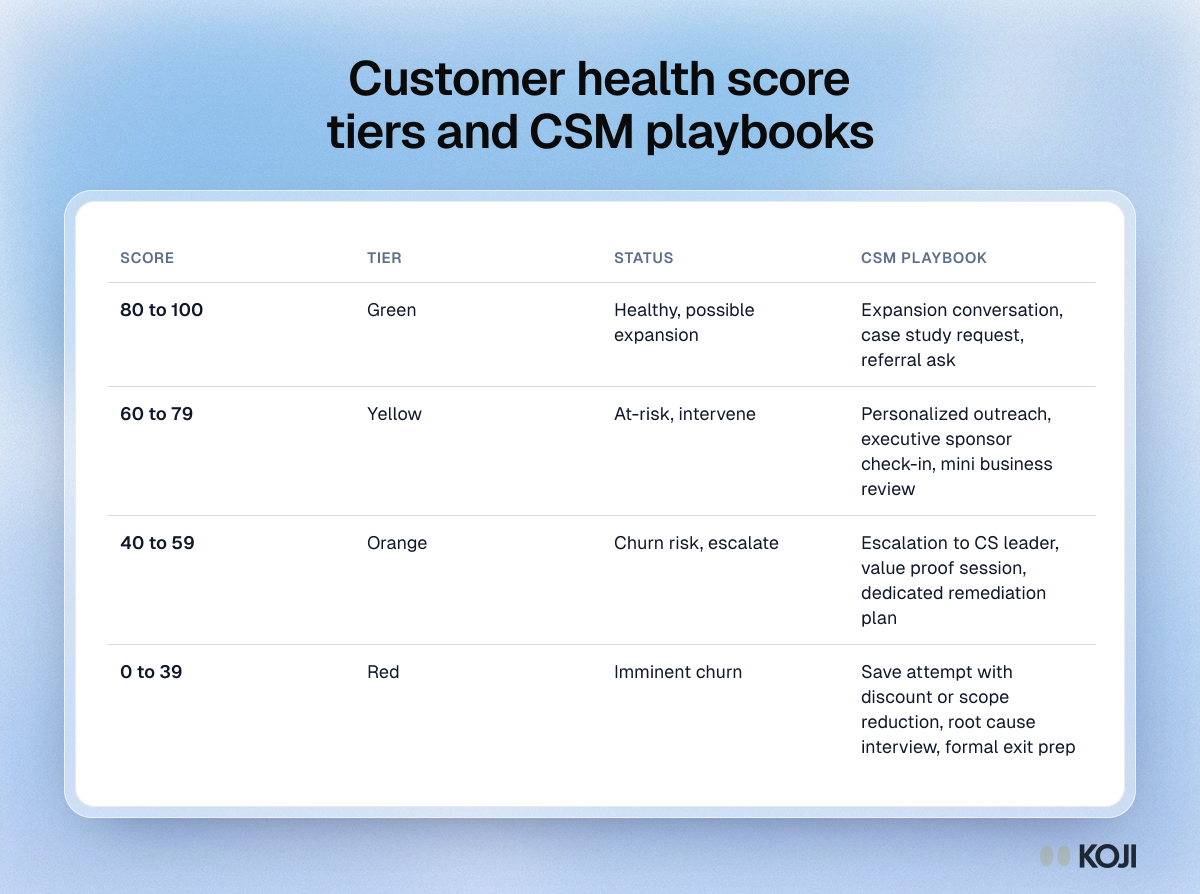
Table of customer health score tiers: green 80 to 100, yellow 60 to 79, orange 40 to 59 and red 0 to 39, each with its status and the CSM playbook to run.

Reference table

Customer health score tiers and CSM playbooks
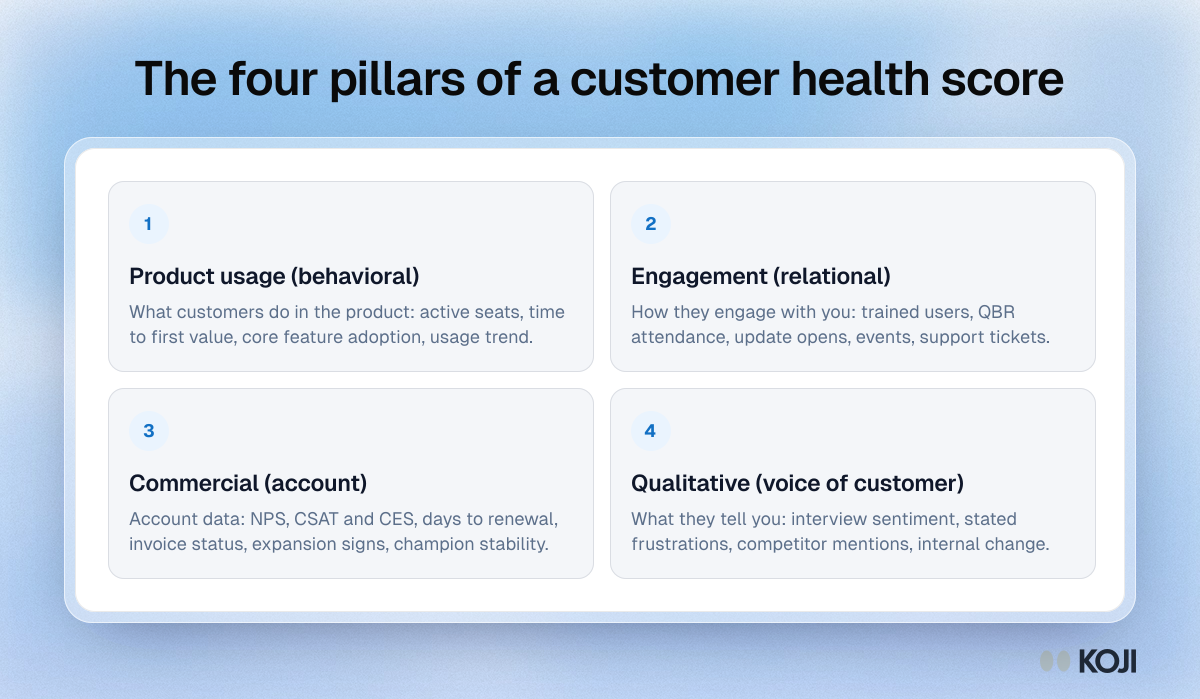
Framework showing the four pillars of a SaaS customer health score: product usage, engagement, commercial and qualitative signals, with examples of each.

Framework

The four pillars of a customer health score
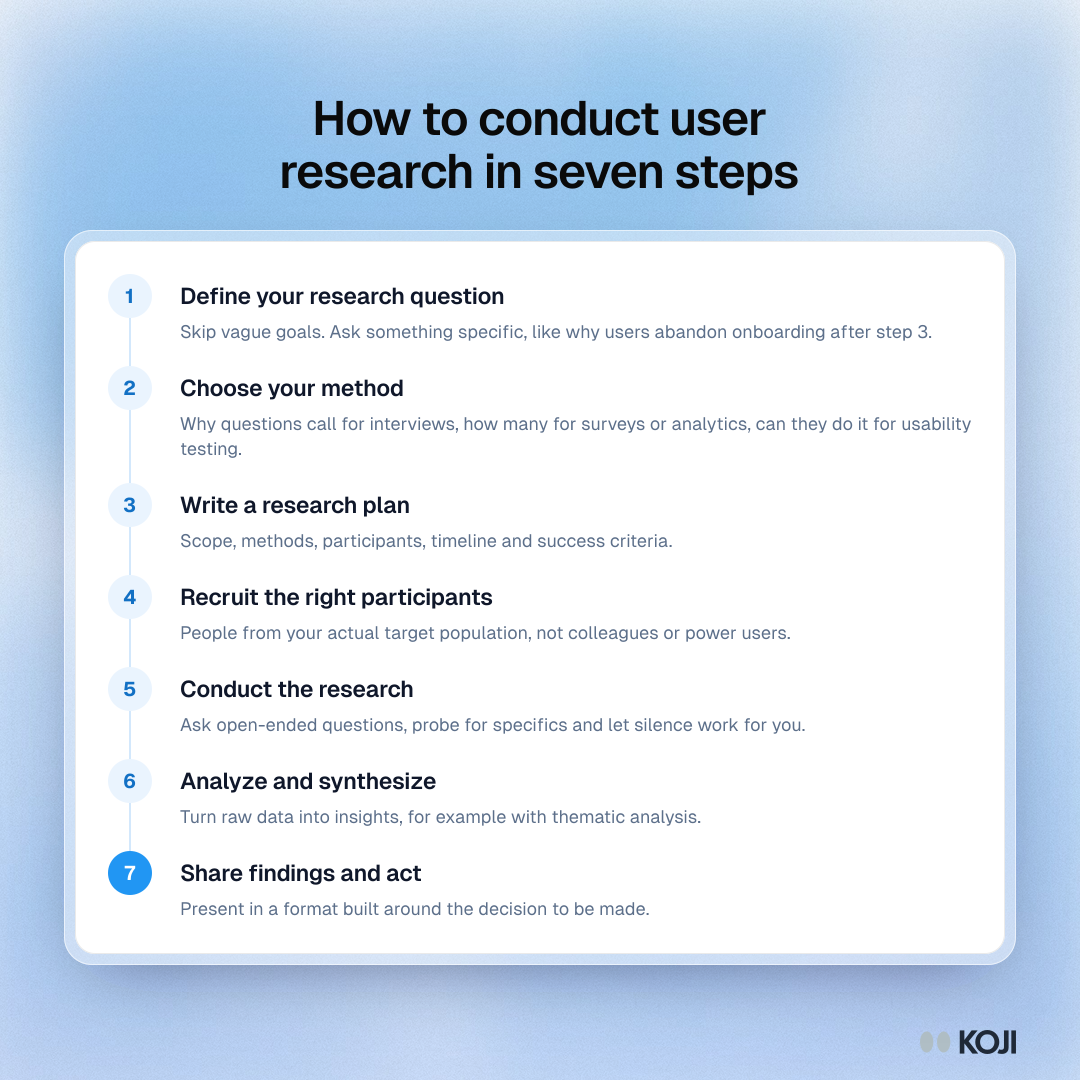
Process showing seven steps to conduct user research: define the question, choose a method, write a plan, recruit, conduct, analyze and share findings.

Process

How to conduct user research in seven steps
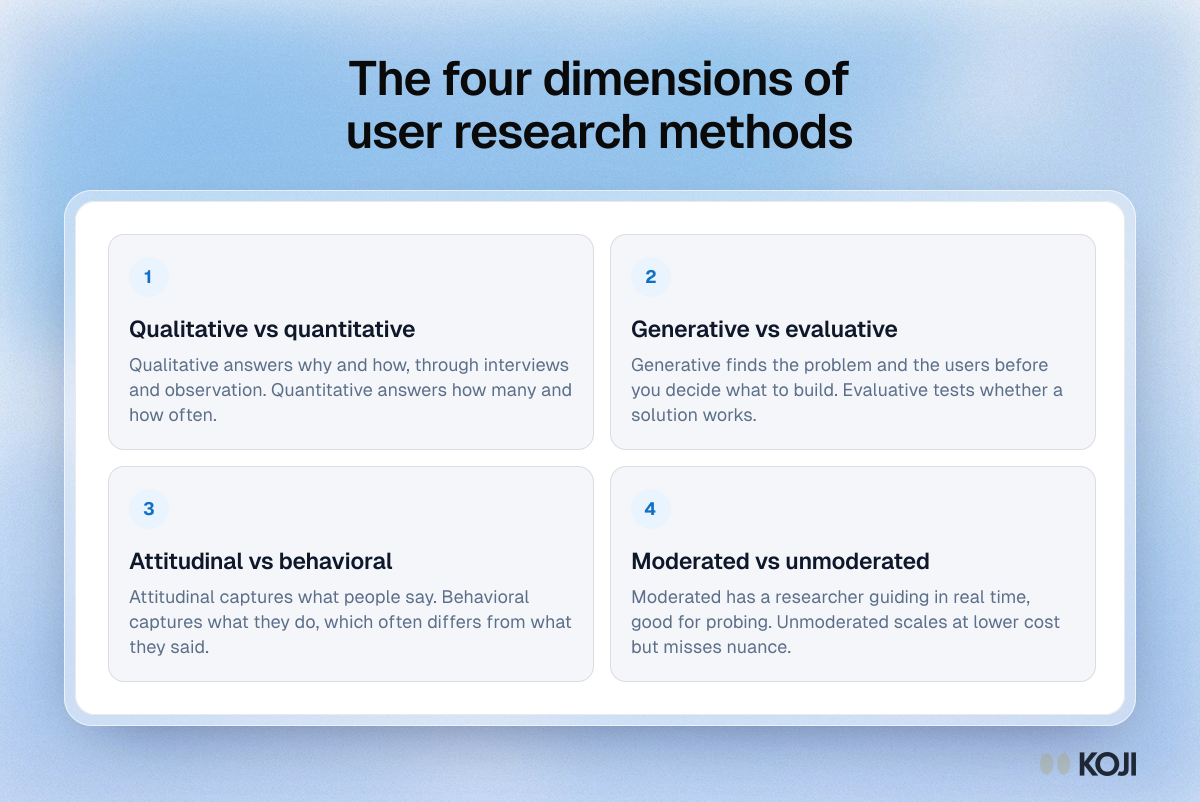
Framework of four dimensions of user research: qualitative or quantitative, generative or evaluative, attitudinal or behavioral, moderated or unmoderated.

Framework

The four dimensions of user research methods
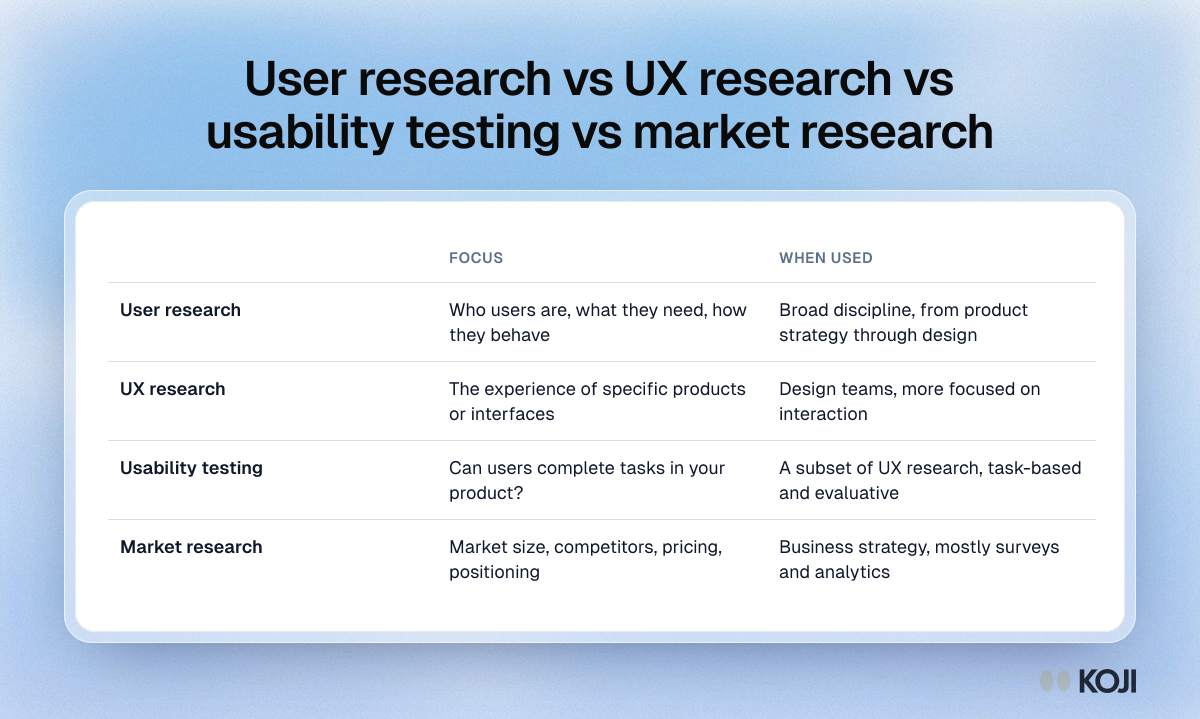
Table comparing user research, UX research, usability testing and market research by what each focuses on and when teams use it.

Reference table

User research vs UX research vs usability testing vs market research
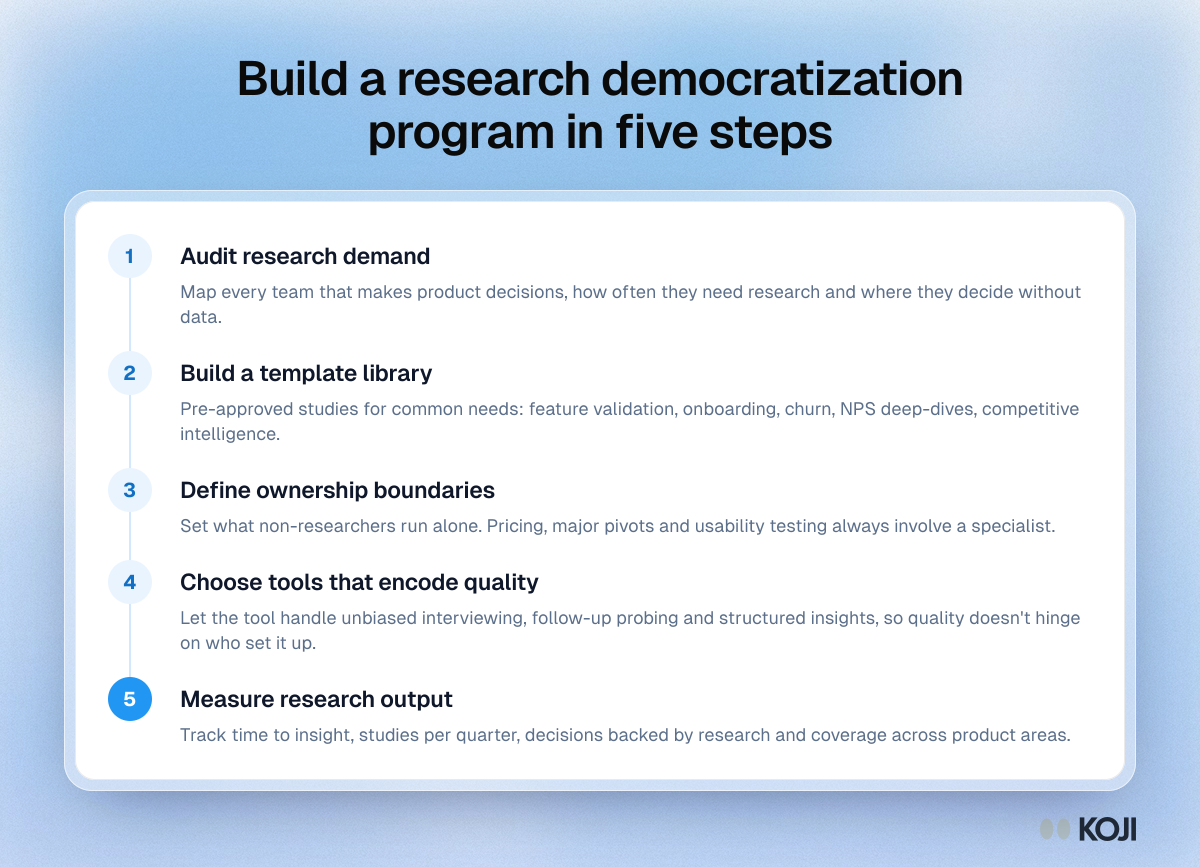
Process showing five steps to build a research democratization program: audit demand, build templates, set ownership boundaries, choose tools, measure output.

Process

Build a research democratization program in five steps
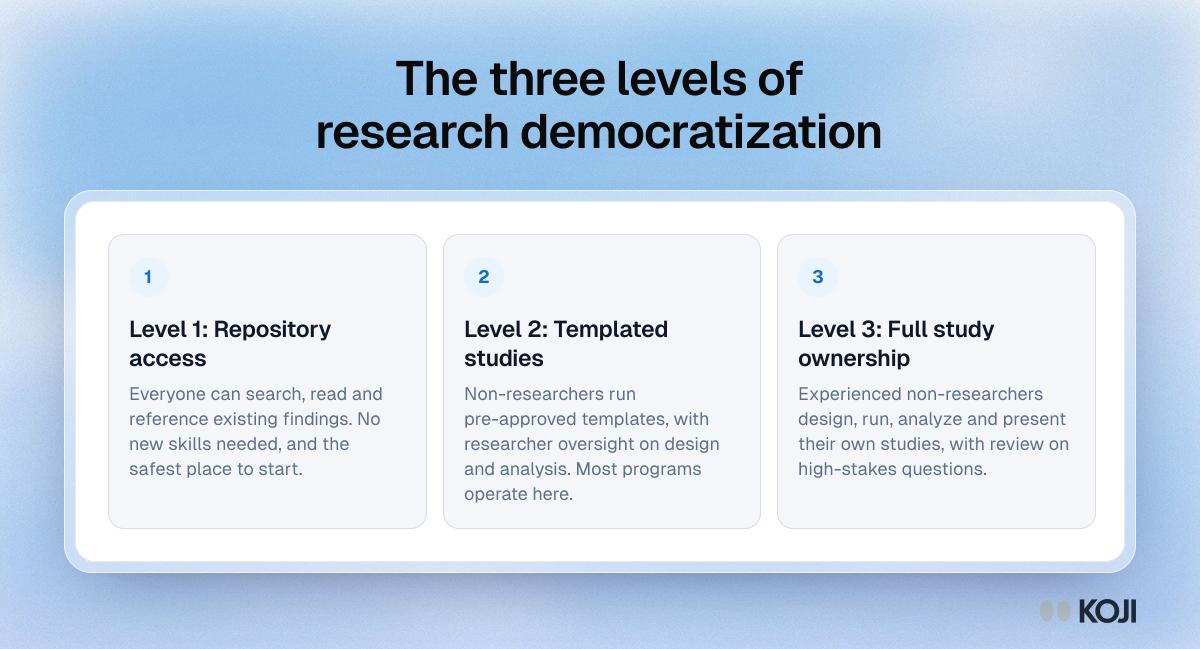
Framework showing three levels of research democratization: repository access for everyone, templated studies with oversight, and full study ownership.

Framework

The three levels of research democratization
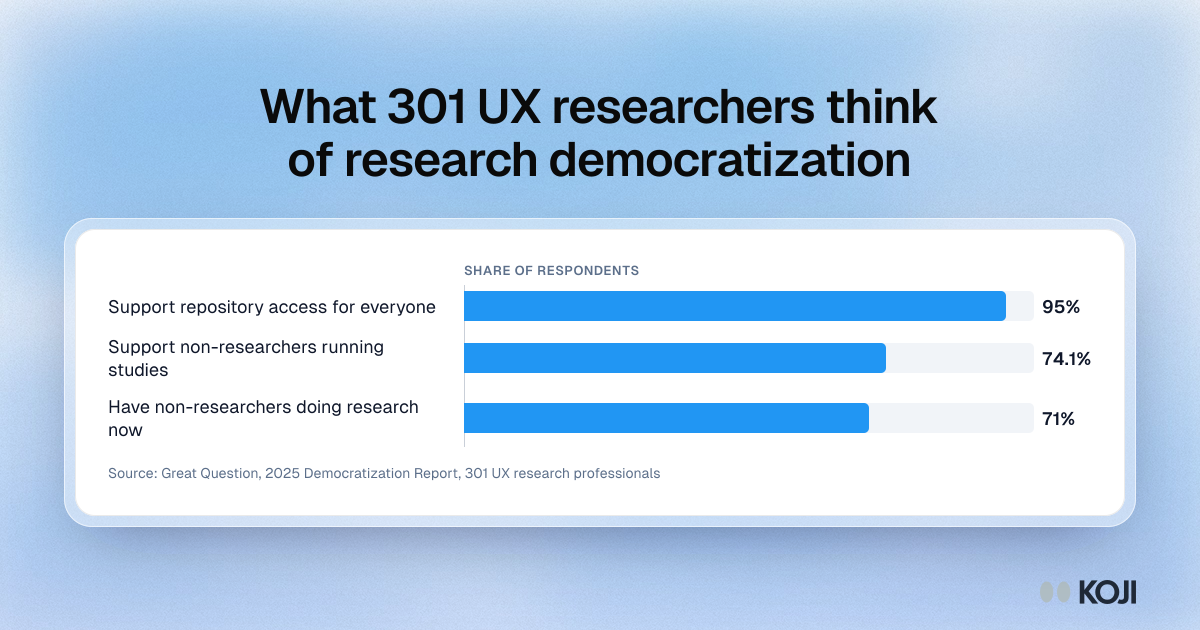
Bar chart from a 2025 survey of 301 UX researchers: 95.0% back repository access for all, 74.1% back non-researchers running studies, 71% already do it.

Bar chart

What 301 UX researchers think of research democratization
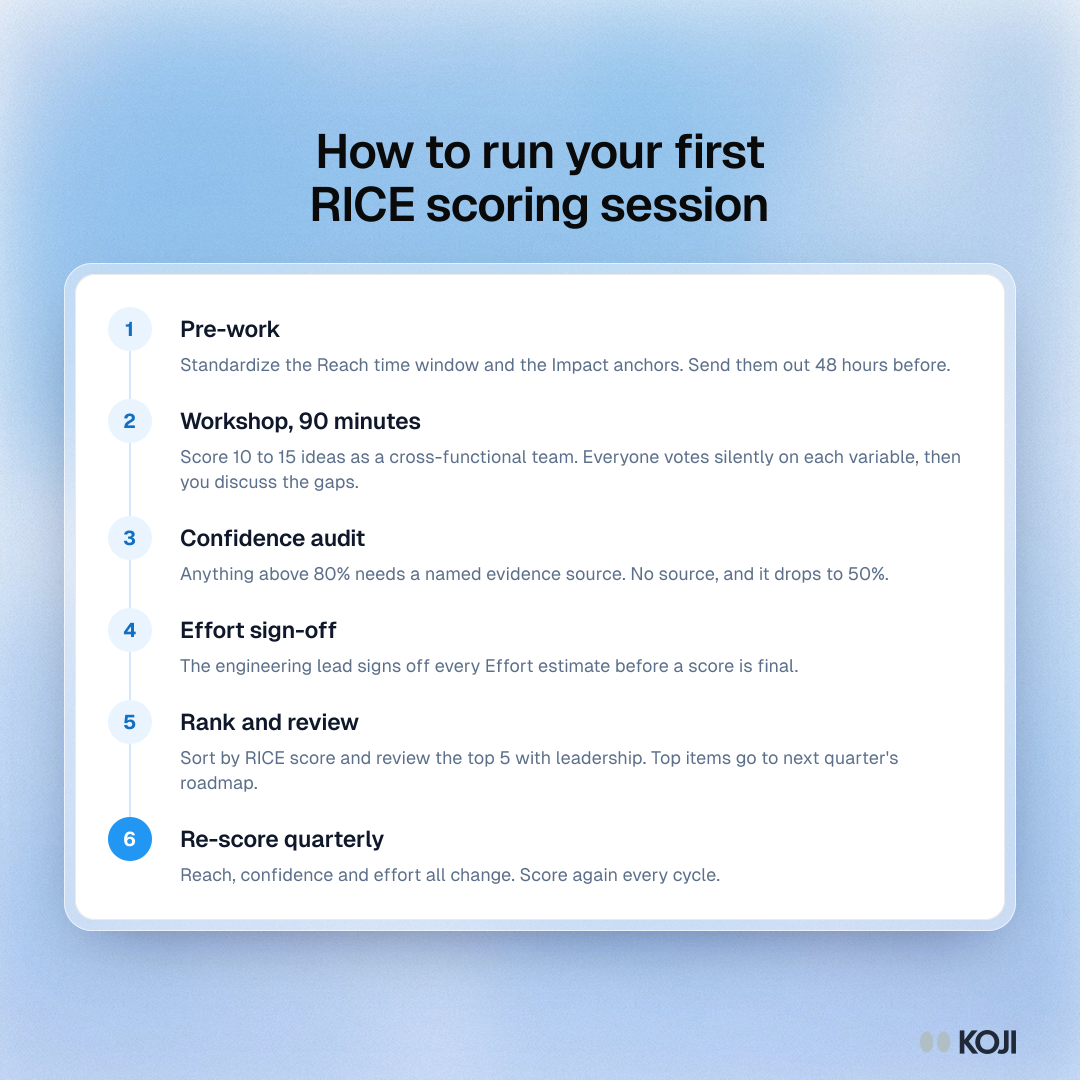
Process showing six steps of a RICE scoring session: pre-work, a 90-minute workshop, confidence audit, effort sign-off, rank and review, re-score quarterly.

Process

How to run your first RICE scoring session
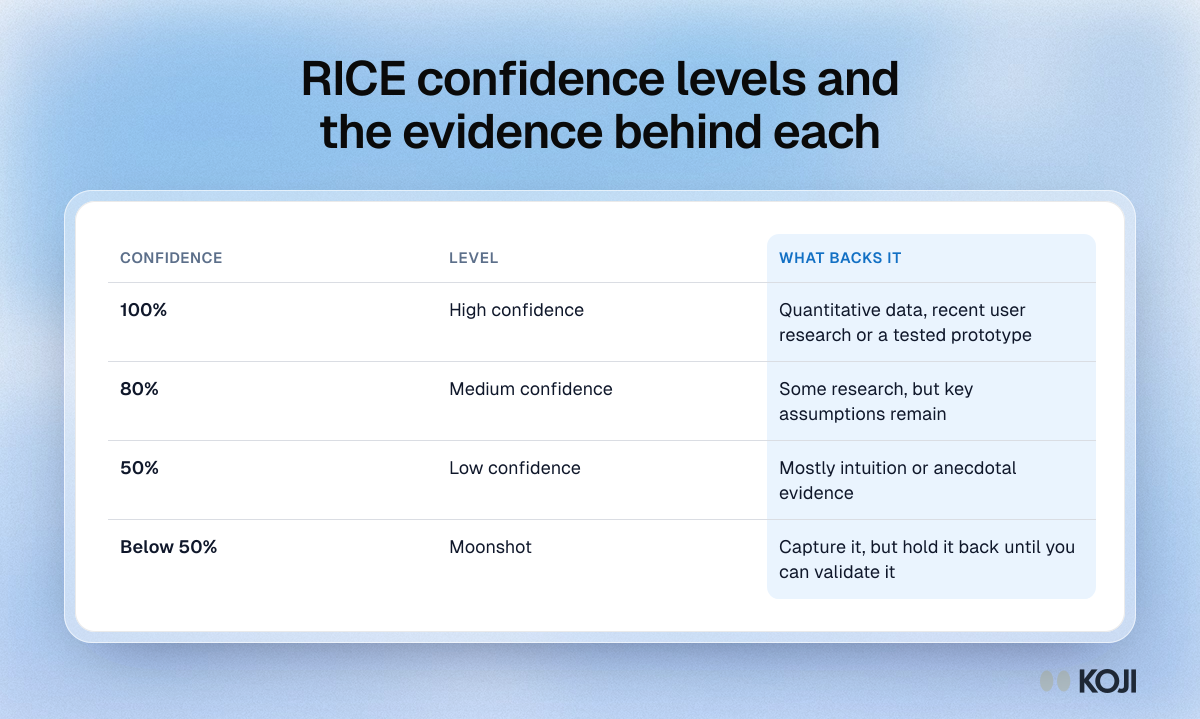
Table of RICE confidence levels: 100% high, 80% medium, 50% low and below 50% a moonshot, with the kind of evidence each level needs.

Reference table

RICE confidence levels and the evidence behind each
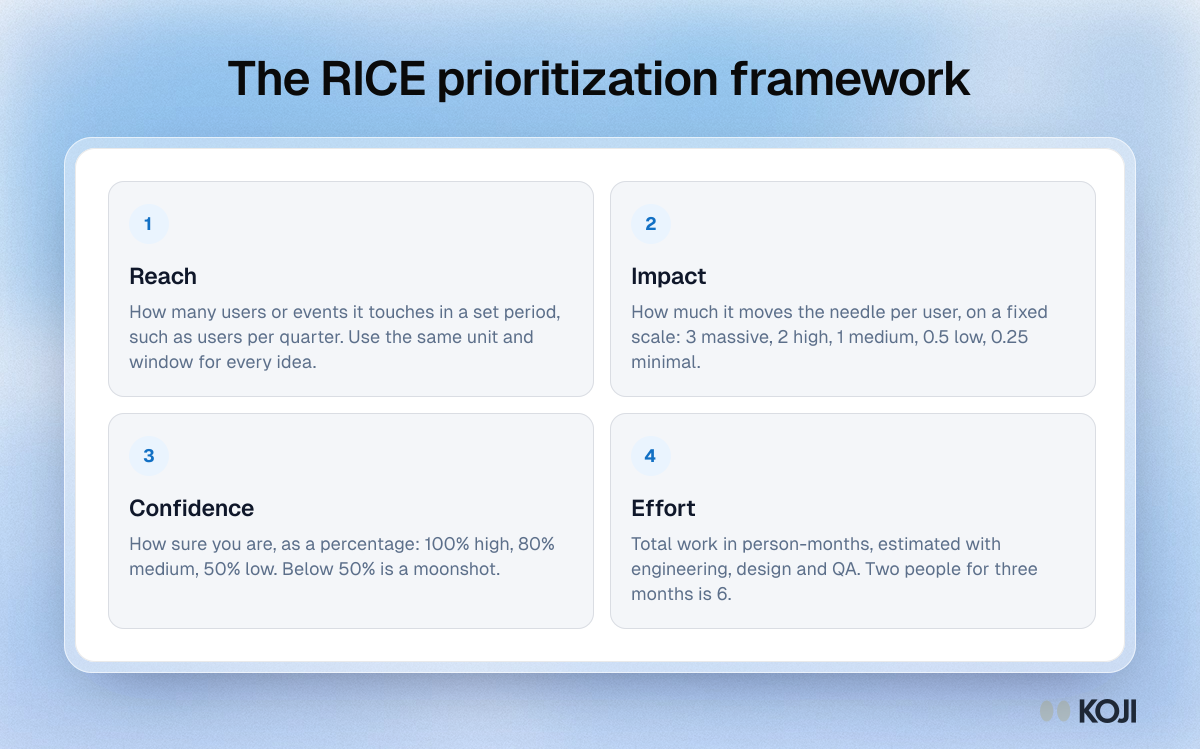
Framework showing the four RICE prioritization factors: reach, impact, confidence and effort, with the scale or unit used to score each one.

Framework

The RICE prioritization framework
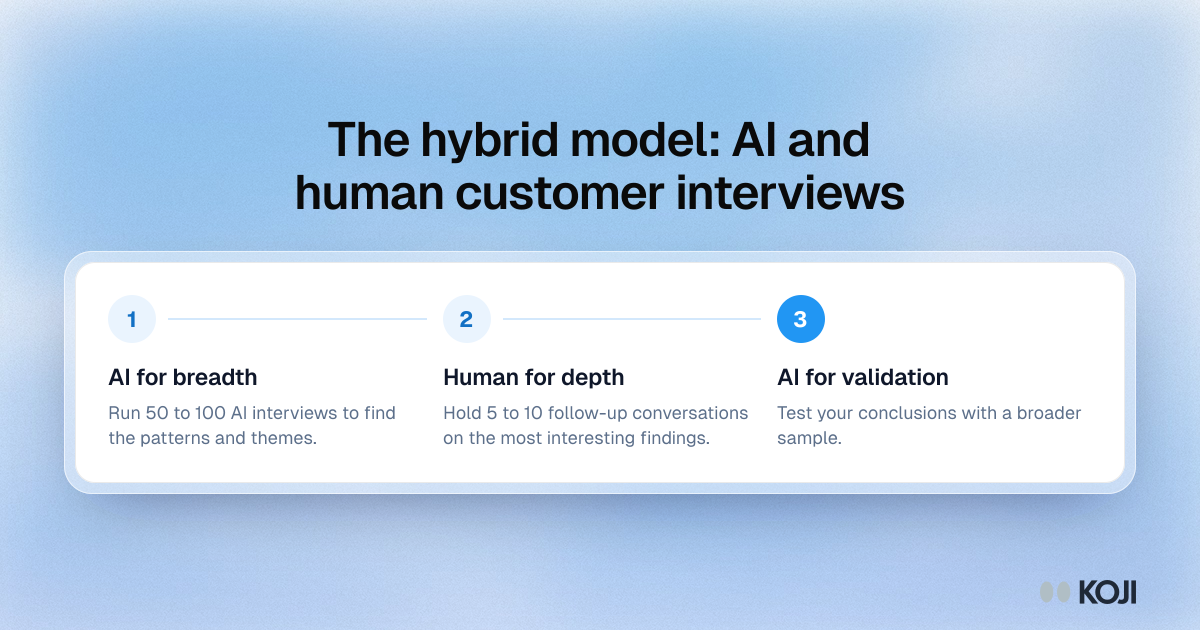
Process showing the hybrid interview model in three steps: 50 to 100 AI interviews for breadth, 5 to 10 human follow-ups for depth, then AI to validate.

Process

The hybrid model: AI and human customer interviews
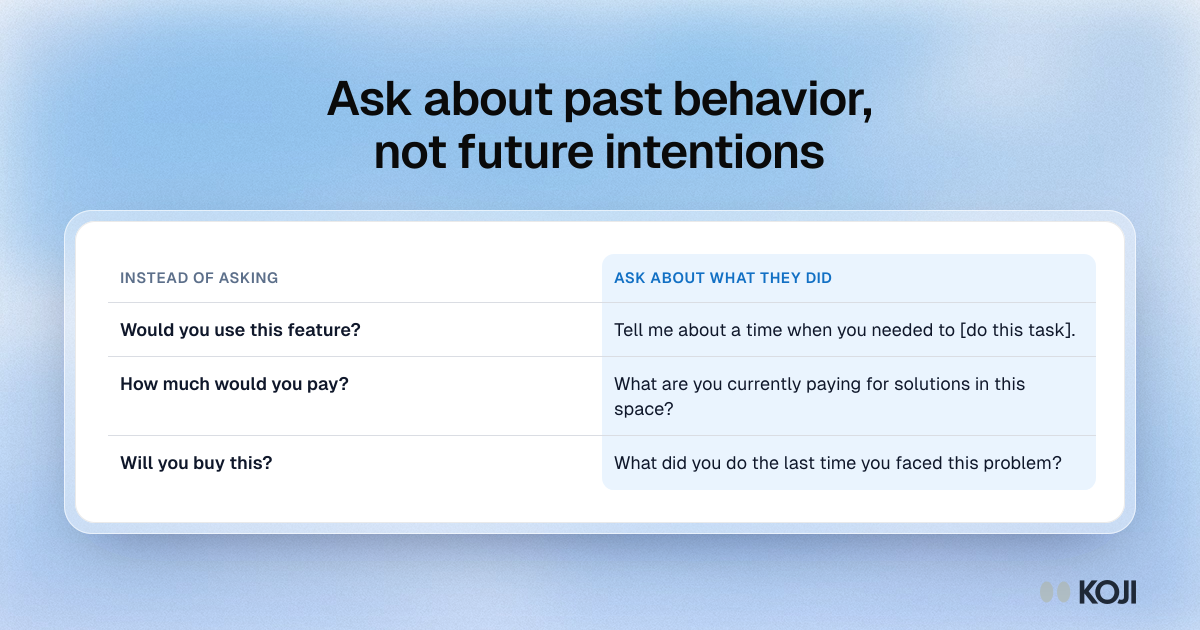
Table rewriting three hypothetical interview questions, about using a feature, paying and buying, as questions about what the customer actually did.

Reference table

Ask about past behavior, not future intentions
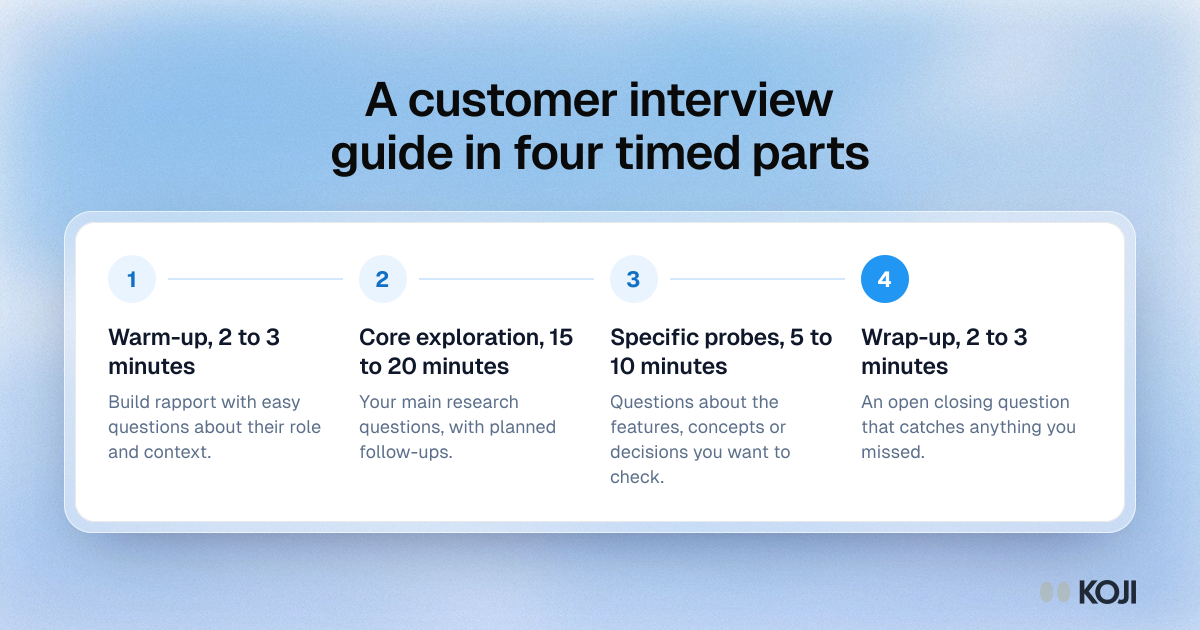
Process showing a customer interview guide in four timed parts: warm-up, core exploration, specific probes and wrap-up, with minutes for each part.

Process

A customer interview guide in four timed parts
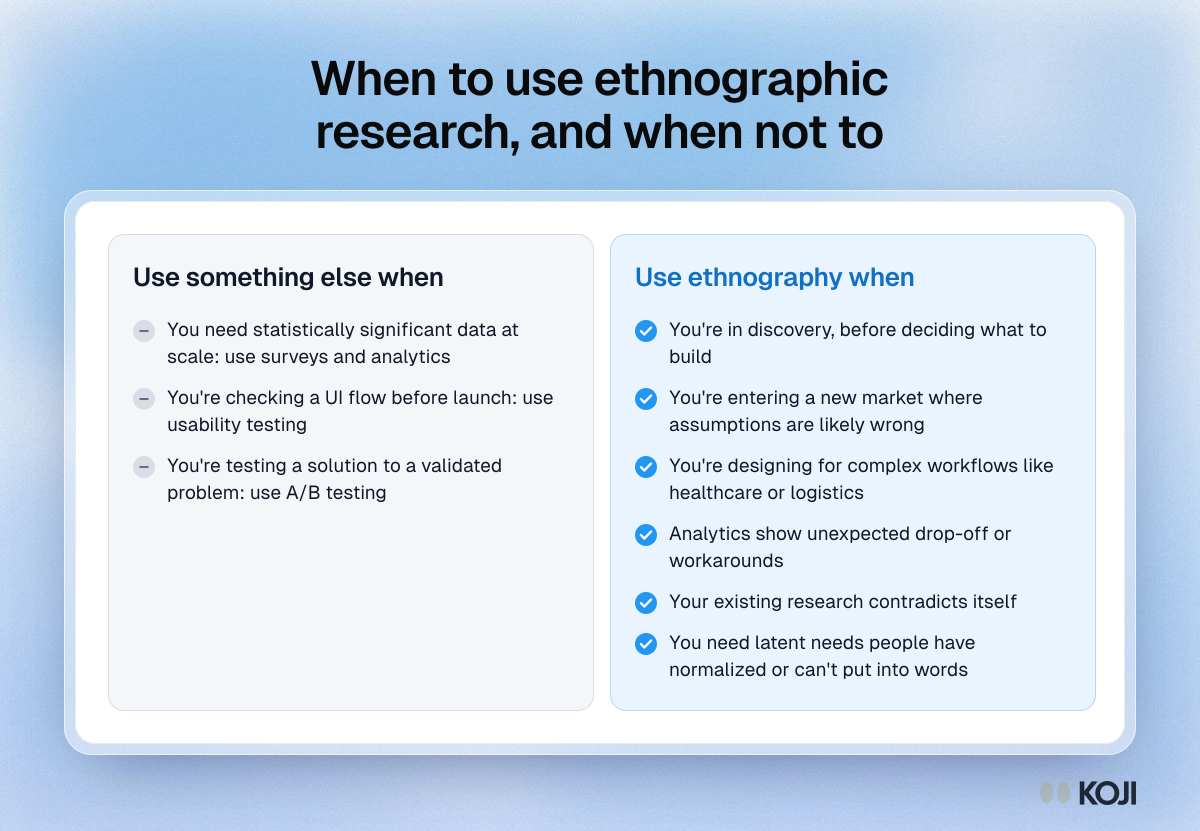
Comparison of when ethnographic research fits, such as discovery and complex workflows, and when surveys, usability tests or A/B tests fit better.

Comparison

When to use ethnographic research, and when not to
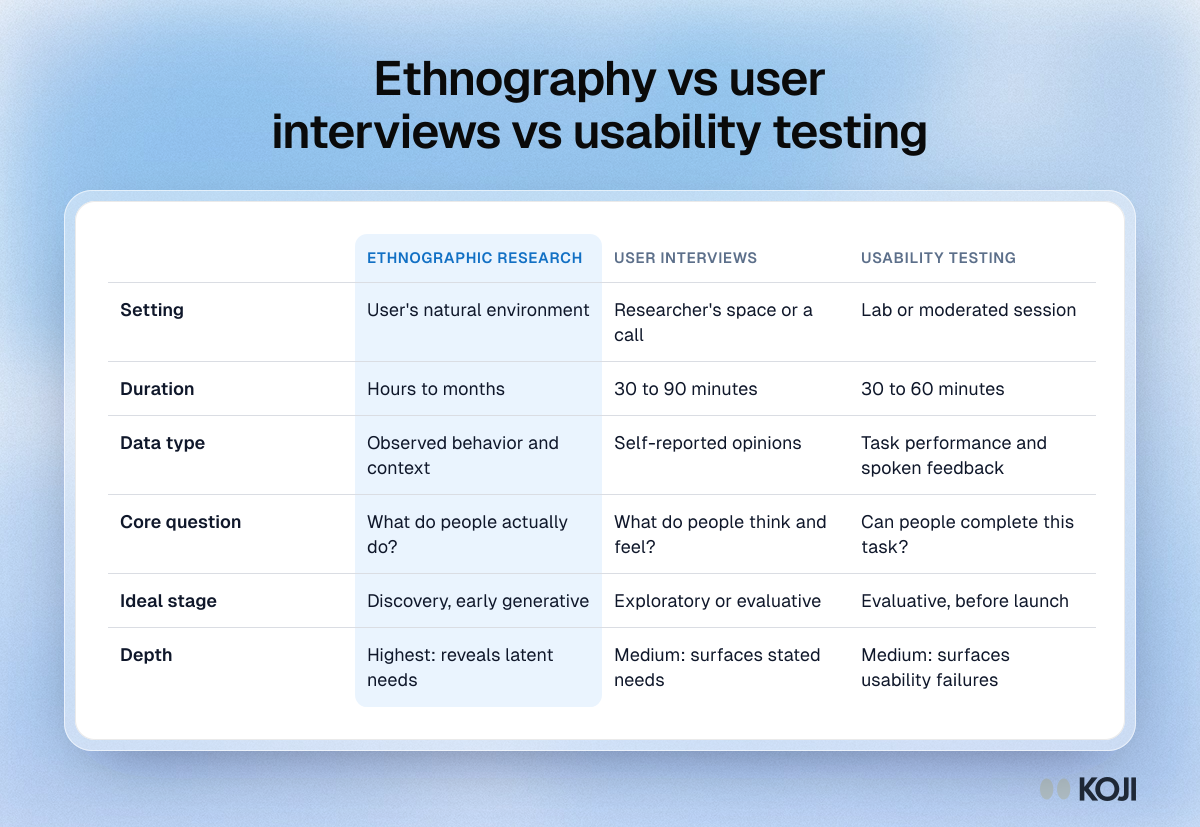
Table comparing ethnographic research, user interviews and usability testing on setting, duration, data type, core question, ideal stage and depth.

Reference table

Ethnography vs user interviews vs usability testing
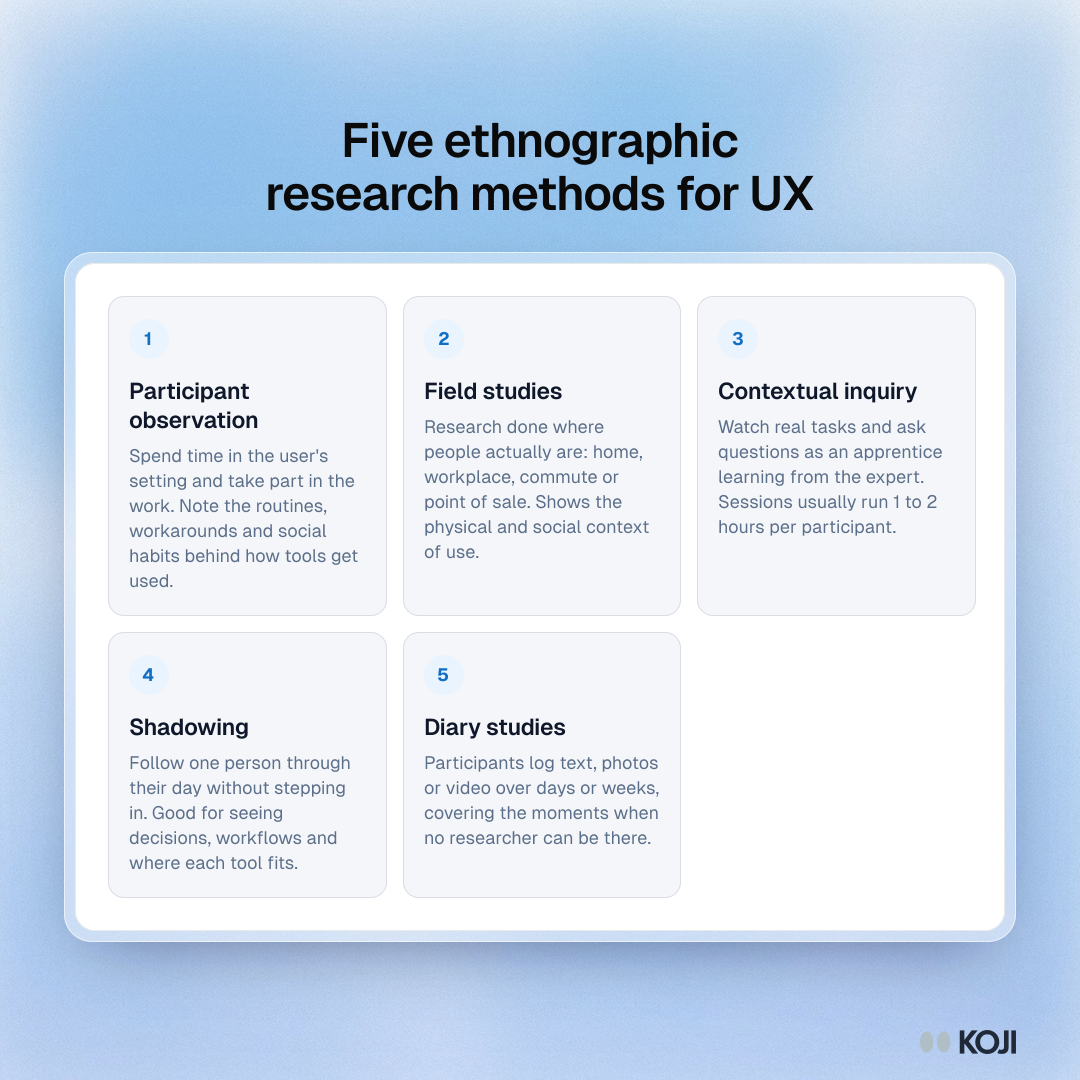
Framework showing five ethnographic research methods: participant observation, field studies, contextual inquiry, shadowing and diary studies.

Framework

Five ethnographic research methods for UX
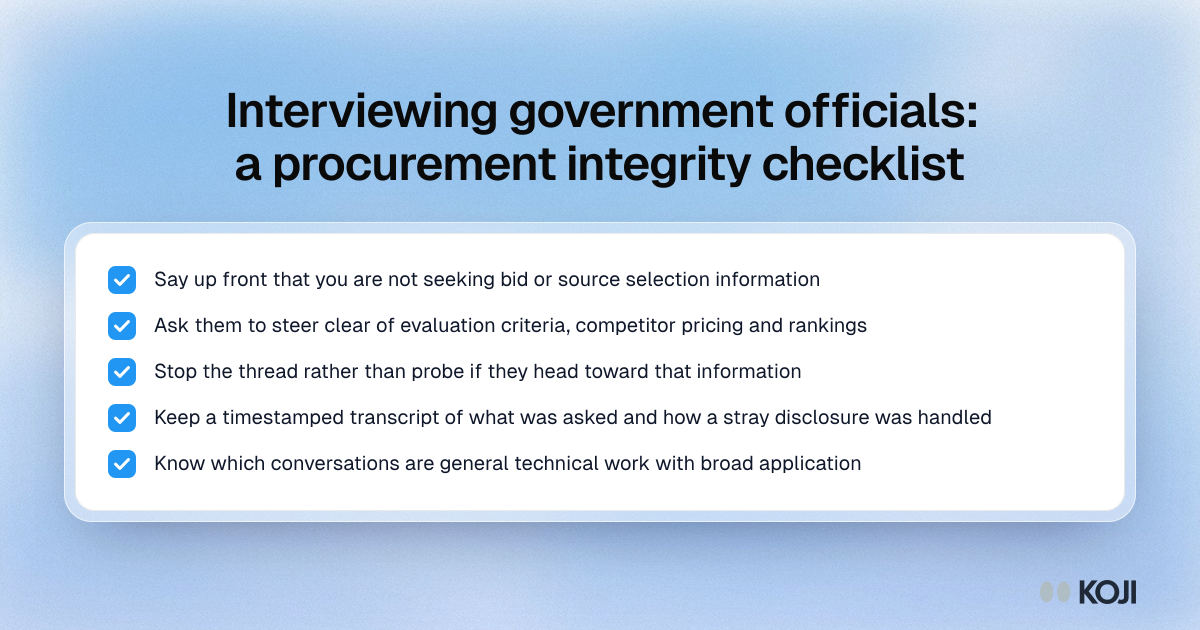
Checklist for interviewing government officials under procurement integrity rules: state the boundary, stop rather than probe, and keep a transcript.

Checklist

Interviewing government officials: a procurement integrity checklist
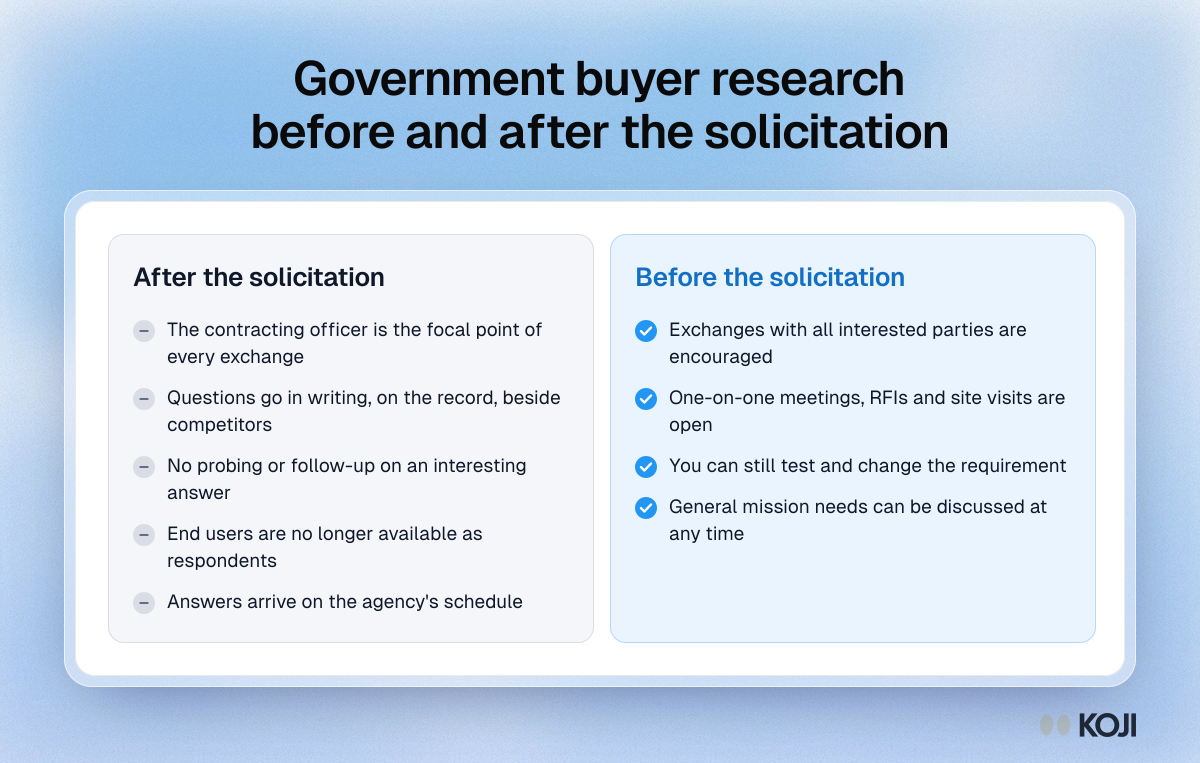
Comparison of government buyer research before a solicitation, when exchanges are encouraged, and after, when all contact goes through the contracting officer.

Comparison

Government buyer research before and after the solicitation
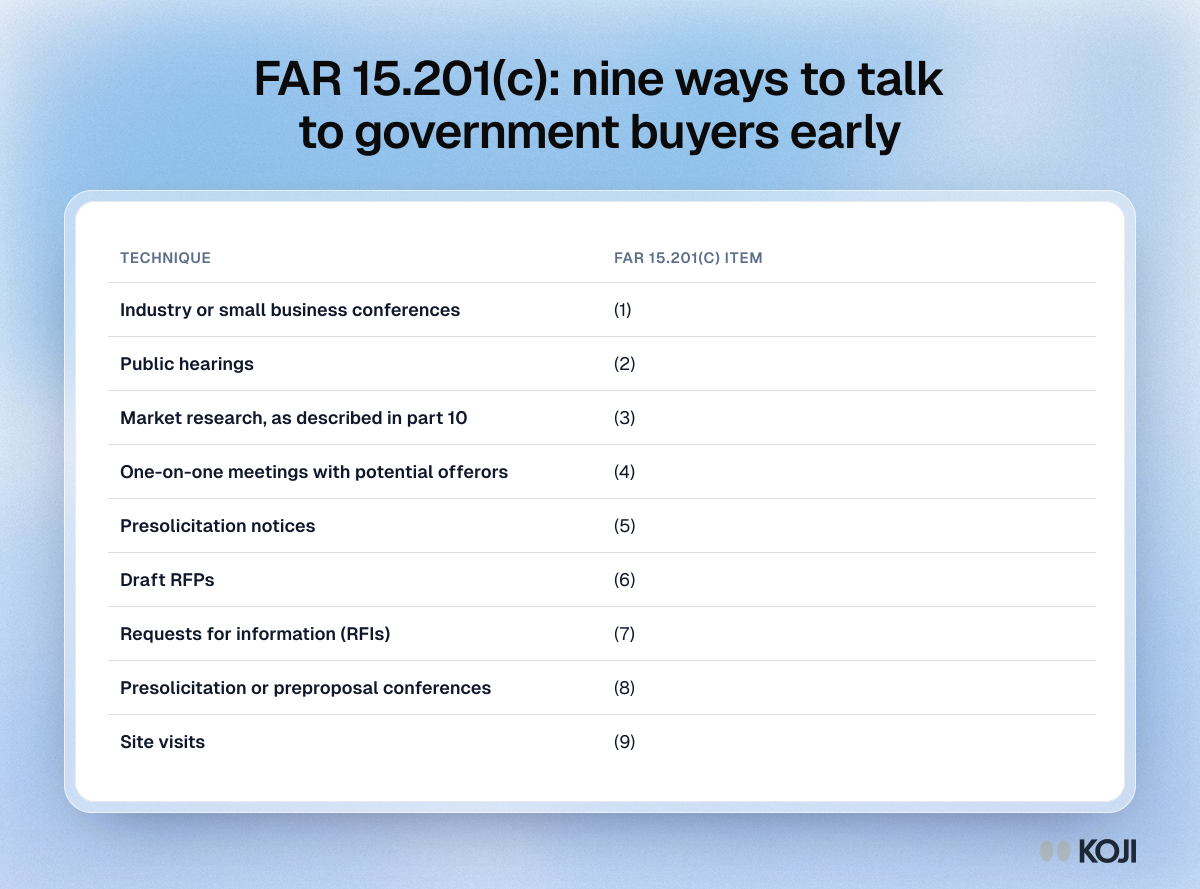
Table of the nine early exchange techniques in FAR 15.201(c), from industry conferences and one-on-one meetings to draft RFPs, RFIs and site visits.

Reference table

FAR 15.201(c): nine ways to talk to government buyers early
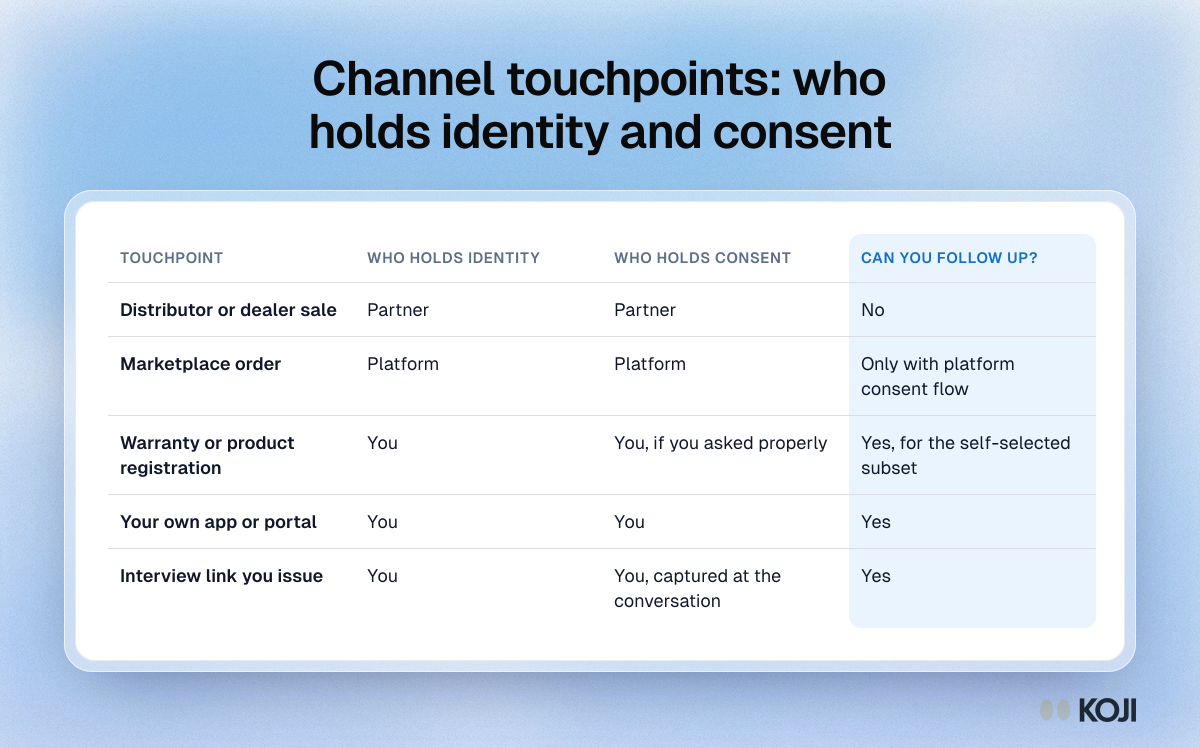
Table of five channel touchpoints, from a distributor sale to an interview link you issue, showing who holds identity and consent and if you can follow up.

Reference table

Channel touchpoints: who holds identity and consent
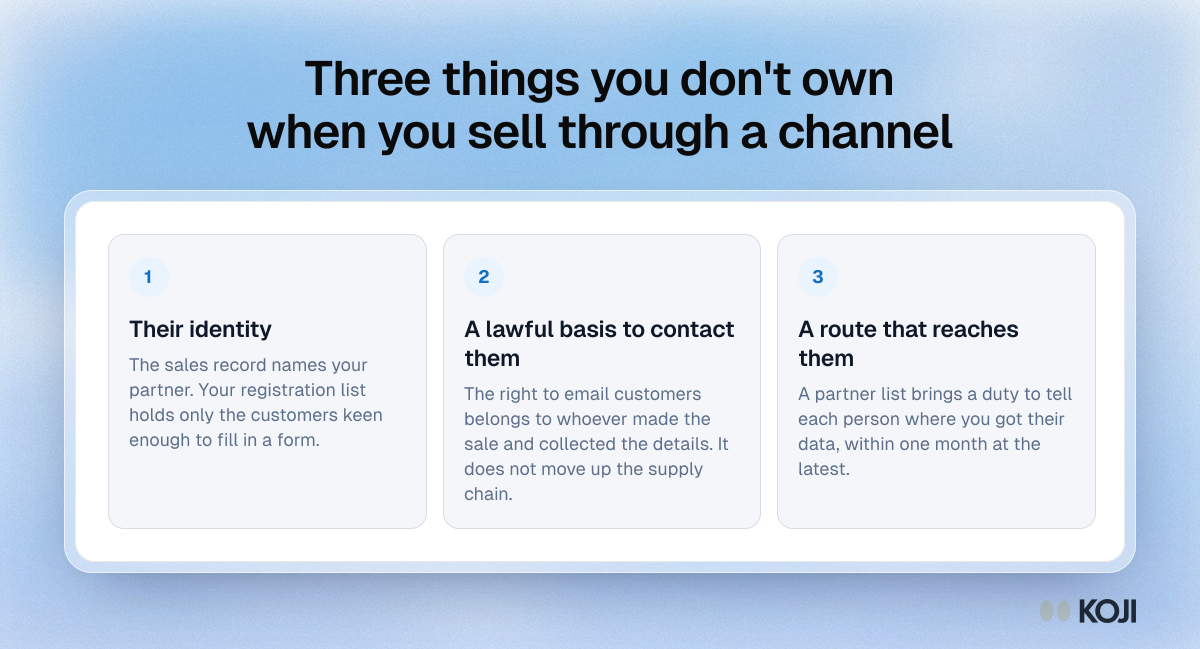
Framework of three things a manufacturer selling through a channel lacks for follow-up research: customer identity, a lawful basis to contact, and a route.

Framework

Three things you don't own when you sell through a channel
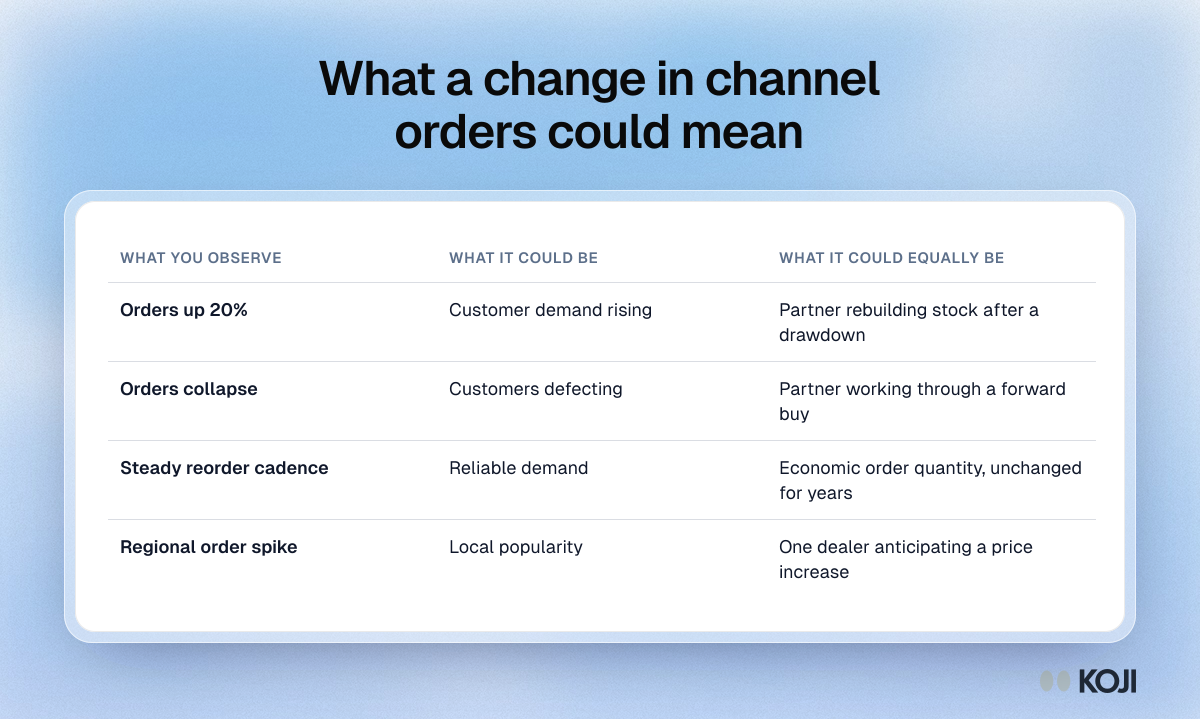
Table of four channel order signals, such as orders up 20% or a regional spike, each with a demand reading and an equally likely stocking reading.

Reference table

What a change in channel orders could mean