Free to save and share

Frameworks and cheat sheets for customer research

Every framework, checklist and comparison from our guides, as an image you can download, drop into a deck or share with your team.
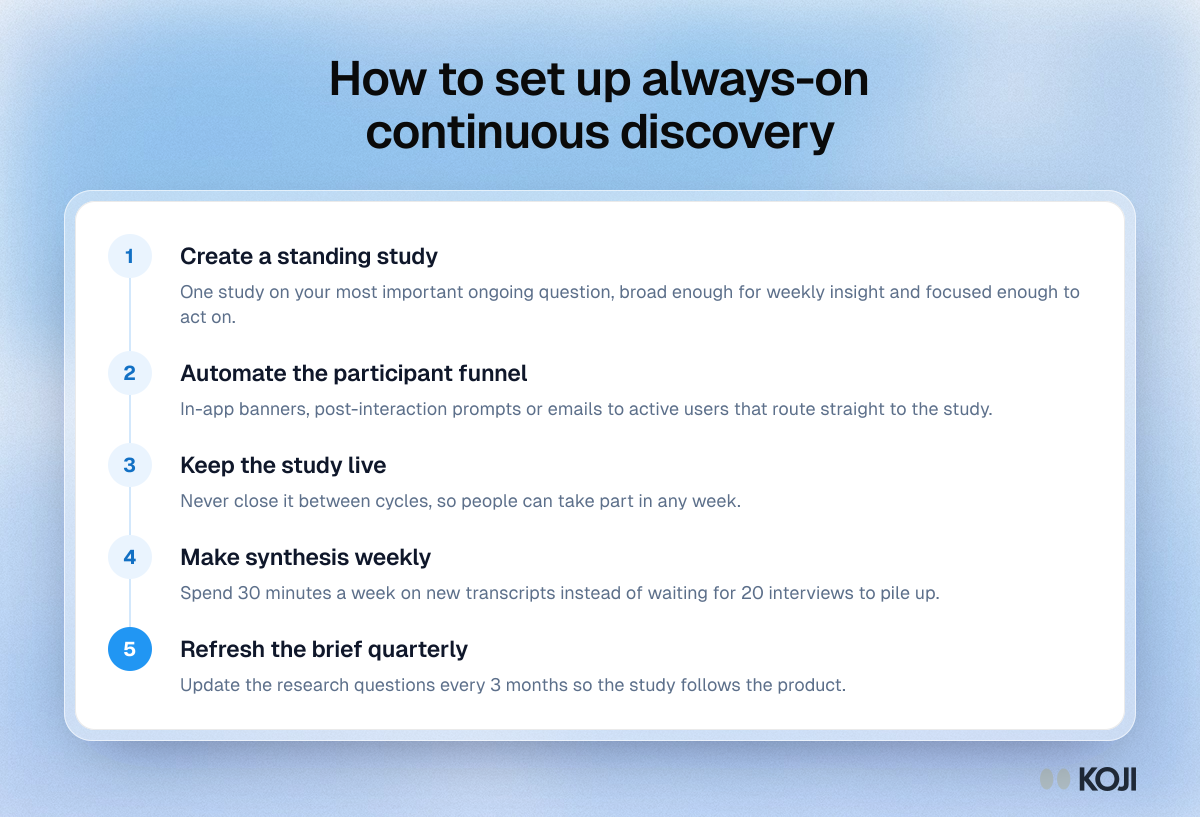
Process showing five steps for always-on continuous discovery: standing study, automated funnel, study kept live, weekly synthesis, quarterly refresh

Process

How to set up always-on continuous discovery
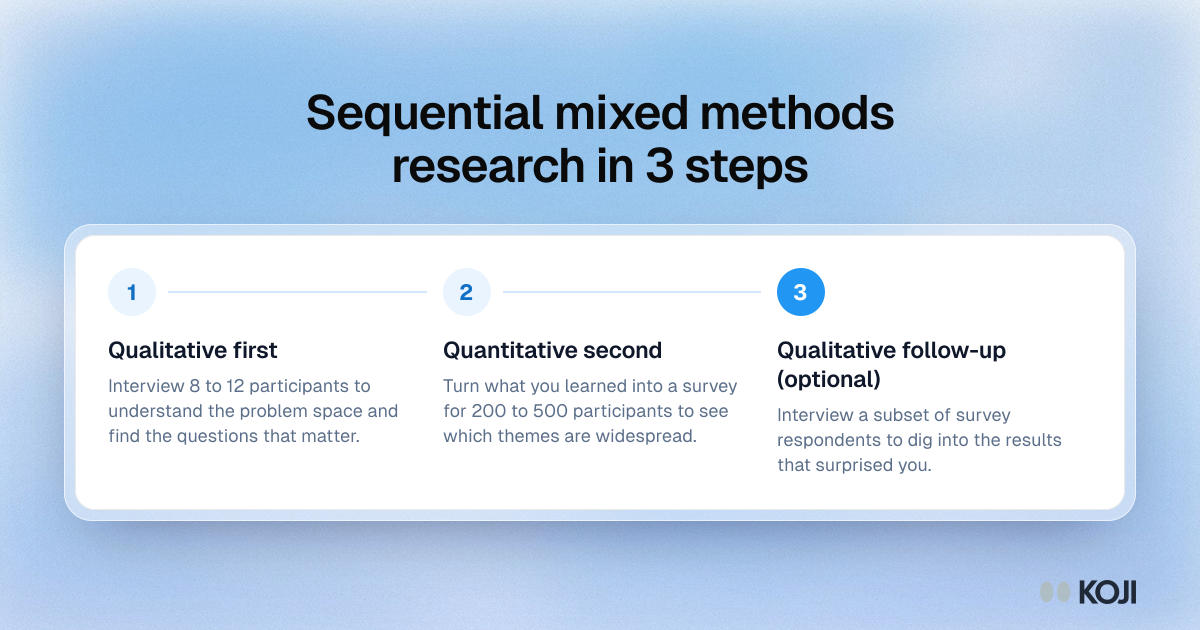
Process showing sequential mixed methods research: interview 8 to 12 people, survey 200 to 500, then optionally interview some survey respondents

Process

Sequential mixed methods research in 3 steps
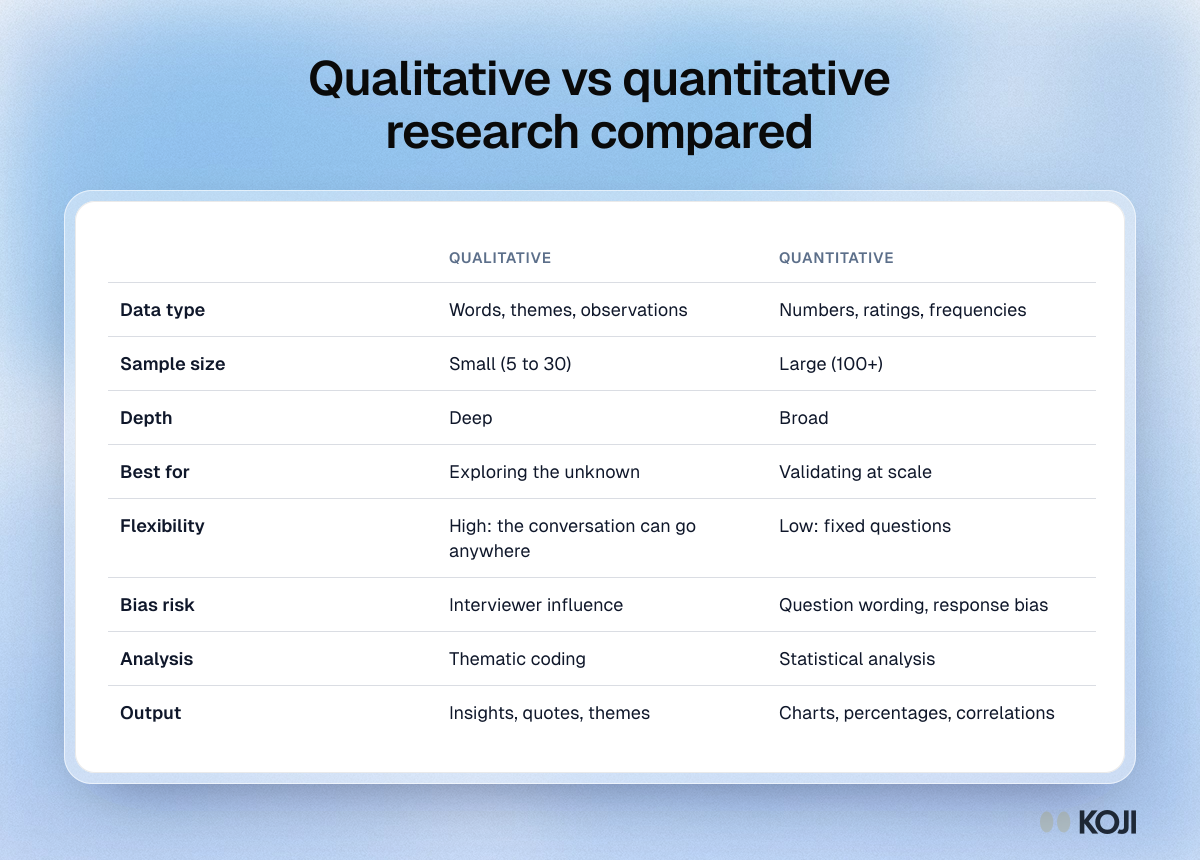
Table comparing qualitative and quantitative research on data type, sample size, depth, best use, flexibility, bias risk, analysis and output

Reference table

Qualitative vs quantitative research compared
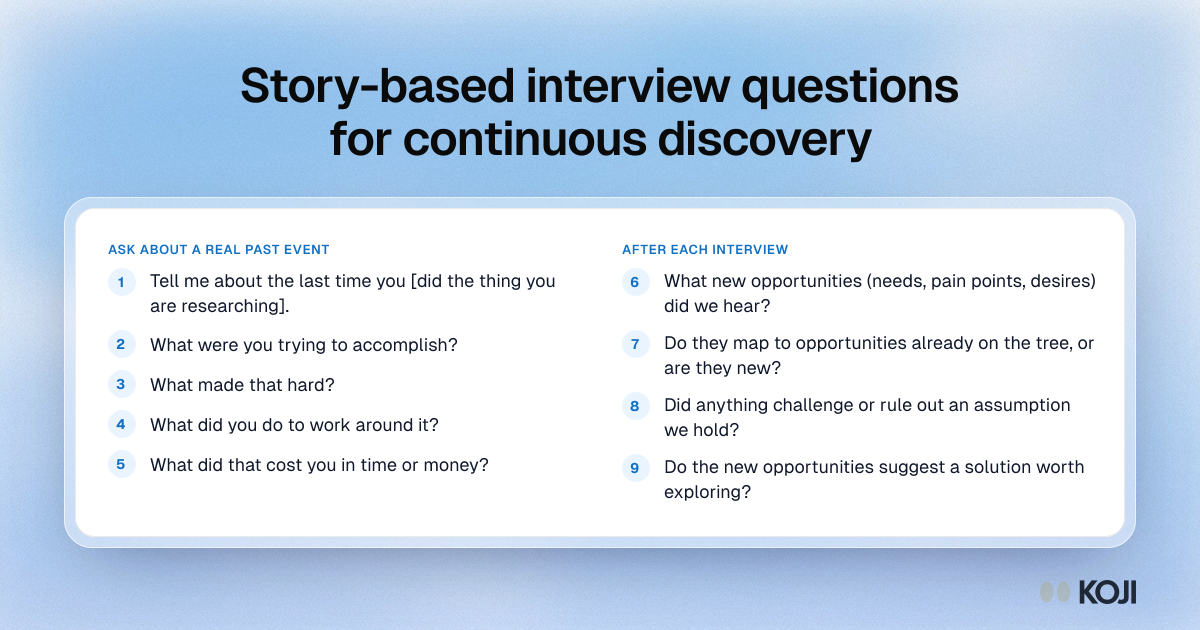
Question bank with five story-based questions about a customer's last real experience and four questions for updating the opportunity tree afterwards

Question bank

Story-based interview questions for continuous discovery
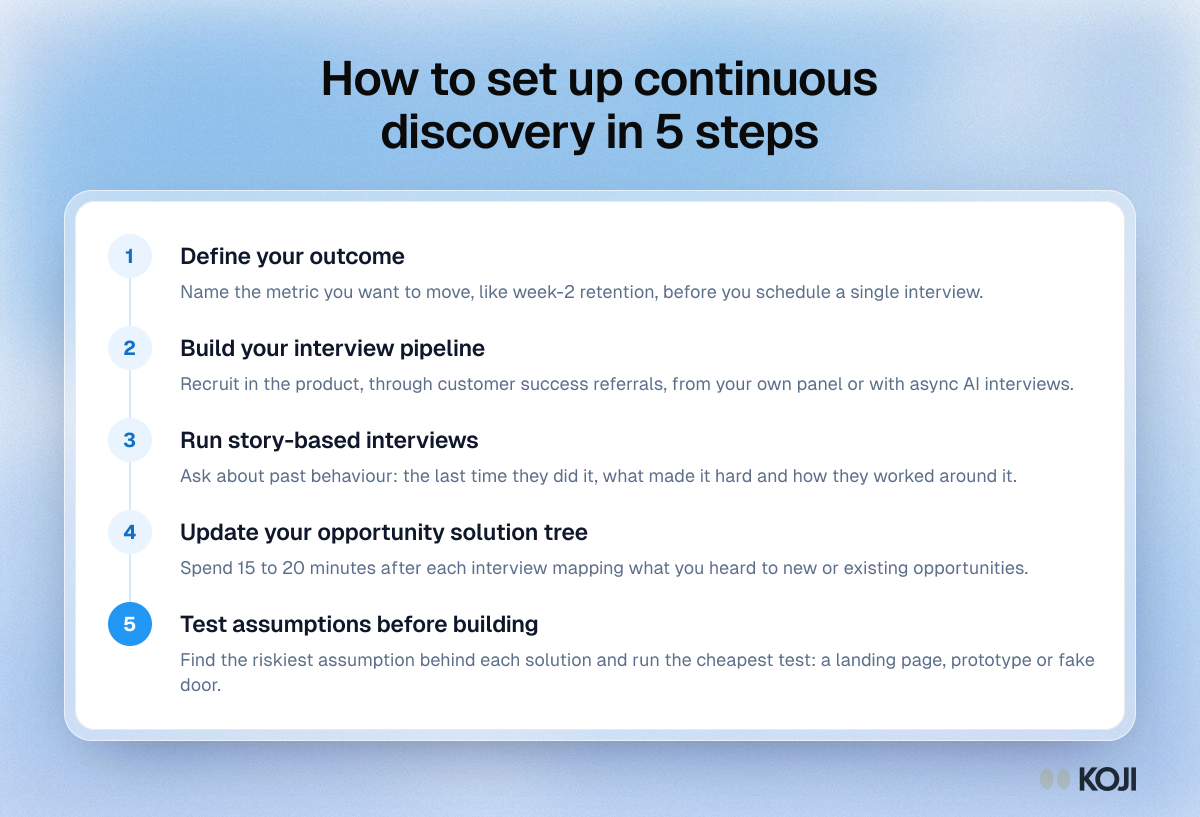
Process showing five steps to set up continuous discovery: define the outcome, build a pipeline, run story-based interviews, update the tree, test assumptions

Process

How to set up continuous discovery in 5 steps
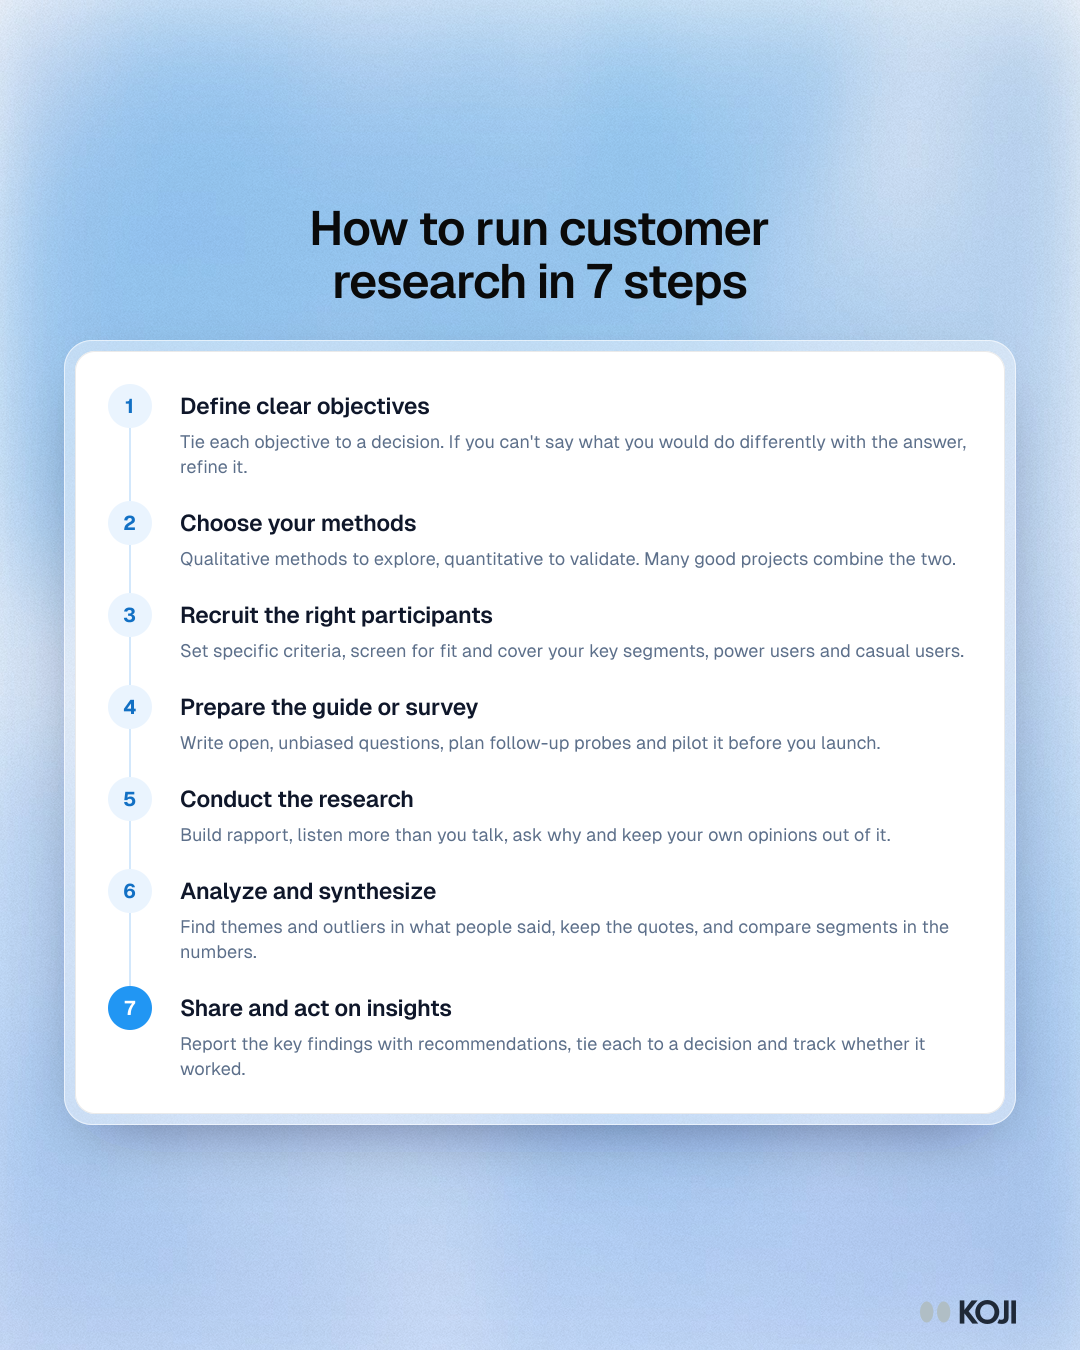
Process showing seven steps of customer research: define objectives, choose methods, recruit, prepare, conduct, analyze and act on insights

Process

How to run customer research in 7 steps
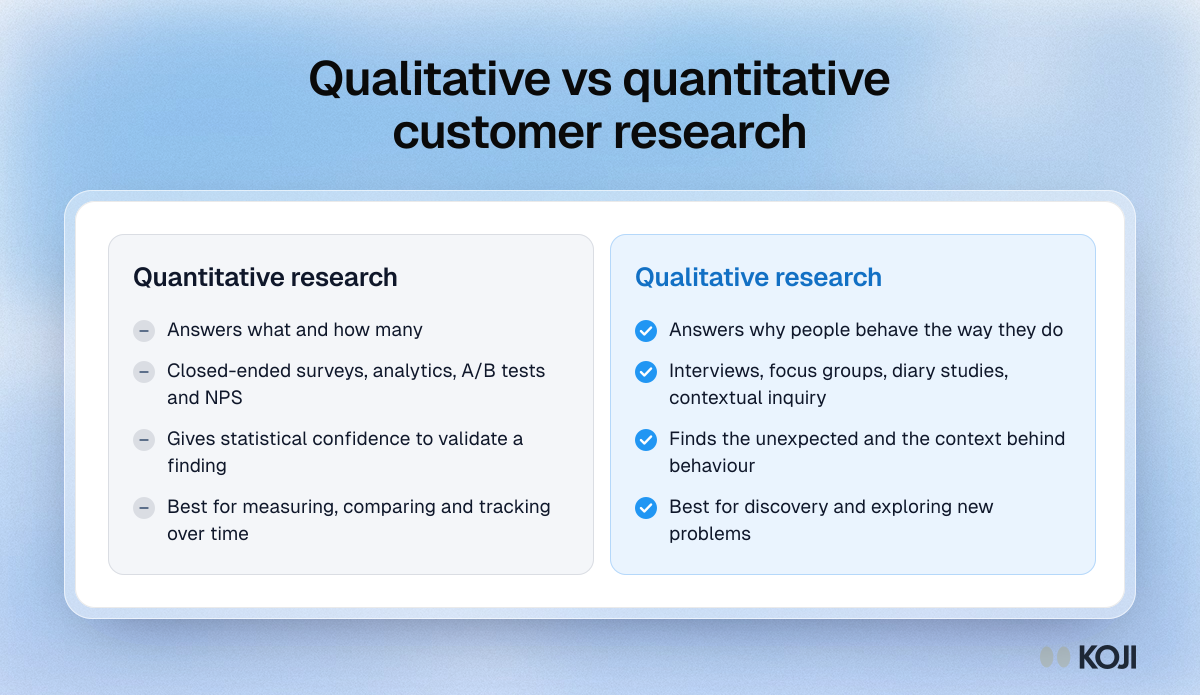
Comparison of quantitative research, which answers what and how many, and qualitative research, which answers why, with methods for each

Comparison

Qualitative vs quantitative customer research
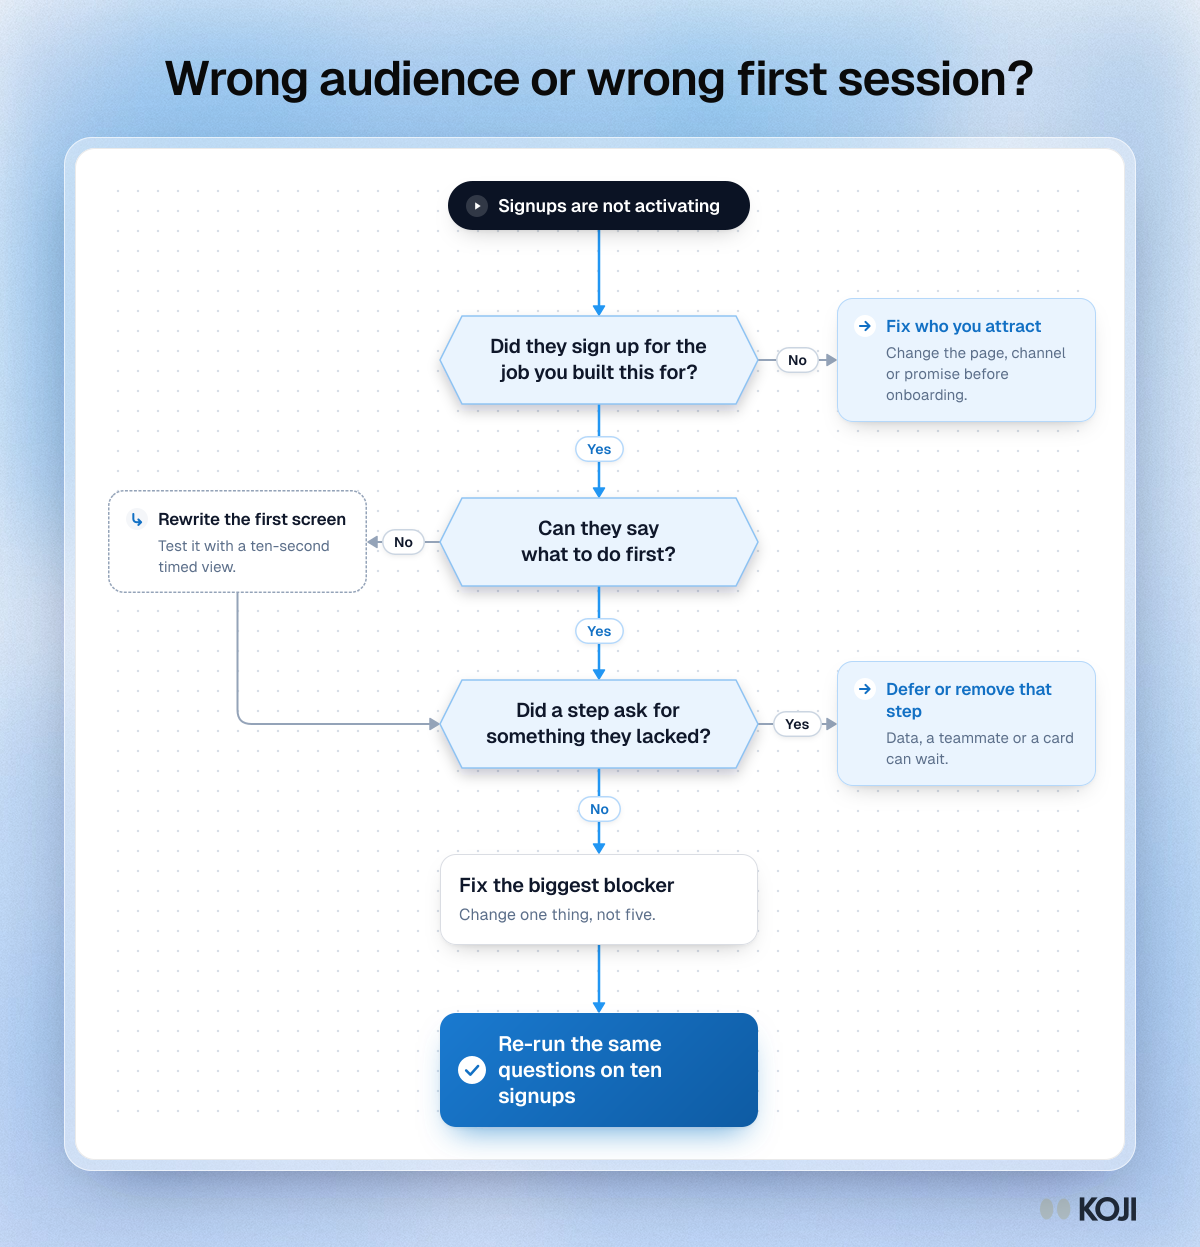
Flowchart for low activation: three questions that lead to fixing who you attract, rewriting the first screen or removing a blocking step.

Flowchart

Wrong audience or wrong first session?
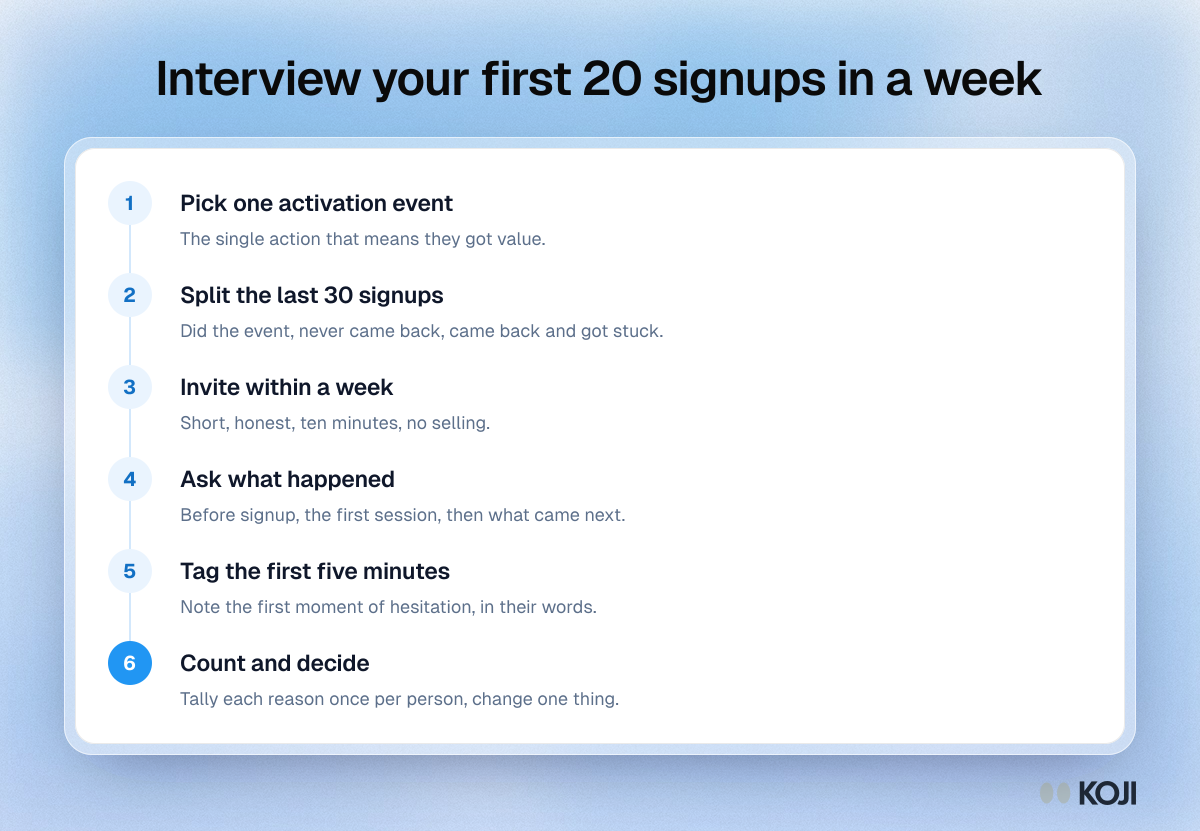
Process showing six steps for interviewing early signups in a week: pick an activation event, split signups, invite, ask, tag and decide.

Process

Interview your first 20 signups in a week
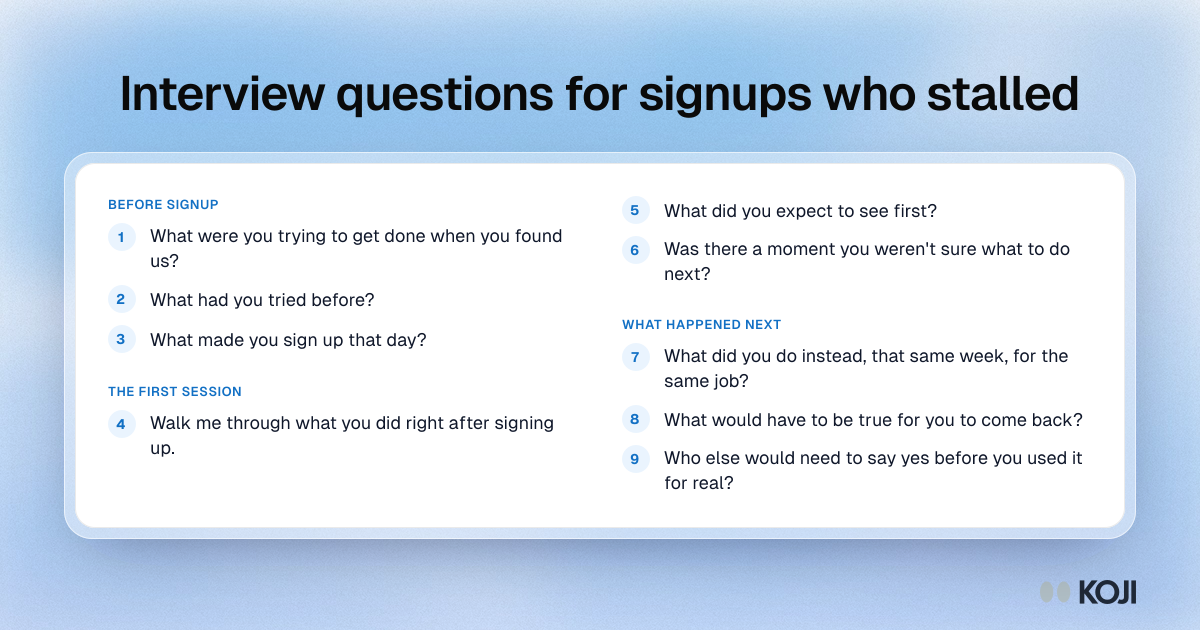
Question bank of nine interview questions for signups who stalled, in three parts: before signup, the first session and what happened next.

Question bank

Interview questions for signups who stalled
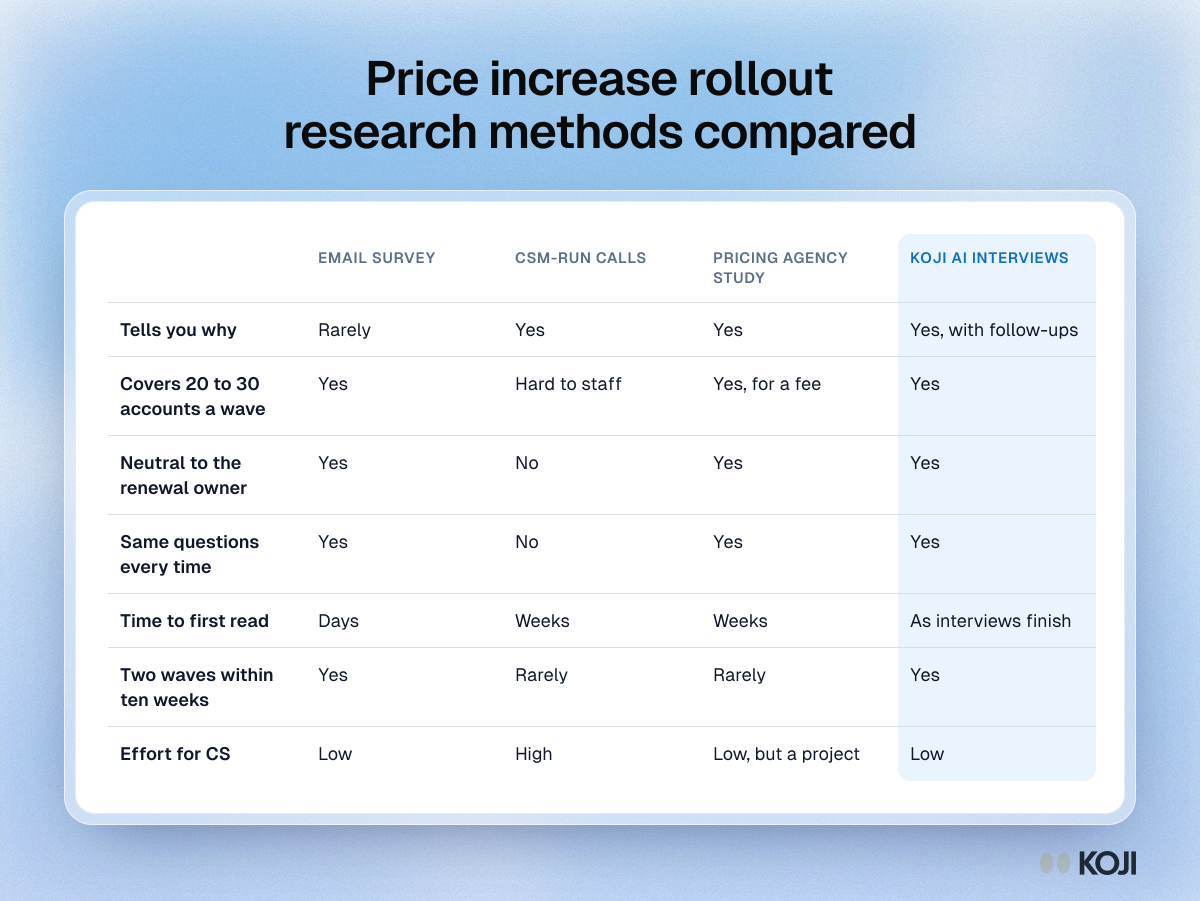
Table comparing an email survey, CSM-run calls, a pricing agency study and Koji AI interviews on depth, coverage, neutrality, speed and effort.

Reference table

Price increase rollout research methods compared
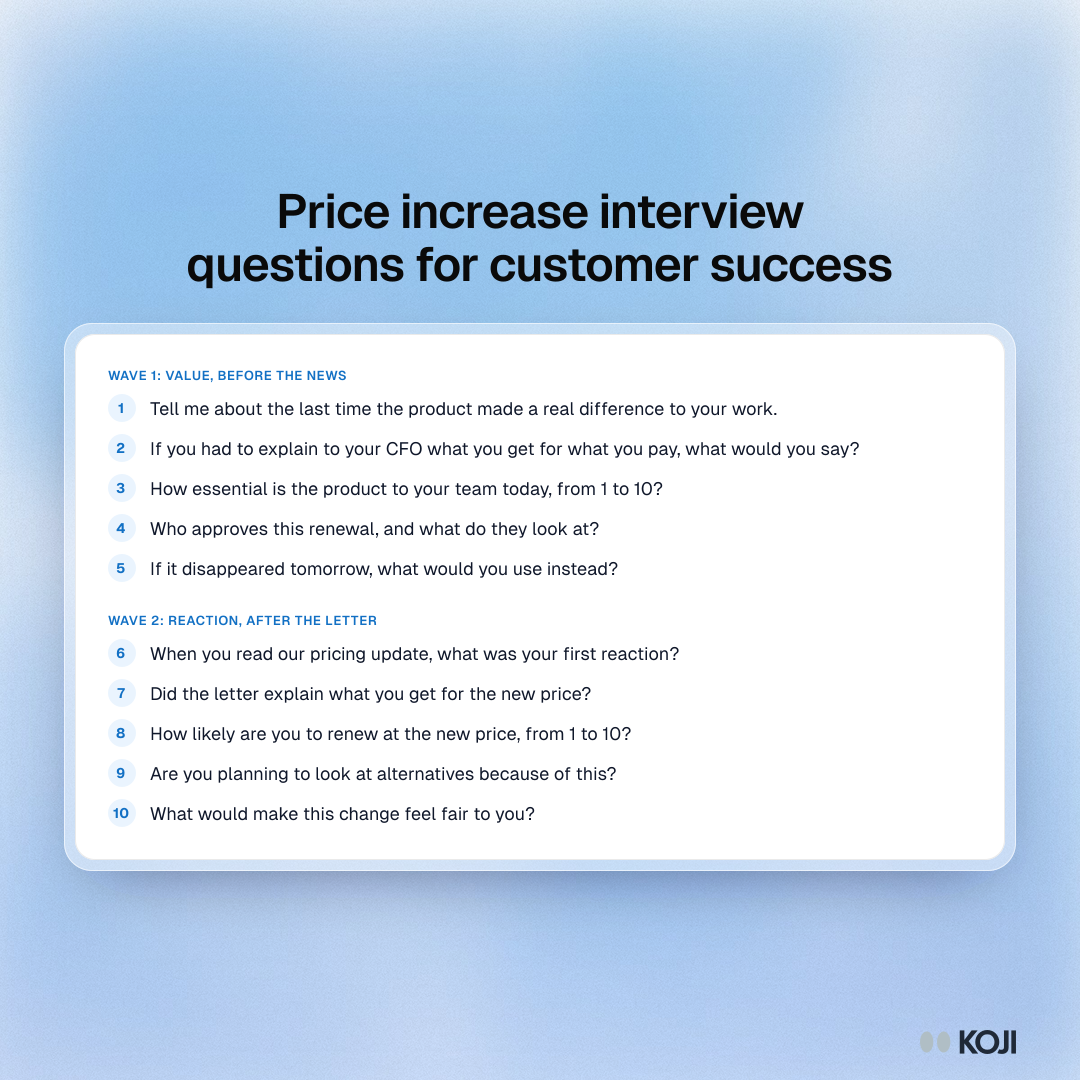
Question bank for price increase rollout interviews: five value questions to ask before the announcement and five reaction questions to ask after it.

Question bank

Price increase interview questions for customer success
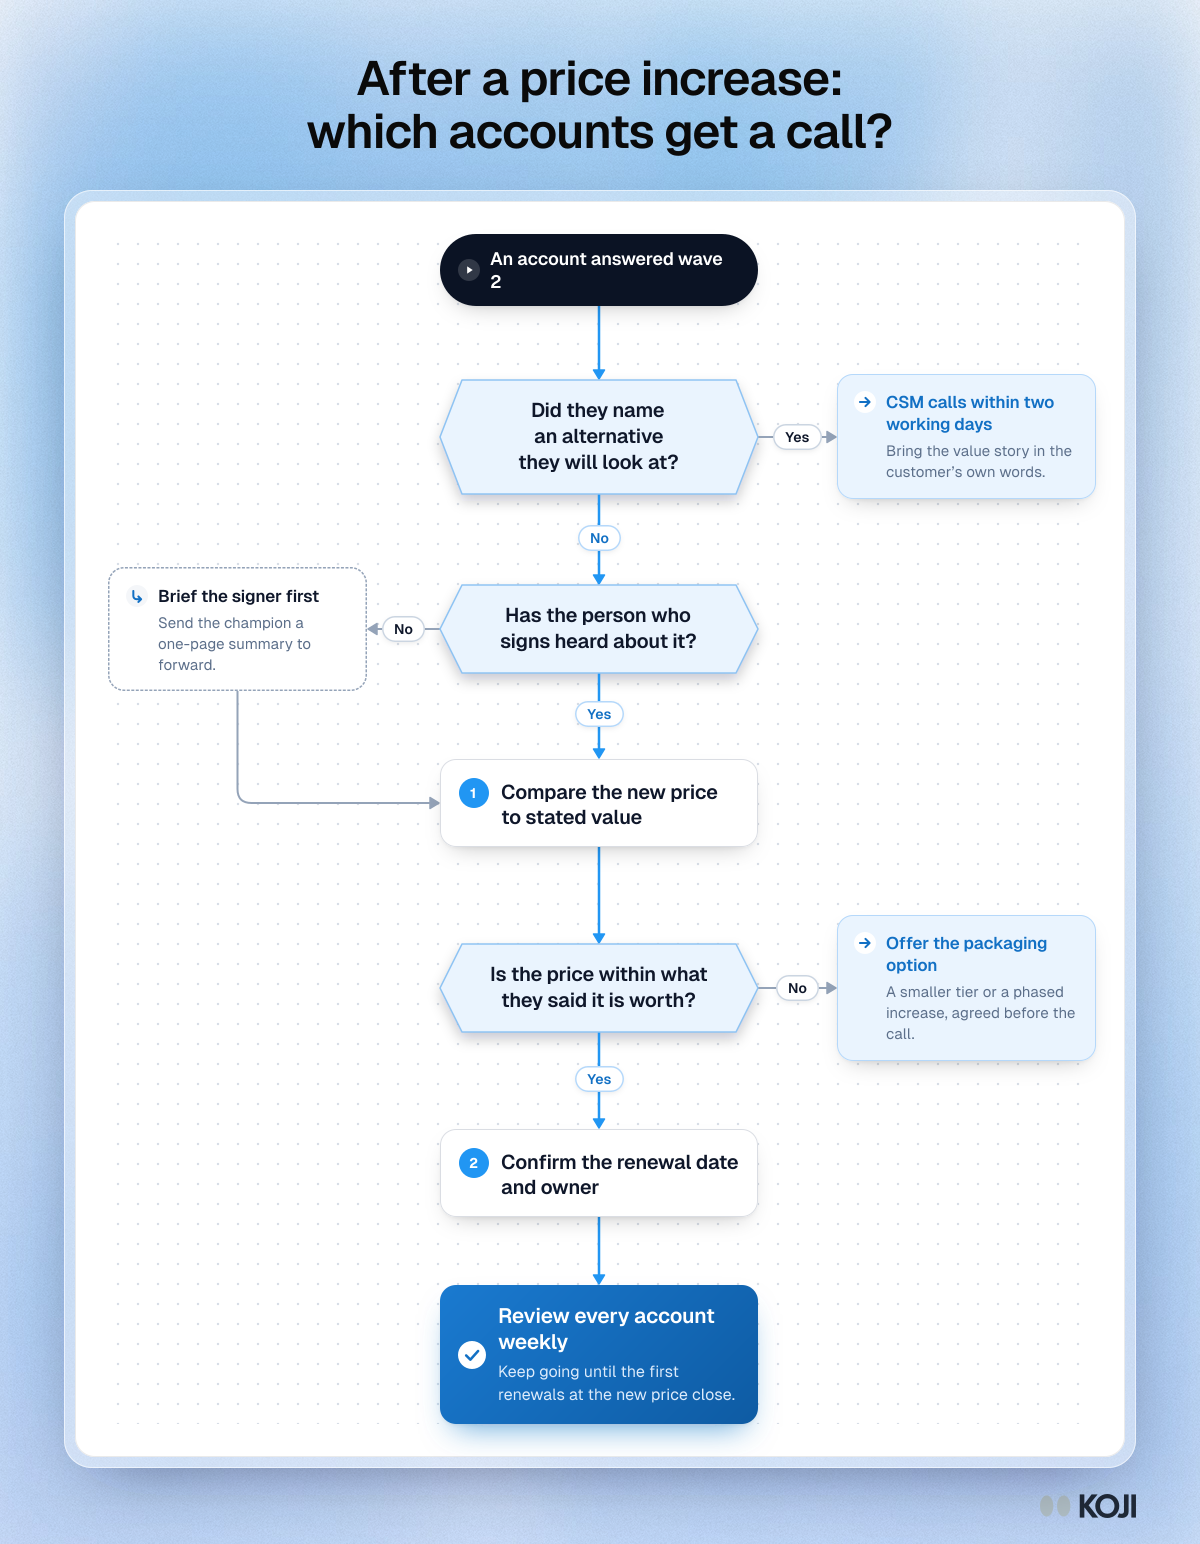
Flowchart for triaging accounts after a price increase: three questions, one side step to brief the signer, ending in a weekly account review.

Flowchart

After a price increase: which accounts get a call?
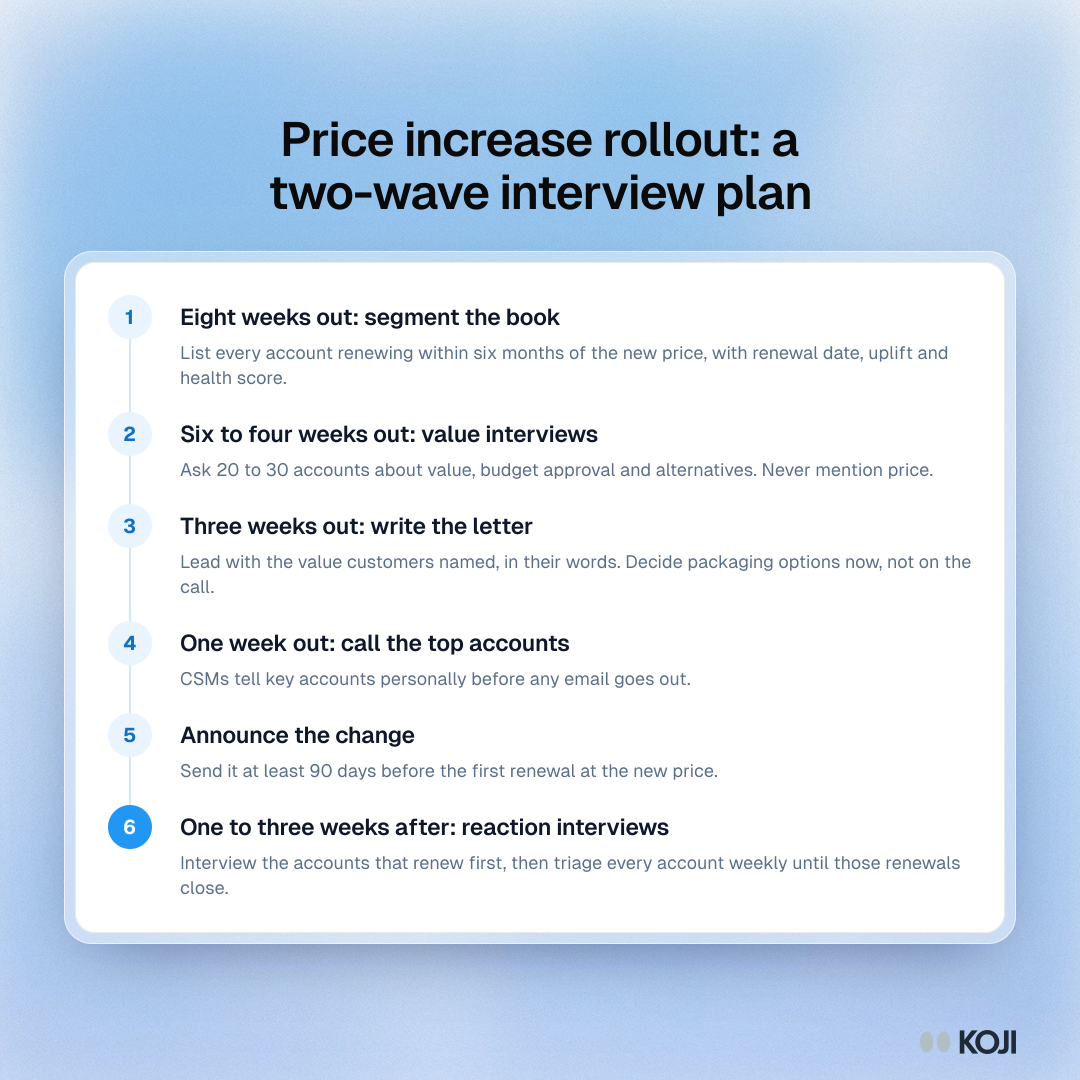
Process of six steps for a price rise rollout: segment the book, value interviews, write the letter, call top accounts, announce, reaction interviews.

Process

Price increase rollout: a two-wave interview plan
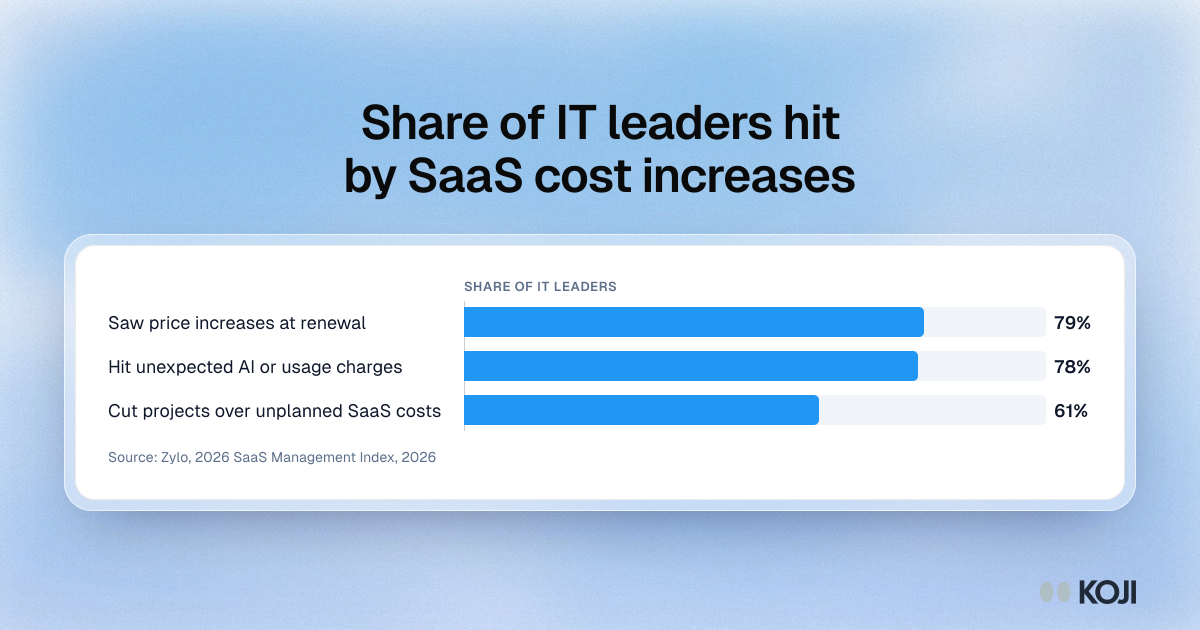
Bar chart of IT leaders hit by SaaS cost increases in the past year: 79% saw renewal price rises, 78% unexpected AI or usage charges, 61% cut projects.
Bar chart

Share of IT leaders hit by SaaS cost increases

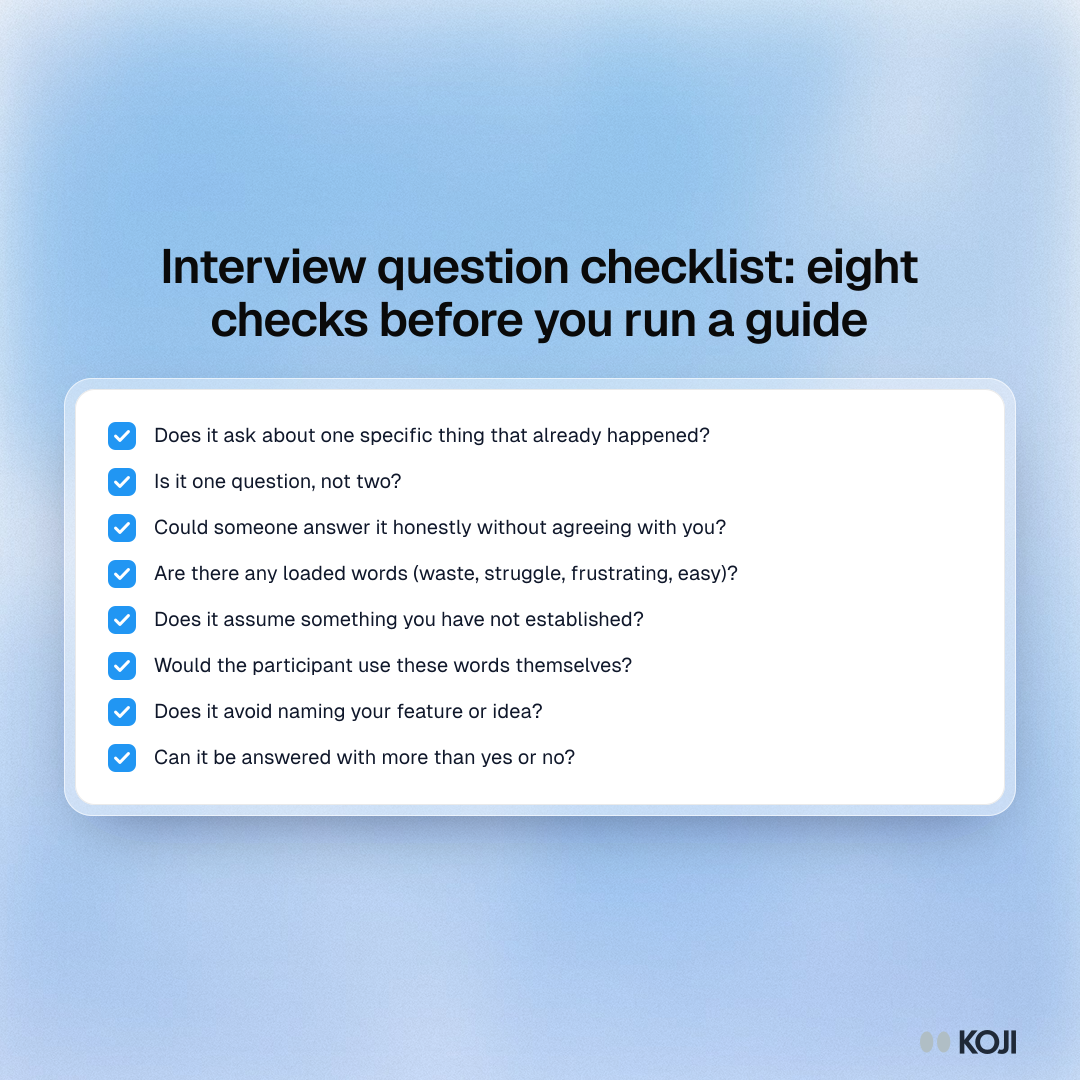
Checklist of eight checks for interview questions, from asking about one real past moment to using neutral words, one topic per question and no feature names.

Checklist

Interview question checklist: eight checks before you run a guide
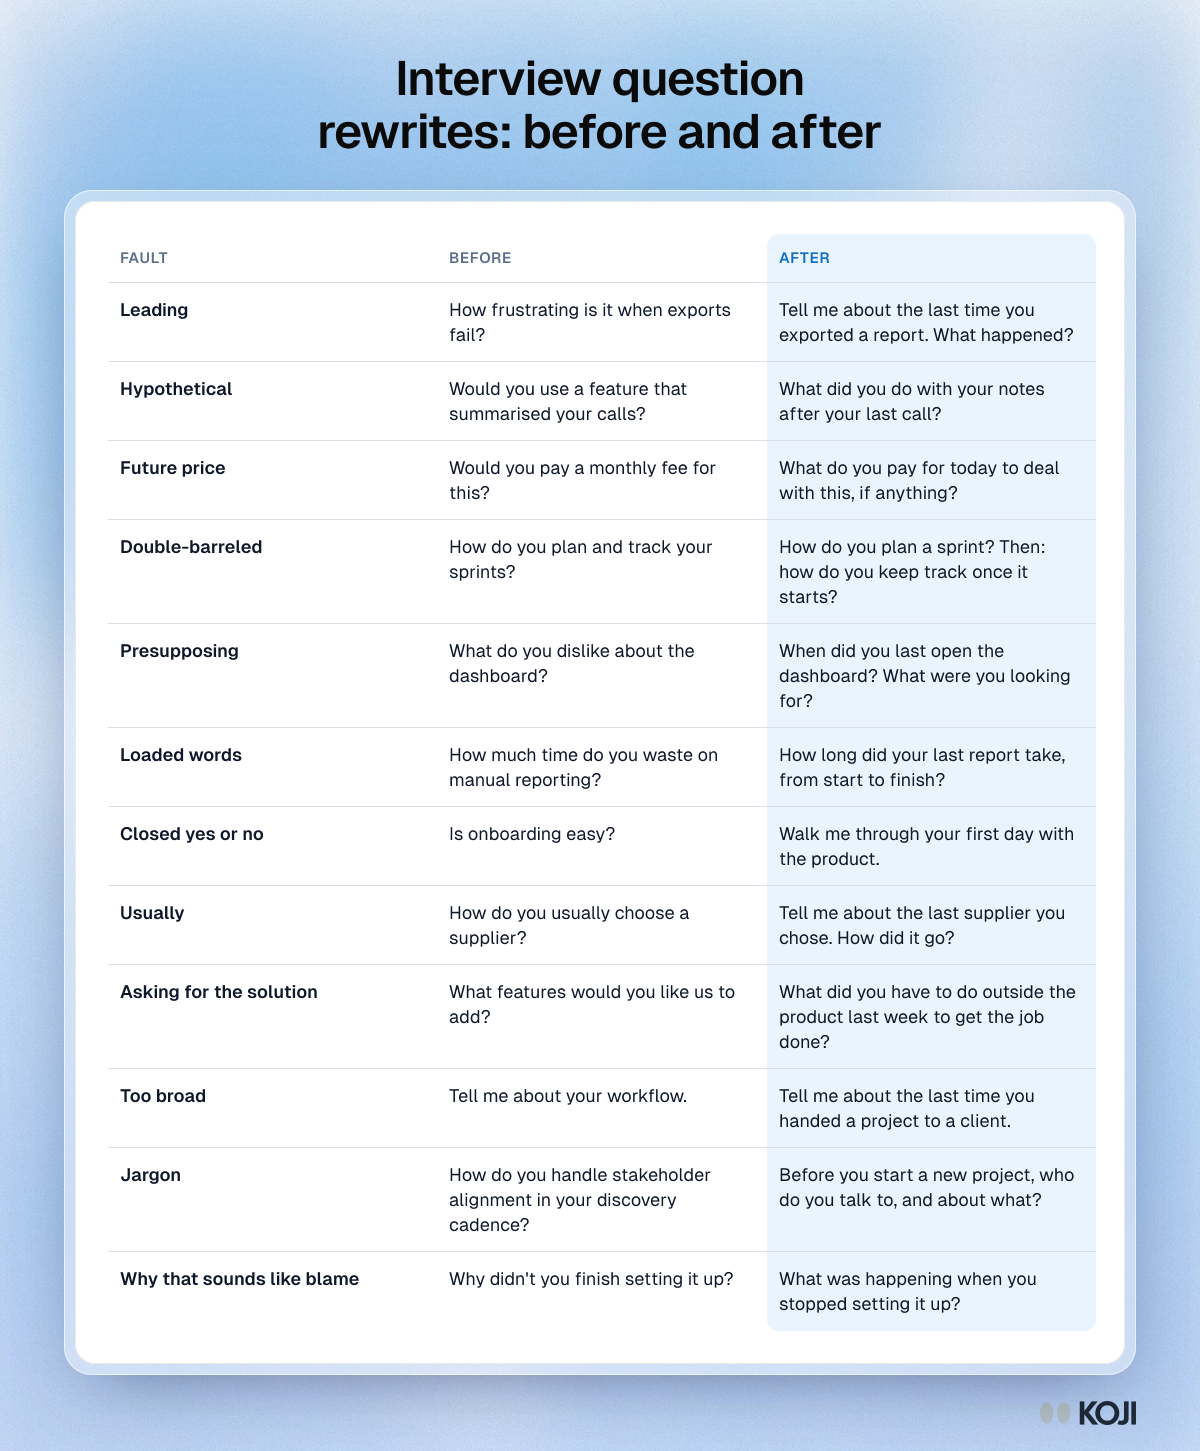
Table of twelve interview question rewrites: the fault, the original question and a better version for each, from leading and hypothetical to too broad.

Reference table

Interview question rewrites: before and after
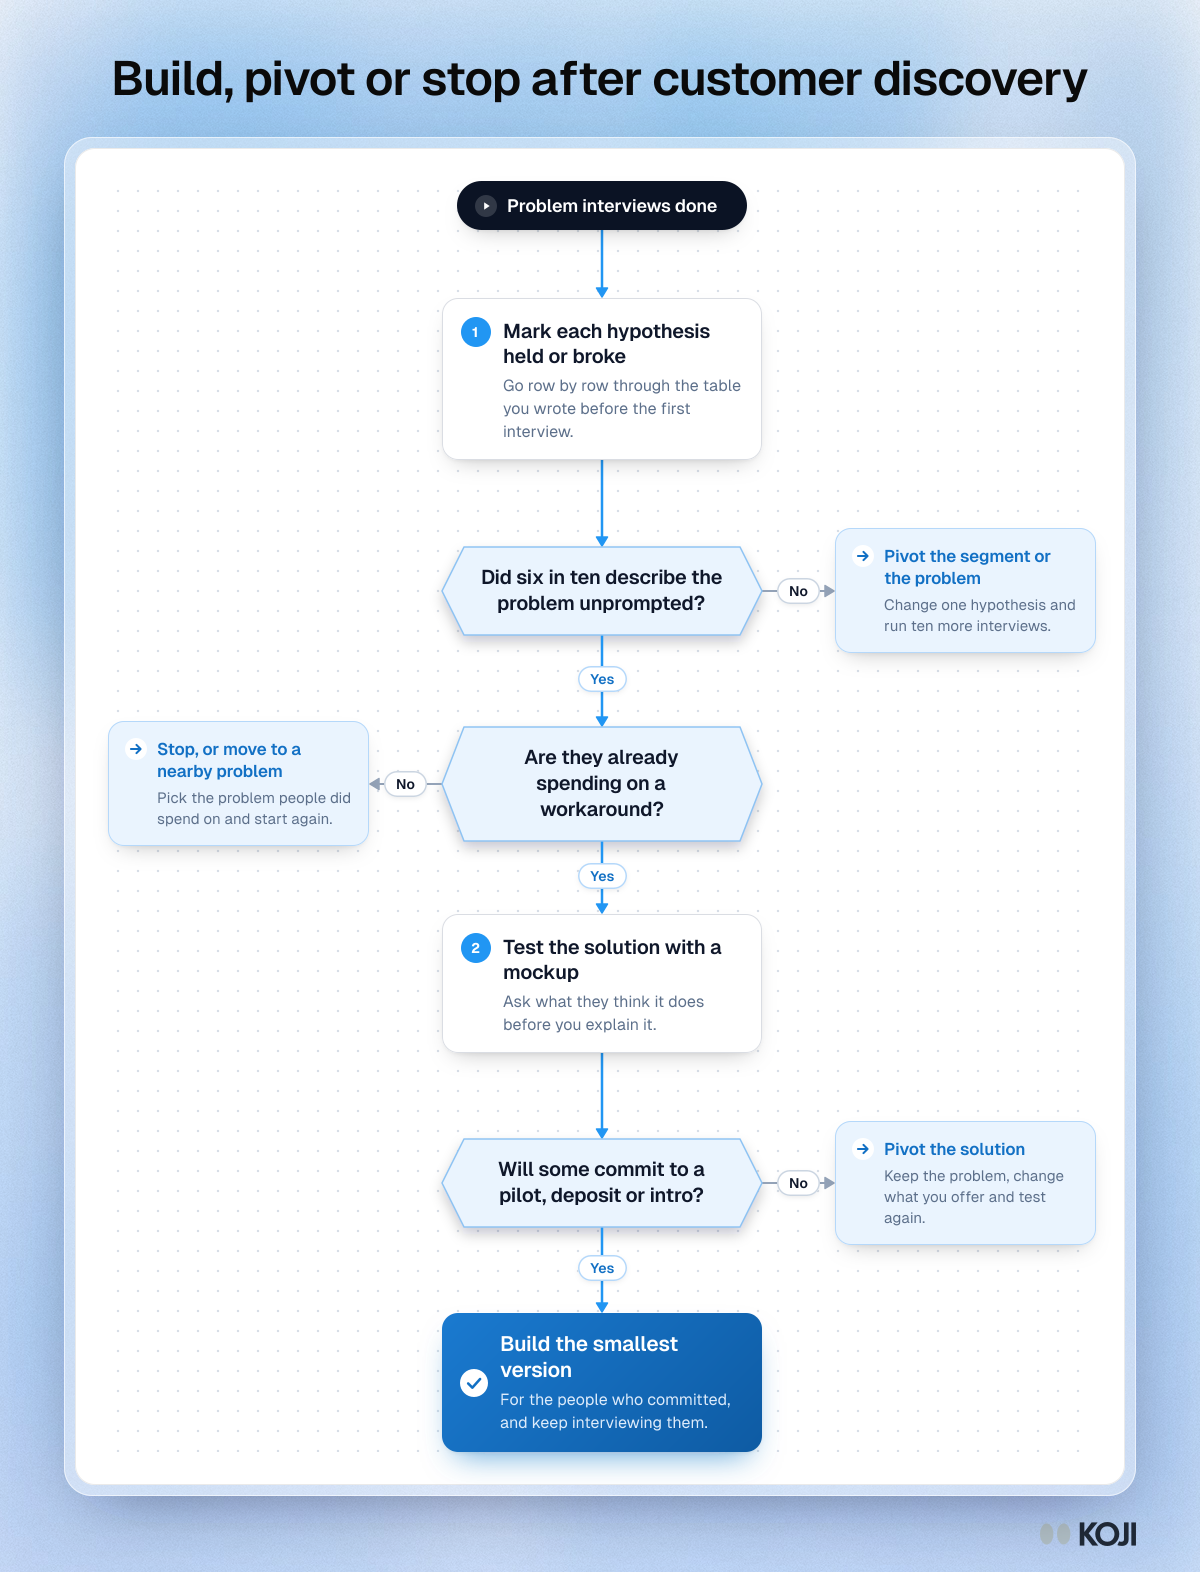
Flowchart for deciding after customer discovery: three questions on the problem, workaround spend and commitments, ending in building the smallest version.

Flowchart

Build, pivot or stop after customer discovery
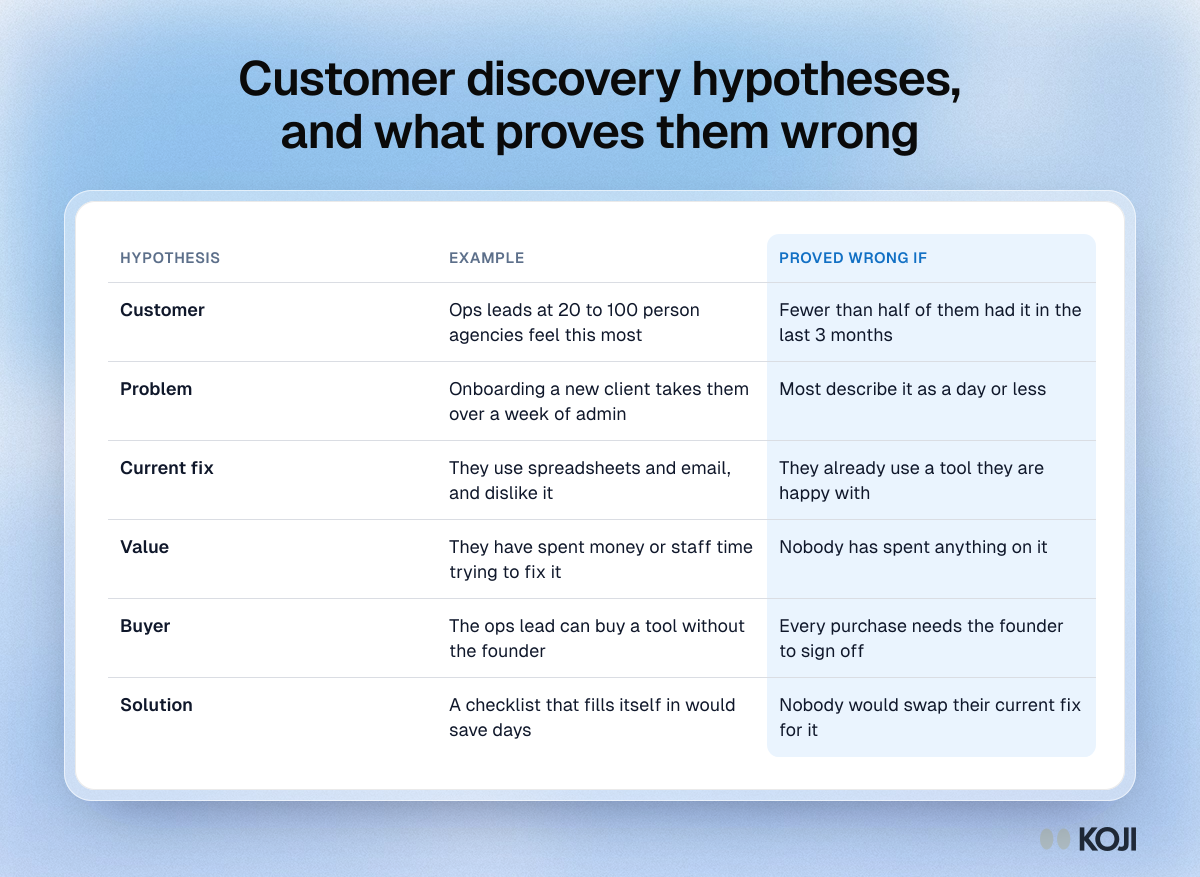
Table of six customer discovery hypotheses: customer, problem, current fix, value, buyer and solution, each with an example and what would prove it wrong.

Reference table

Customer discovery hypotheses, and what proves them wrong
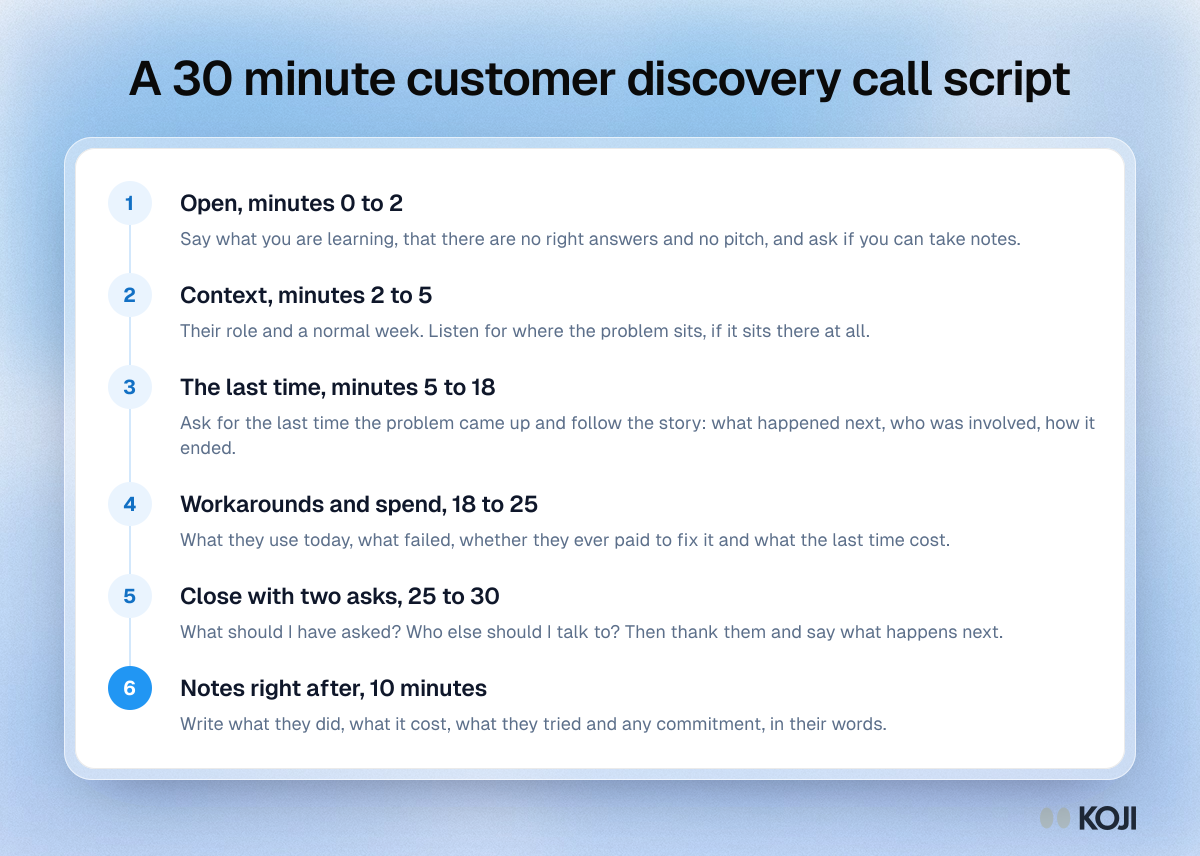
Process of a 30 minute discovery call script in six parts: open, get context, the last time story, workarounds and spend, close with asks, then write notes.

Process

A 30 minute customer discovery call script
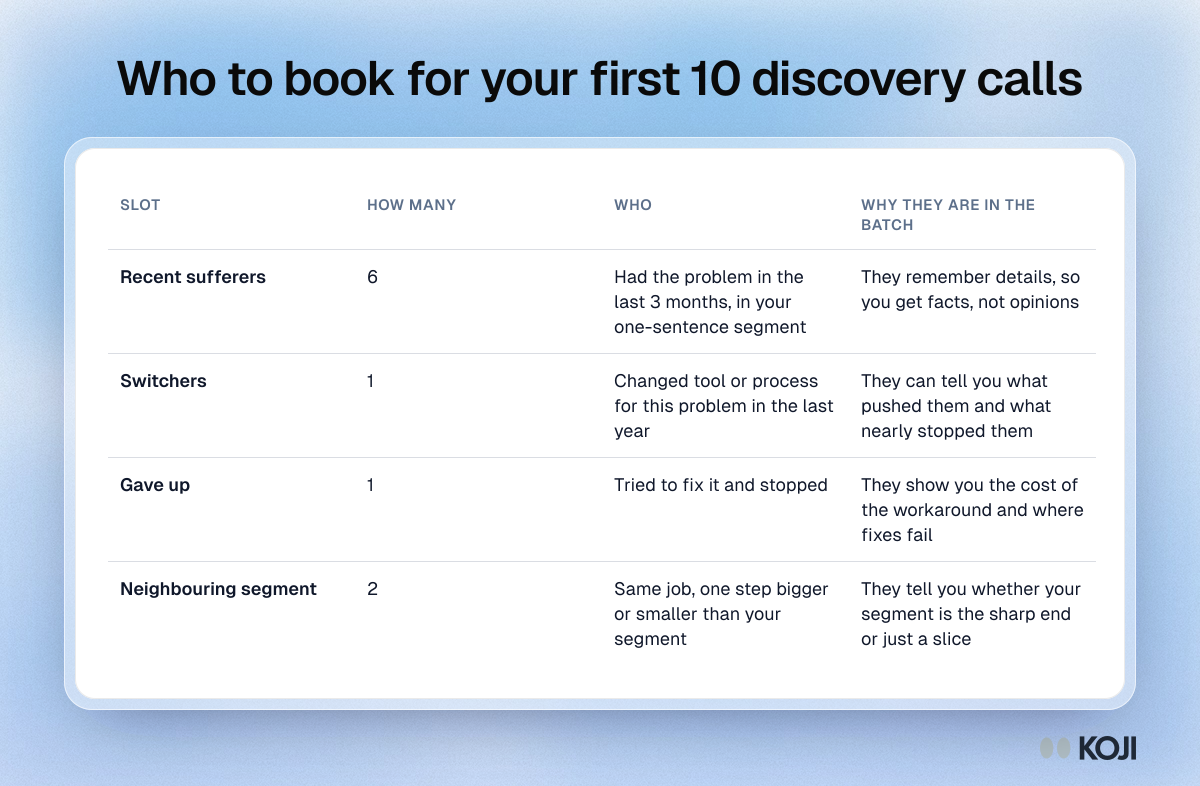
Table of the first ten discovery calls: six recent sufferers, one switcher, one who gave up and two from a neighbouring segment, with why each is there.

Reference table

Who to book for your first 10 discovery calls
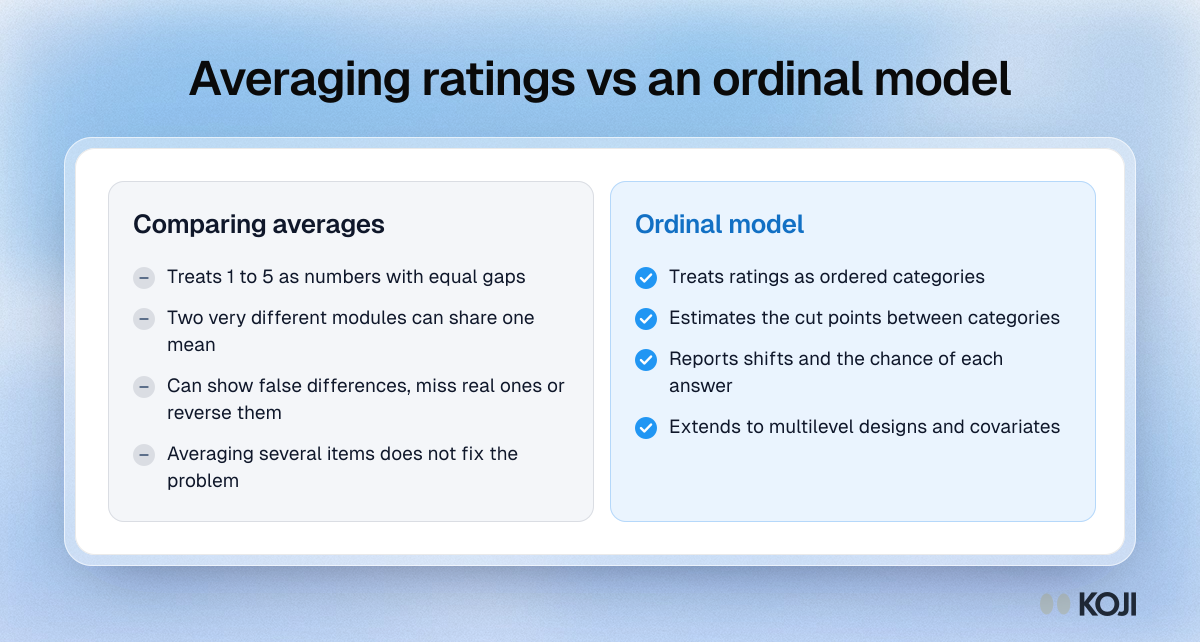
Comparison of averaging course evaluation ratings with fitting an ordinal model, showing what each assumes about the scale and what each reports.

Comparison

Averaging ratings vs an ordinal model
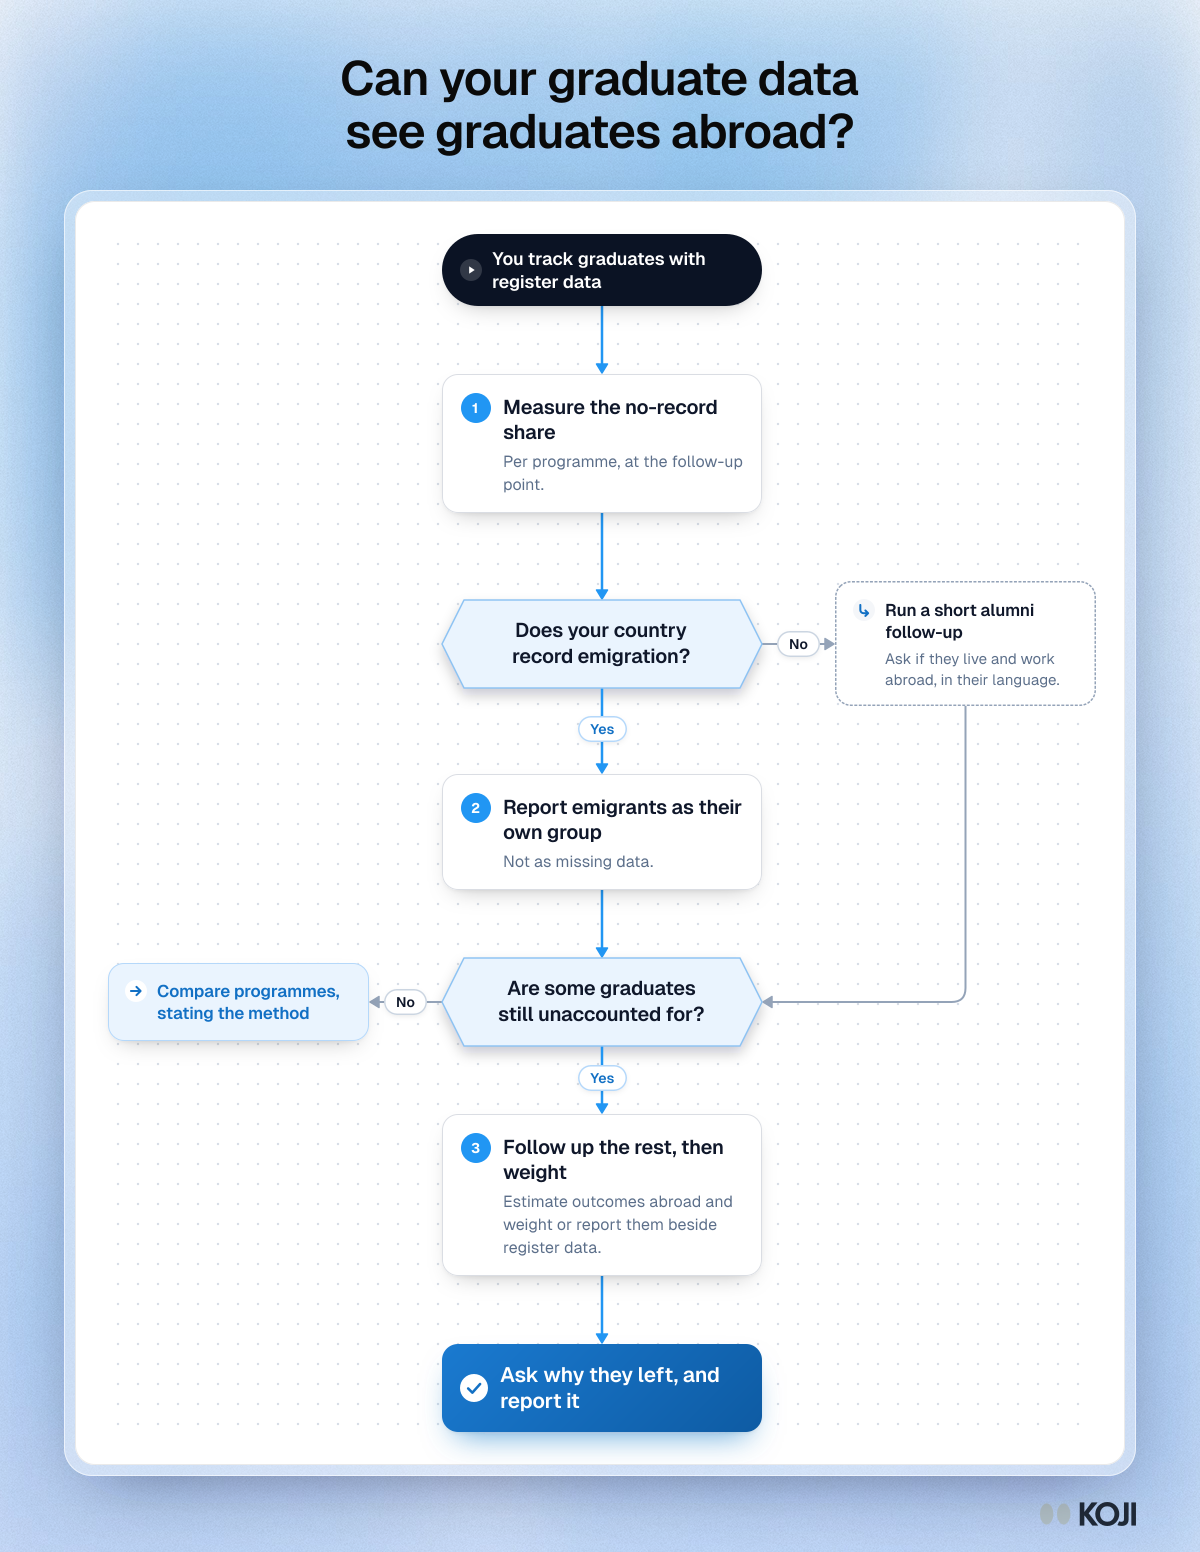
Flowchart for checking whether graduate tracking can see graduates who moved abroad: two questions, a side step for an alumni follow-up, ending in asking why.

Flowchart

Can your graduate data see graduates abroad?
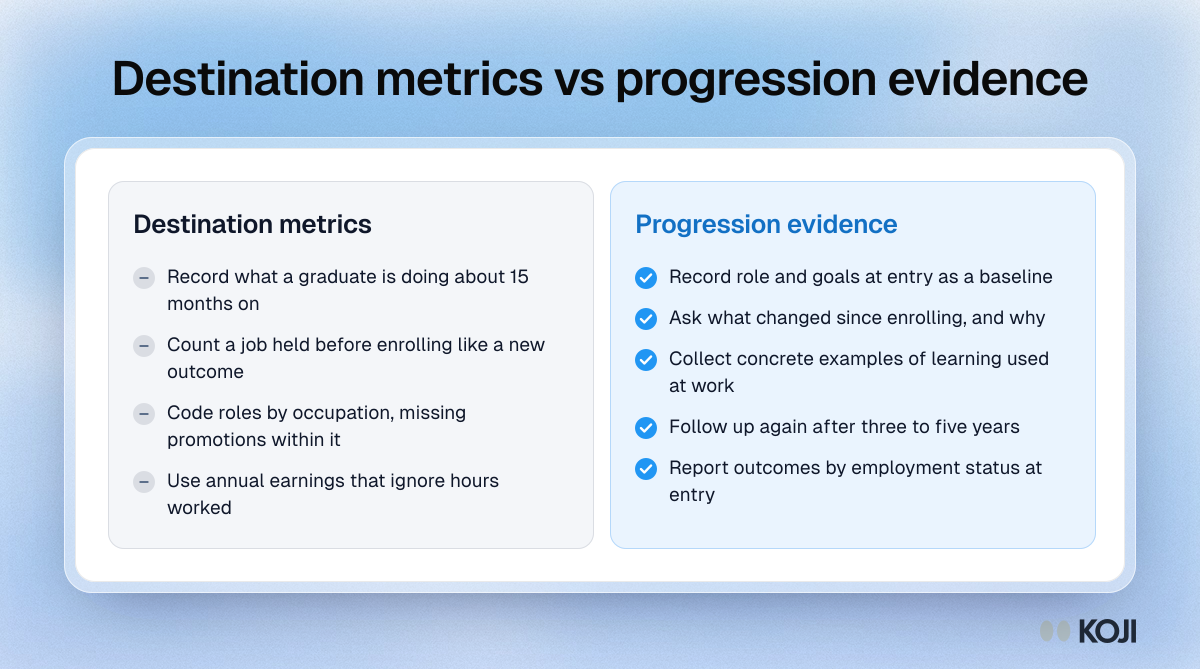
Comparison of destination metrics with progression evidence for mature and part-time graduates, showing what each records and what it misses.

Comparison

Destination metrics vs progression evidence
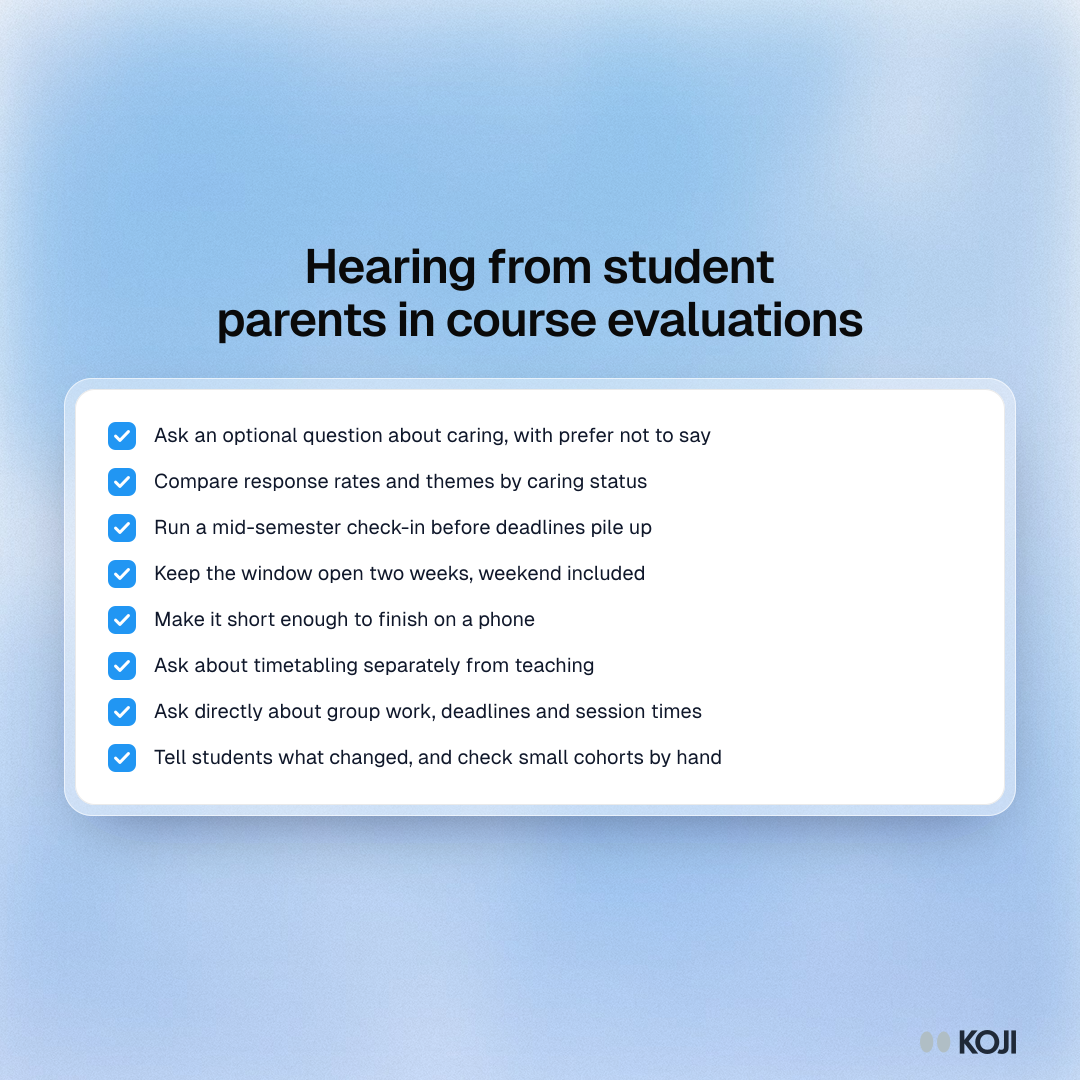
Checklist of eight steps for hearing from student parents and carers in course evaluations, from asking about caring status to reporting back.

Checklist

Hearing from student parents in course evaluations
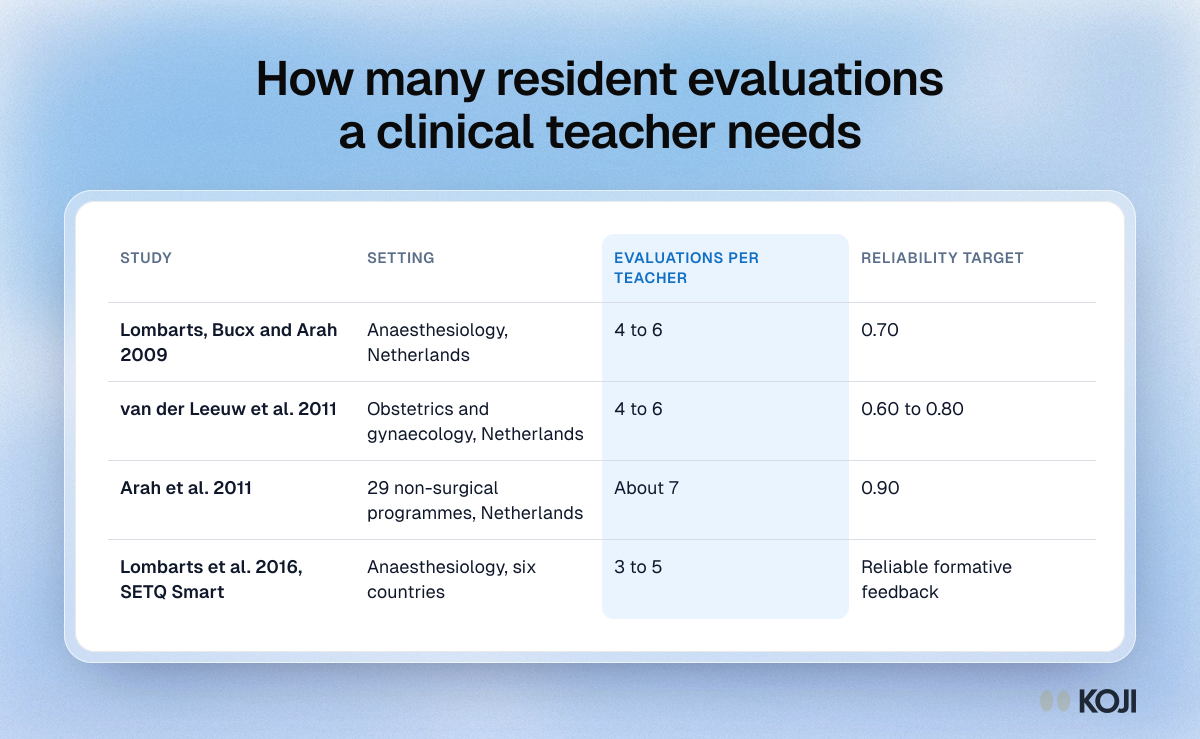
Table comparing four SETQ studies: how many resident evaluations each clinical teacher needs, from 3 to 5 up to about 7, and the reliability targeted.

Reference table

How many resident evaluations a clinical teacher needs
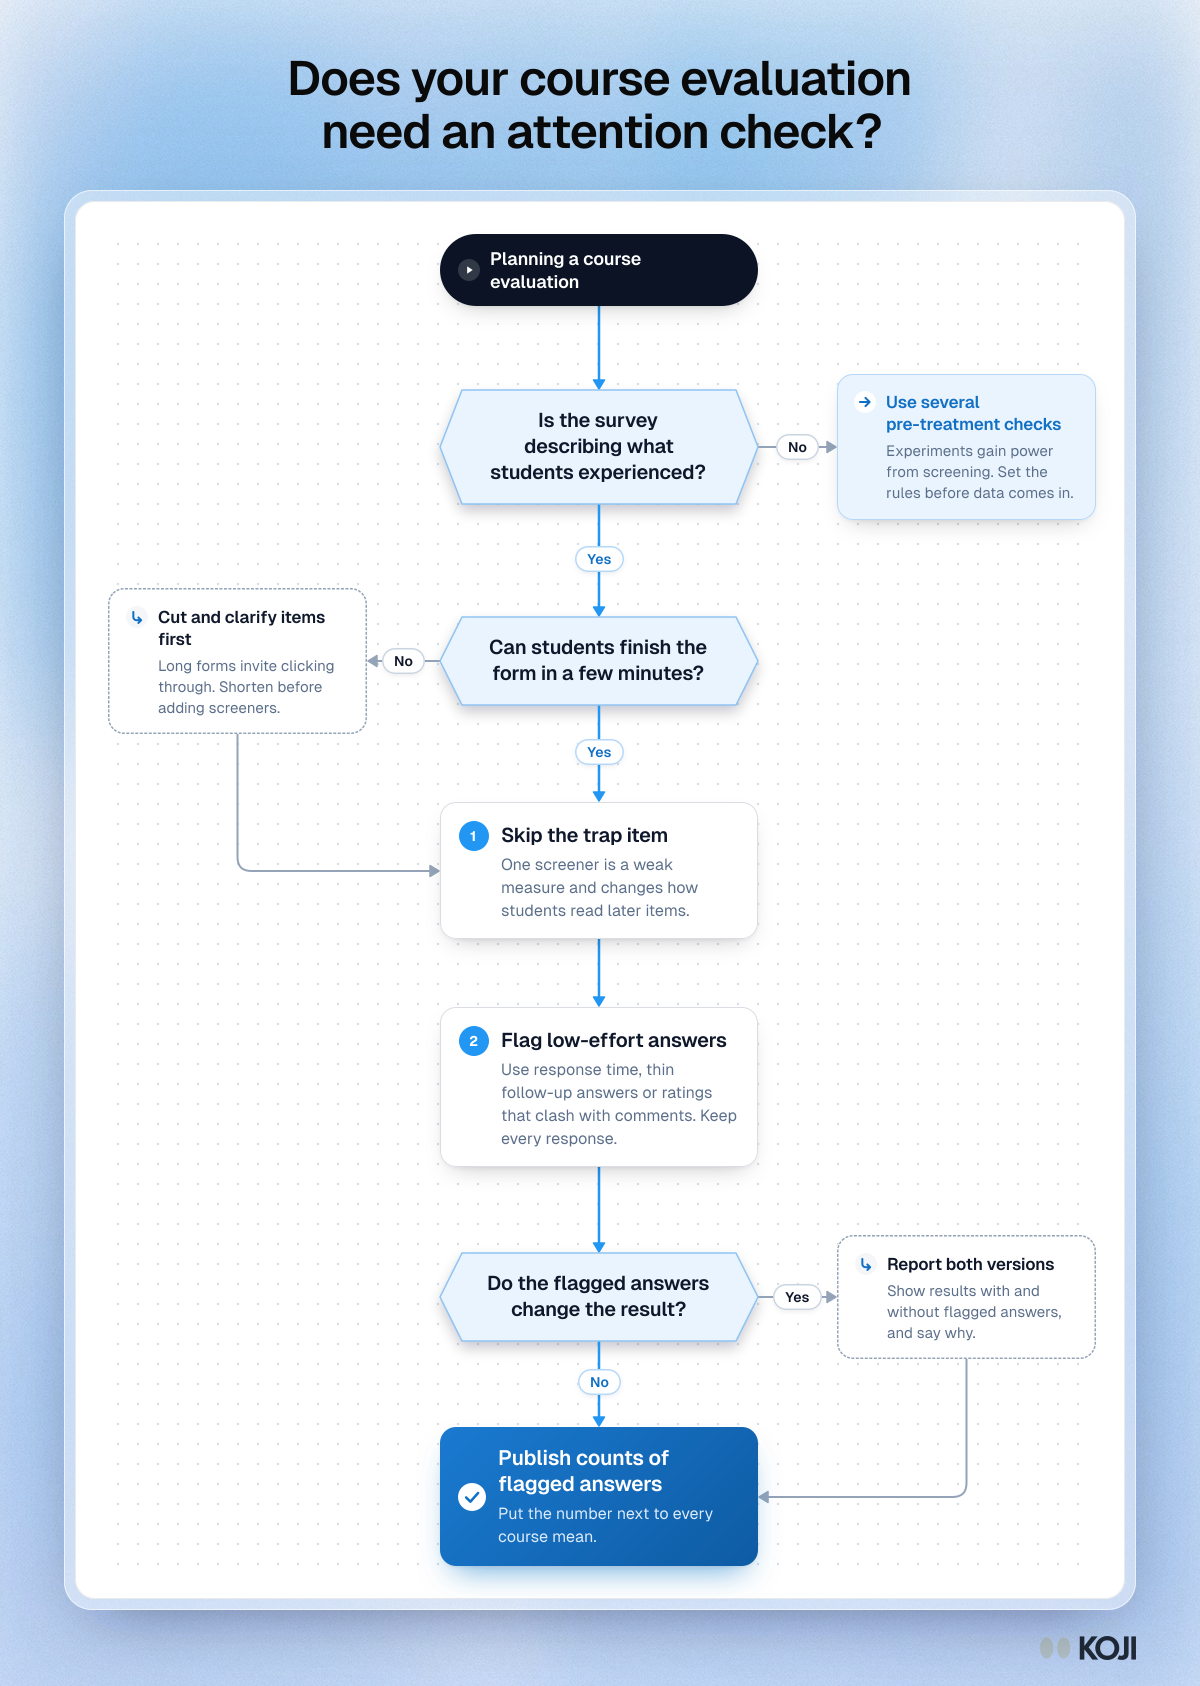
Flowchart for deciding whether a course evaluation needs an attention check: three questions, two side steps, ending in published counts of flagged answers.

Flowchart

Does your course evaluation need an attention check?
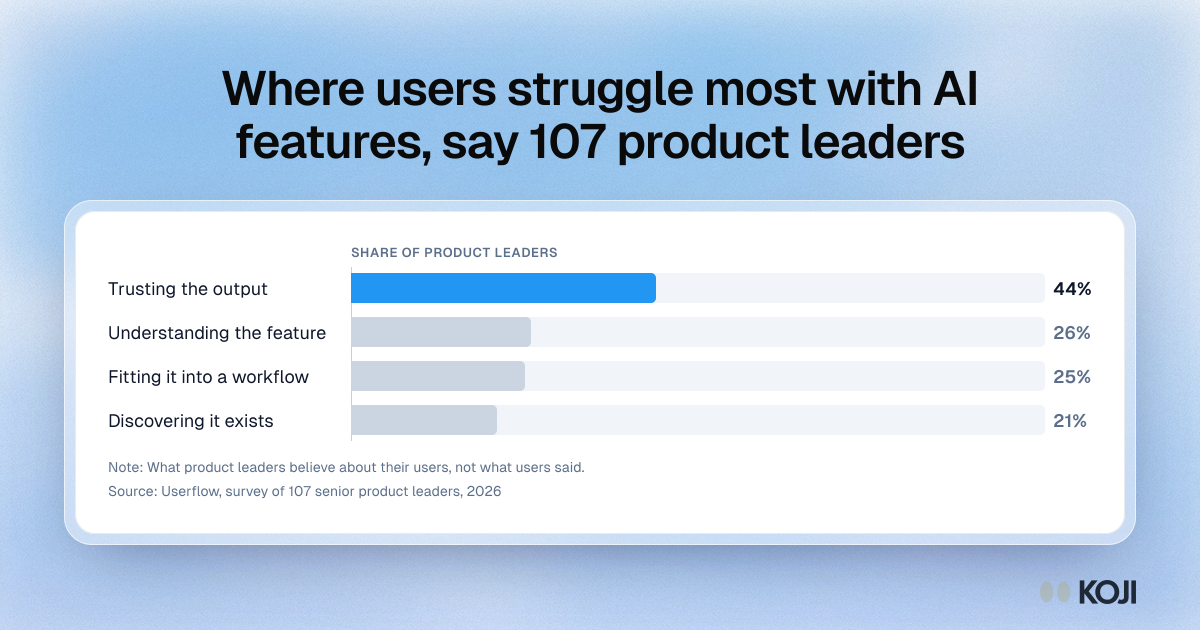
Bar chart of where product leaders say users struggle with AI features: trusting the output 44%, understanding it 26%, workflow fit 25%, discovery 21%.

Bar chart

Where users struggle most with AI features, say 107 product leaders
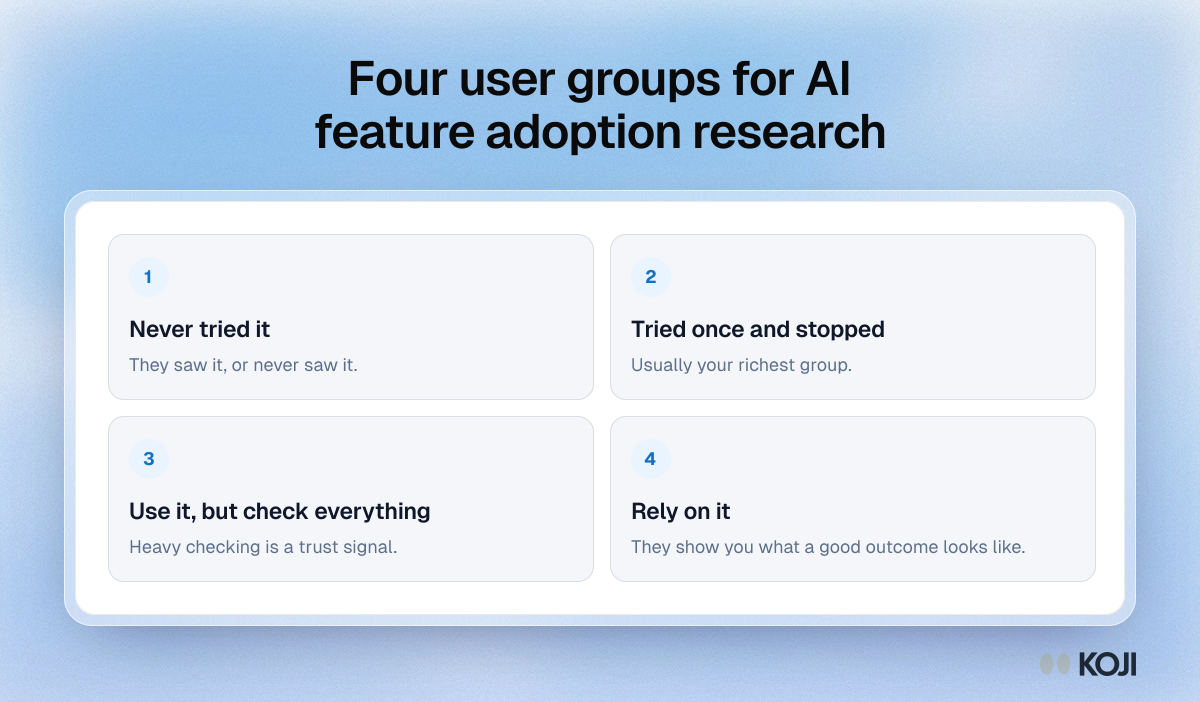
Framework of four groups to sample for AI feature adoption research: never tried it, tried once and stopped, use it but check everything, rely on it.

Framework

Four user groups for AI feature adoption research
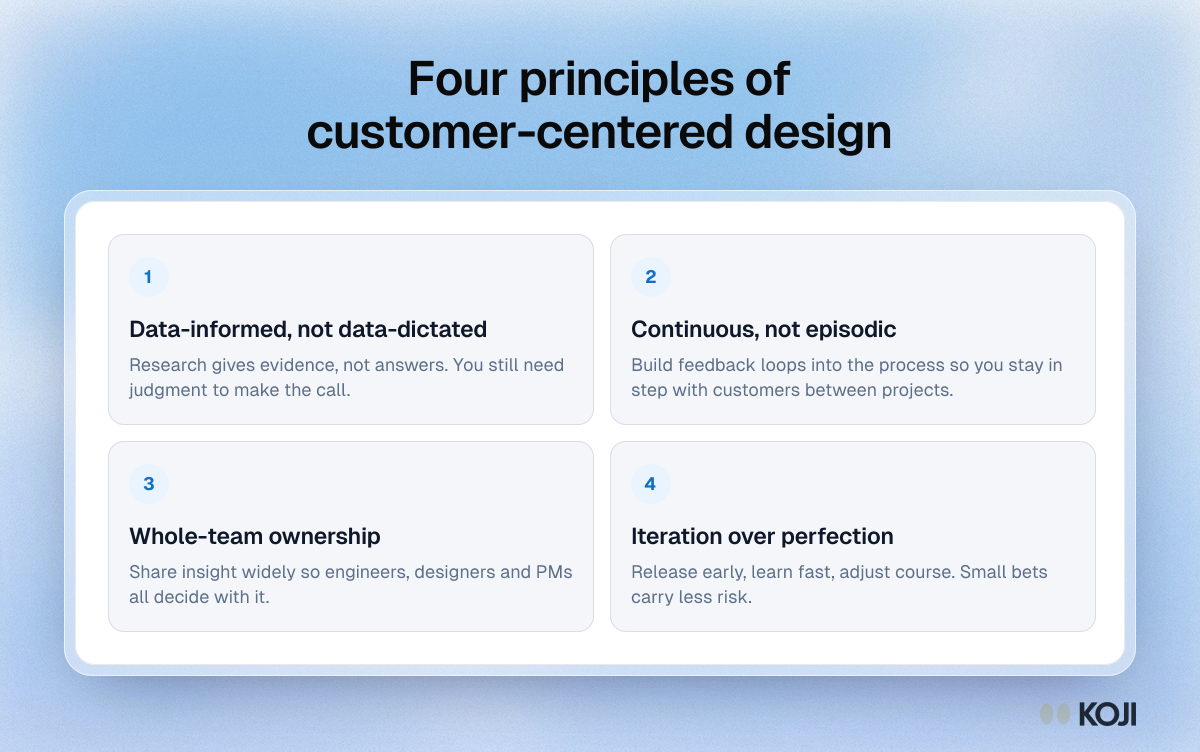
Framework of four principles of customer-centered design: data-informed decisions, continuous research, whole-team ownership and iteration.

Framework

Four principles of customer-centered design
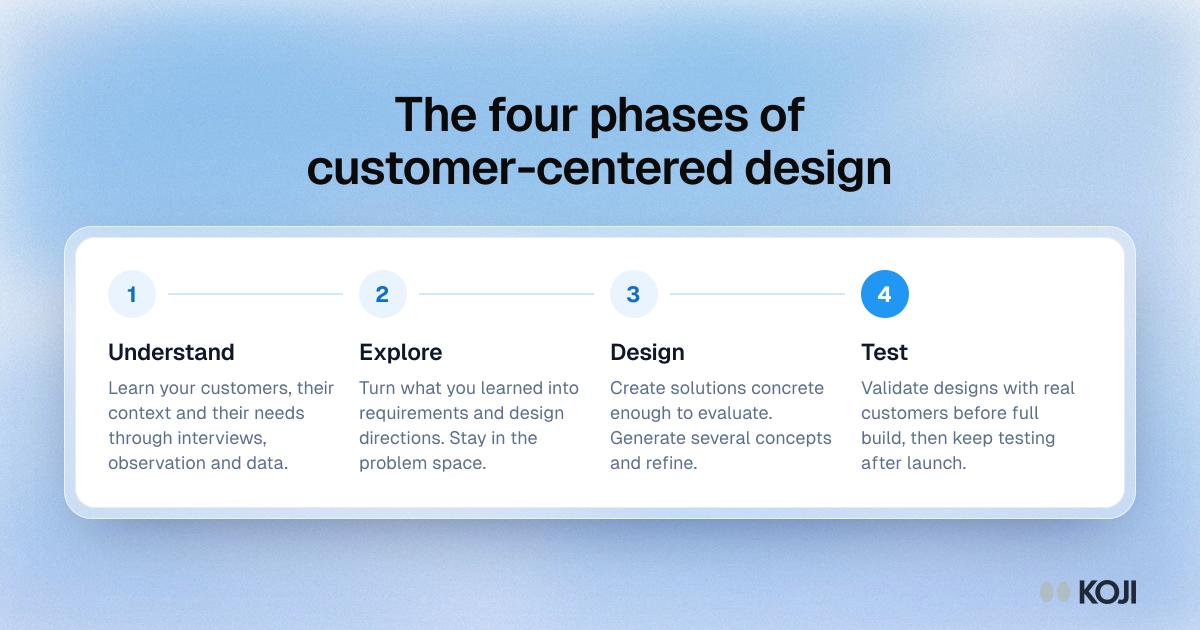
Process showing the four phases of customer-centered design: understand, explore, design and test, repeated as the product and market change.

Process

The four phases of customer-centered design
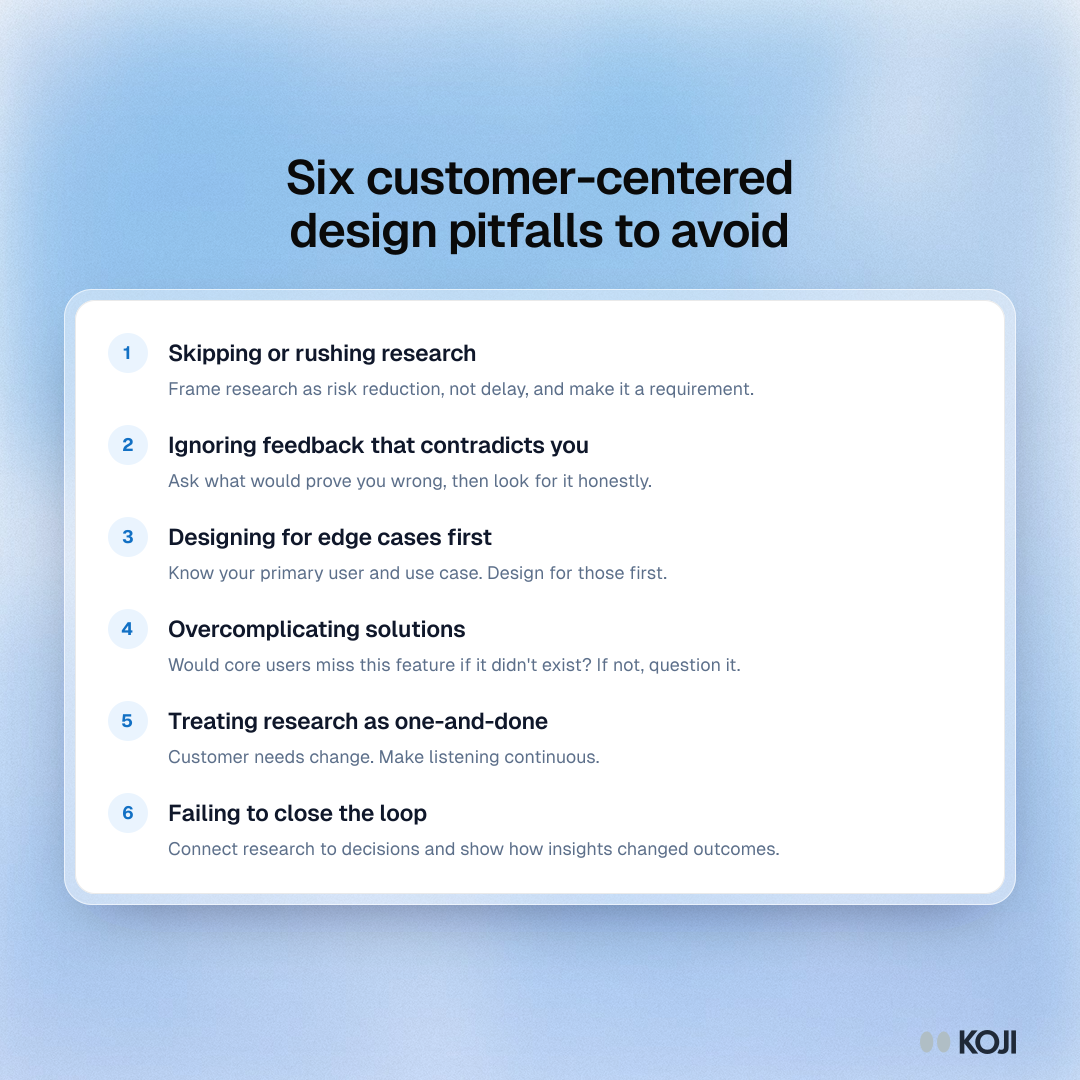
List of six customer-centered design pitfalls, from skipping research and ignoring contrary feedback to never closing the loop.

Guide

Six customer-centered design pitfalls to avoid
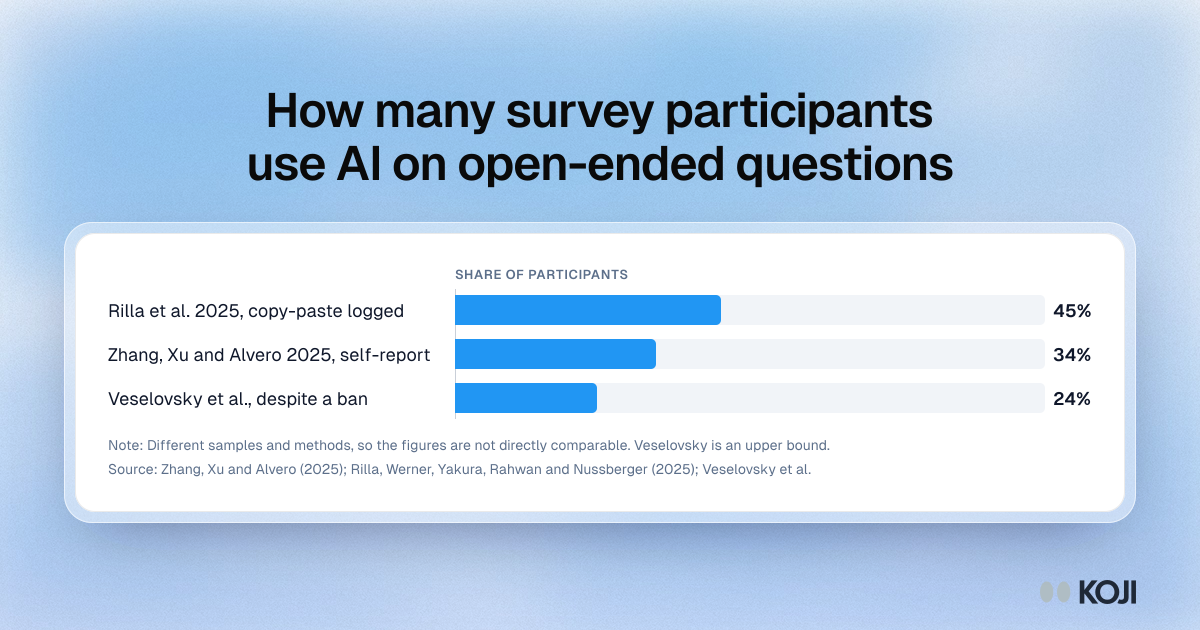
Bar chart of survey participants using AI on open-ended questions: 45% copy and paste logged, 34% self-reported, up to 24% despite a ban.

Bar chart

How many survey participants use AI on open-ended questions
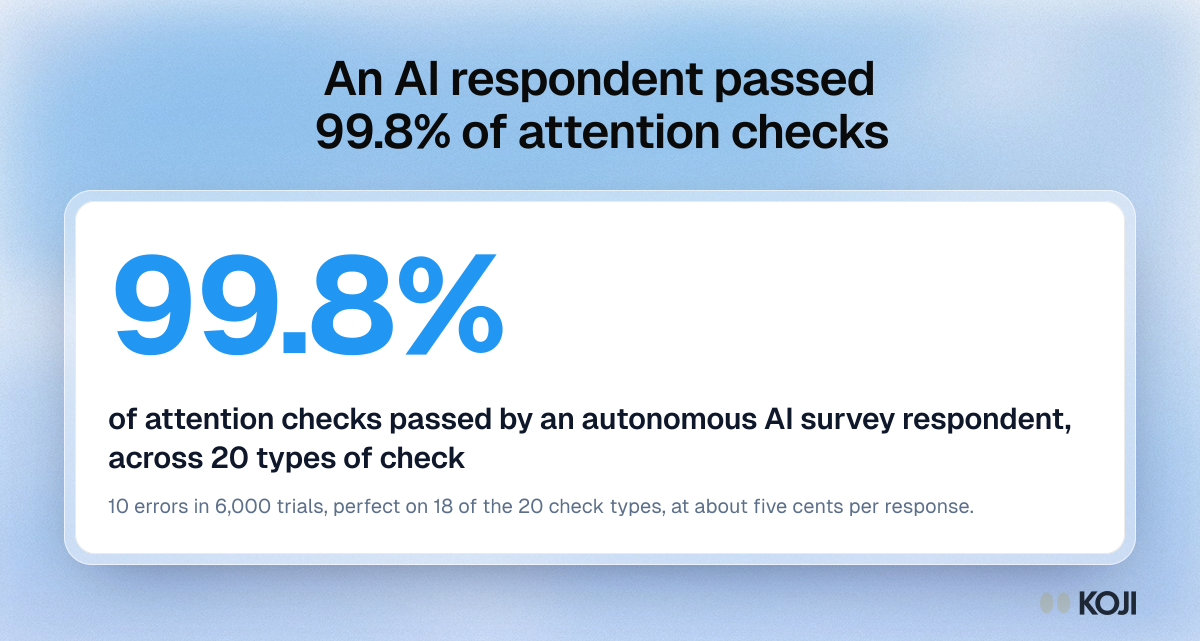
Statistic card: an autonomous AI survey respondent passed 99.8% of attention checks across 20 check types, at about five cents a response.
Key figure

An AI respondent passed 99.8% of attention checks

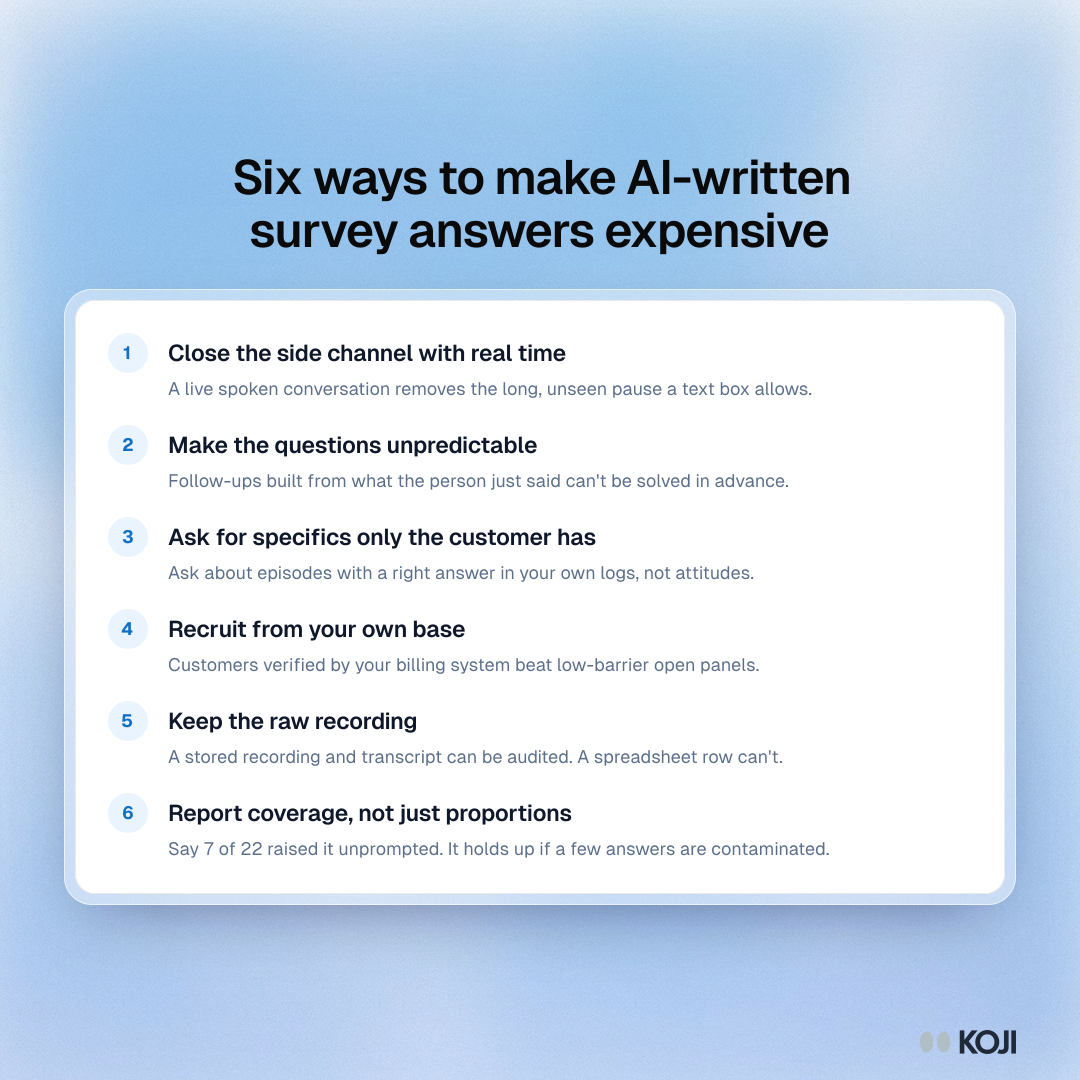
List of six research designs that make AI-written survey answers harder to fake, from live voice conversations to keeping raw recordings.

Guide

Six ways to make AI-written survey answers expensive
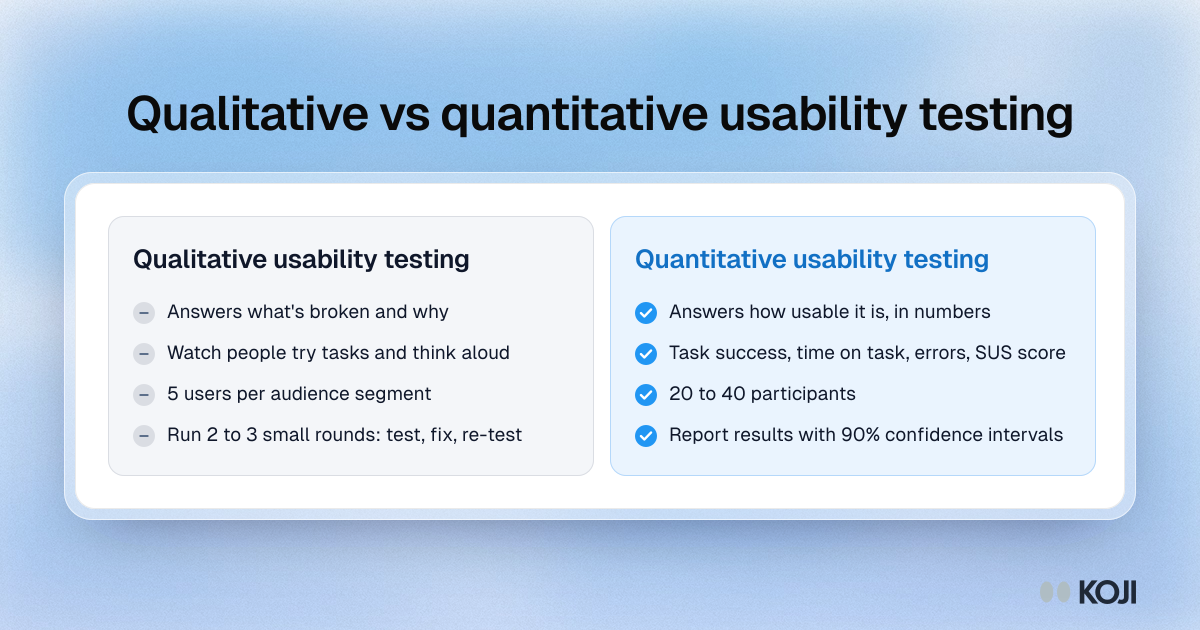
Comparison of qualitative and quantitative usability testing: 5 users per segment to find problems, 20 to 40 to measure them.

Comparison

Qualitative vs quantitative usability testing
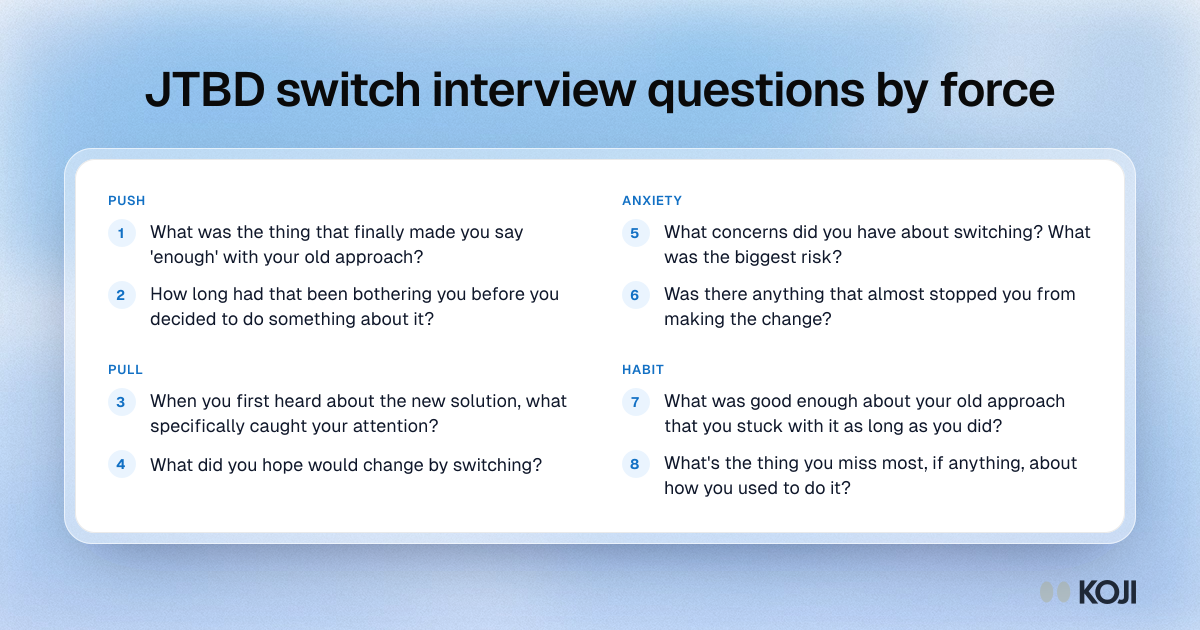
Question bank of eight Jobs to Be Done switch interview questions, two for each force: push, pull, anxiety and habit.

Question bank

JTBD switch interview questions by force
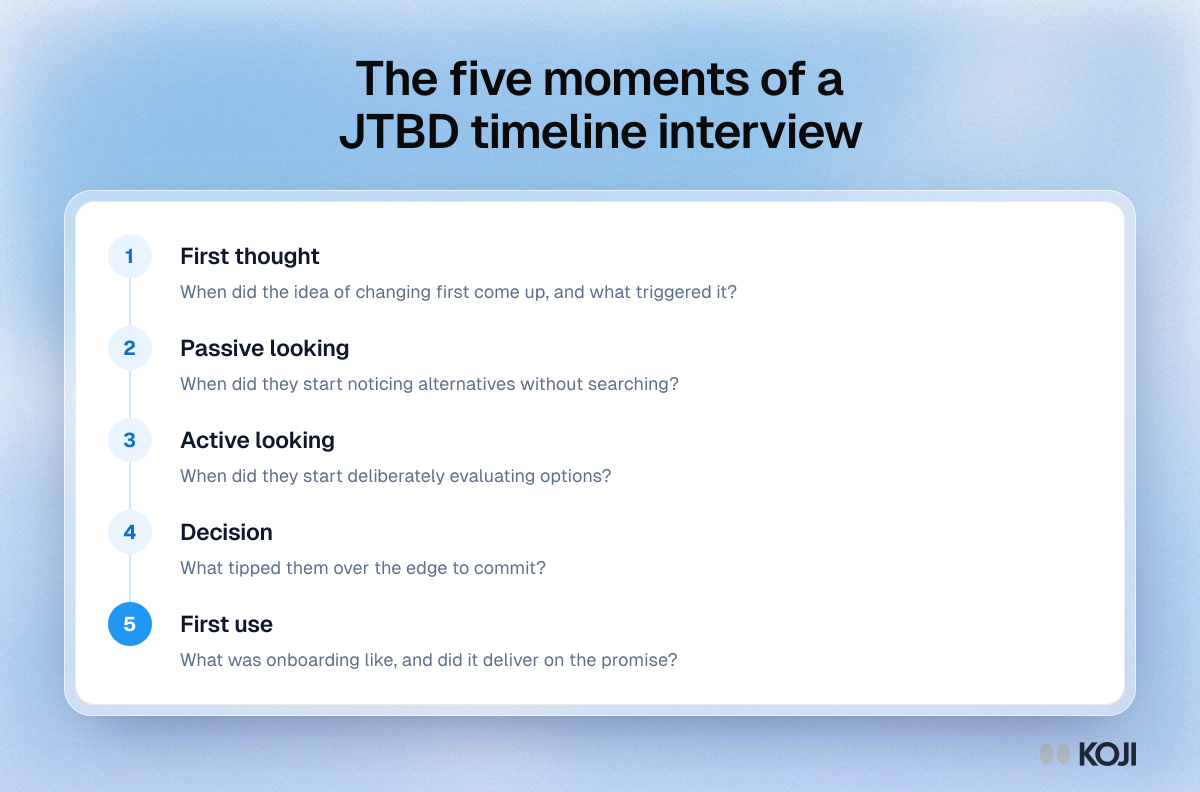
Process showing the five moments of a Jobs to Be Done timeline interview: first thought, passive looking, active looking, decision and first use.

Process

The five moments of a JTBD timeline interview
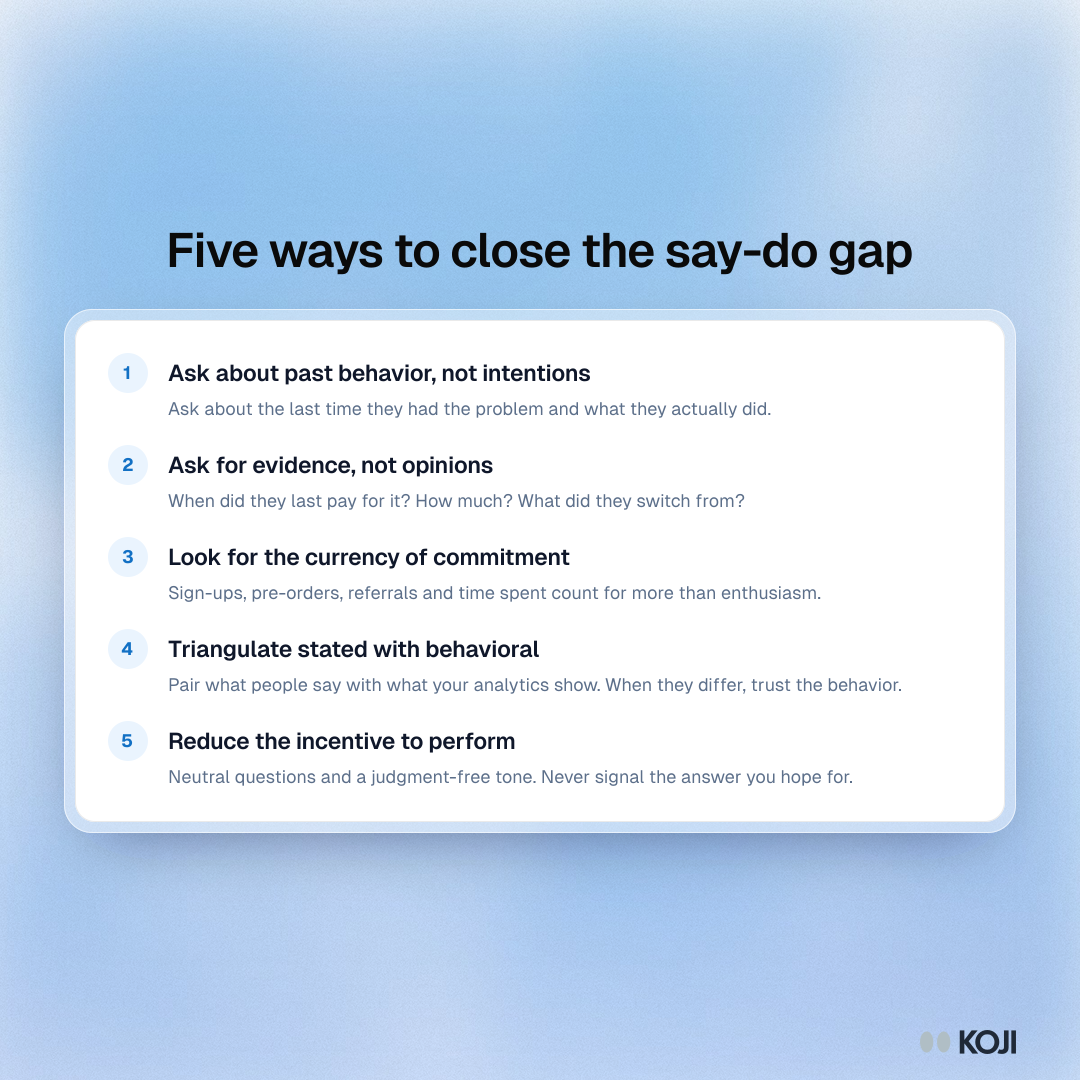
List of five ways to close the say-do gap in research, from asking about past behavior to triangulating answers with analytics.

Guide

Five ways to close the say-do gap
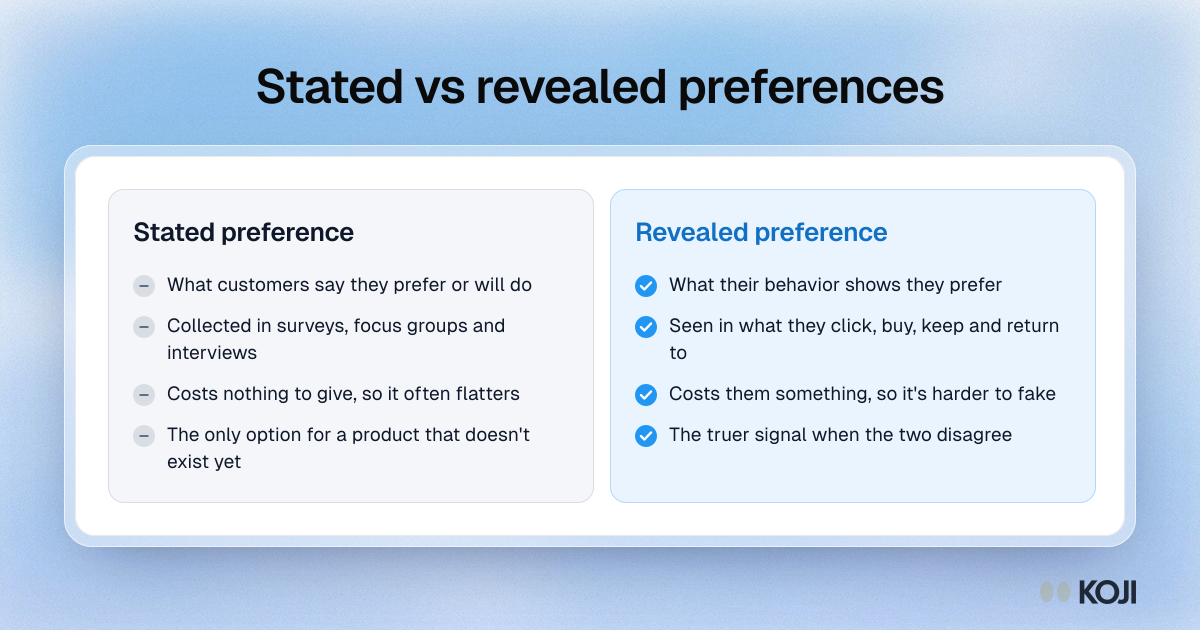
Comparison of stated and revealed preferences: what customers say in surveys and interviews against what their behavior shows.

Comparison

Stated vs revealed preferences
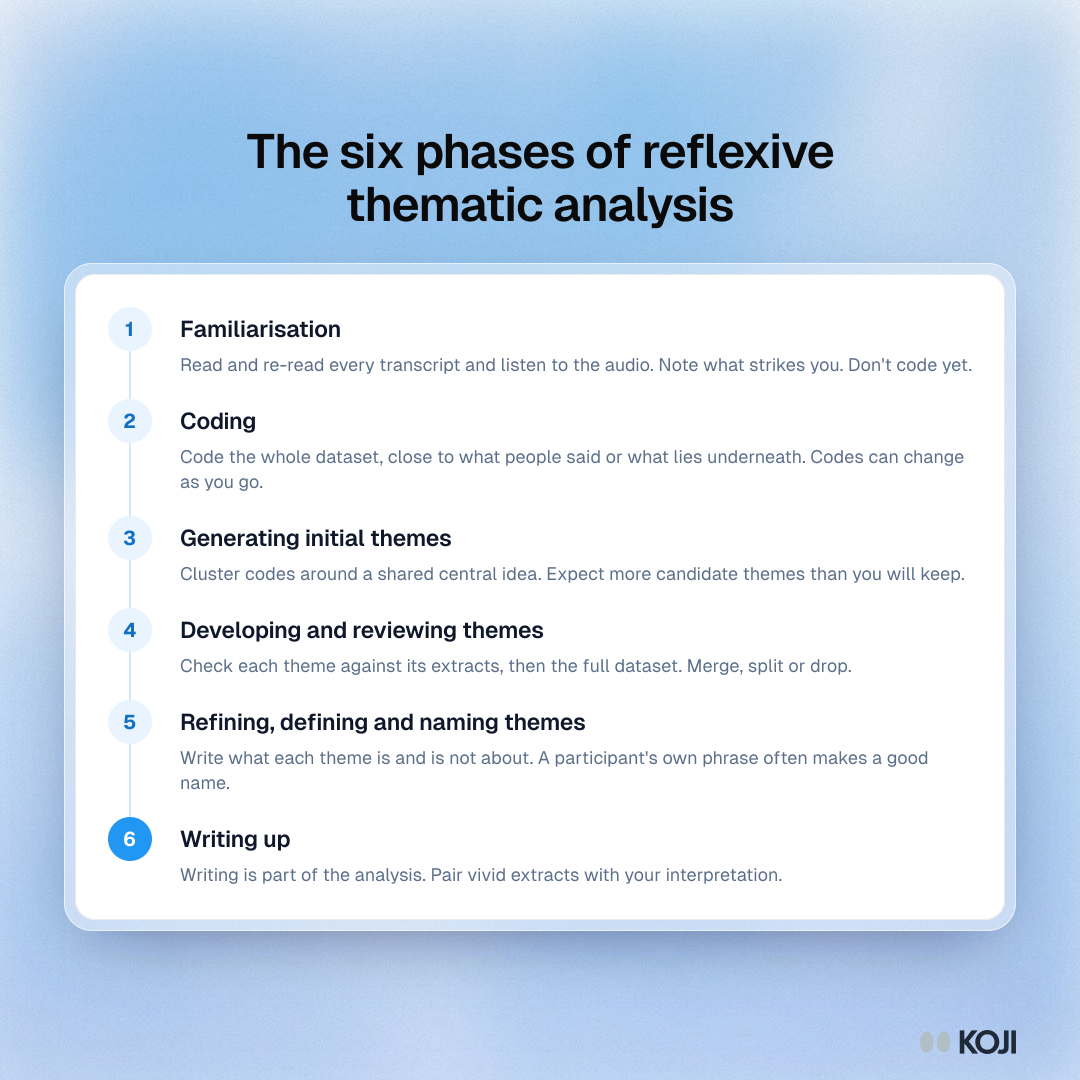
Process showing the six phases of reflexive thematic analysis: familiarisation, coding, initial themes, reviewing, naming themes and writing up.

Process

The six phases of reflexive thematic analysis
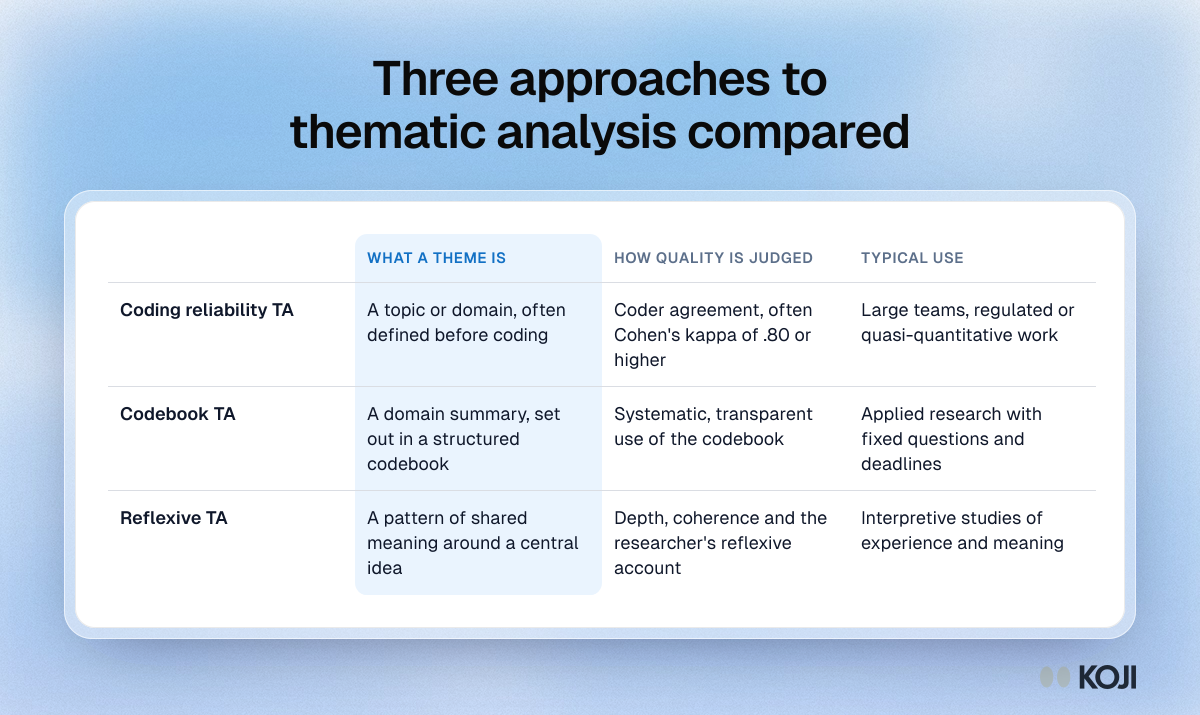
Table comparing coding reliability, codebook and reflexive thematic analysis on what a theme is, how quality is judged and typical use.

Reference table

Three approaches to thematic analysis compared
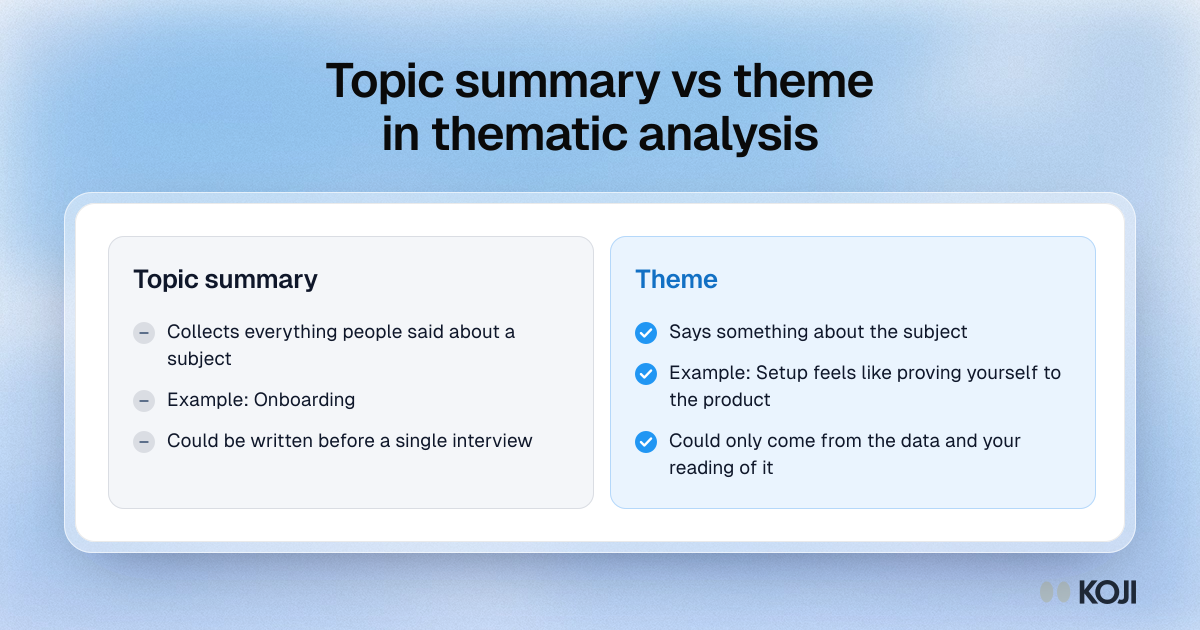
Comparison of a topic summary and a theme: a topic collects what people said about a subject, a theme makes a point about it.

Comparison

Topic summary vs theme in thematic analysis
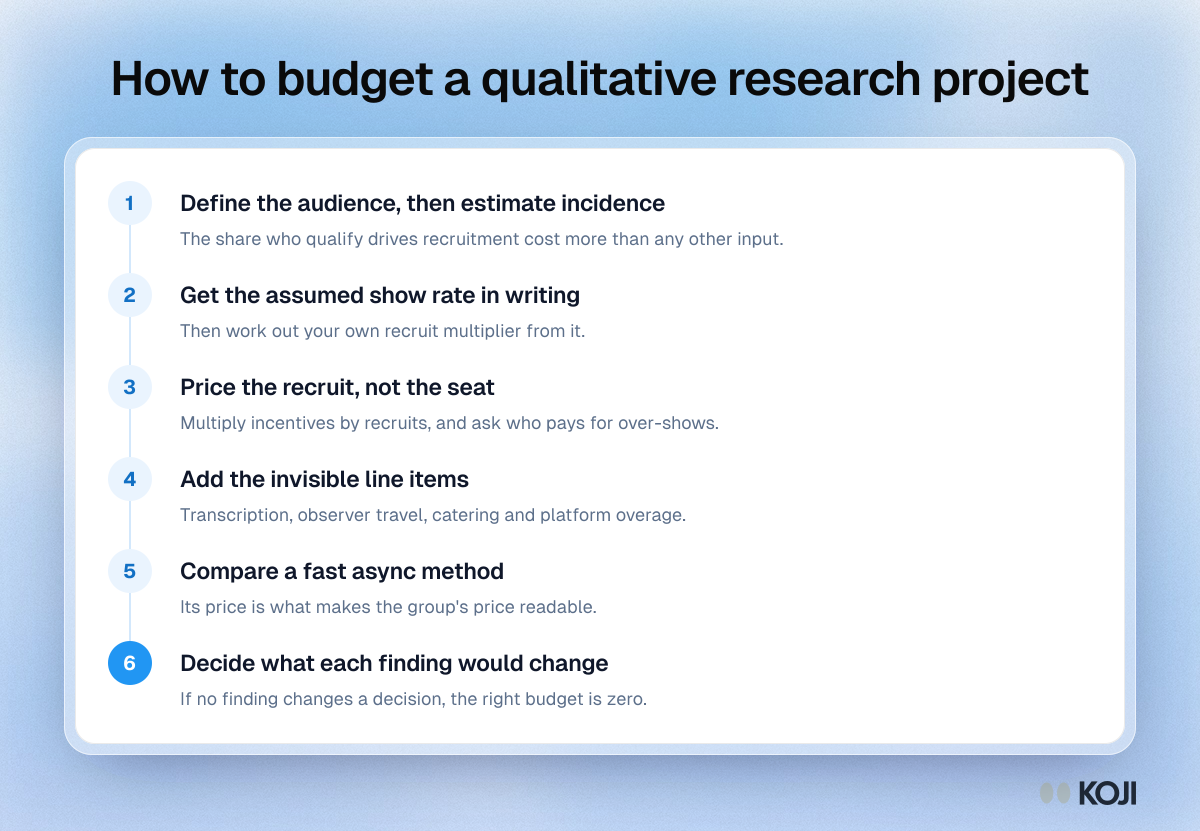
Process of six steps to budget a qualitative project: define the audience, get the show rate, price the recruit, add hidden costs, compare and decide.

Process

How to budget a qualitative research project
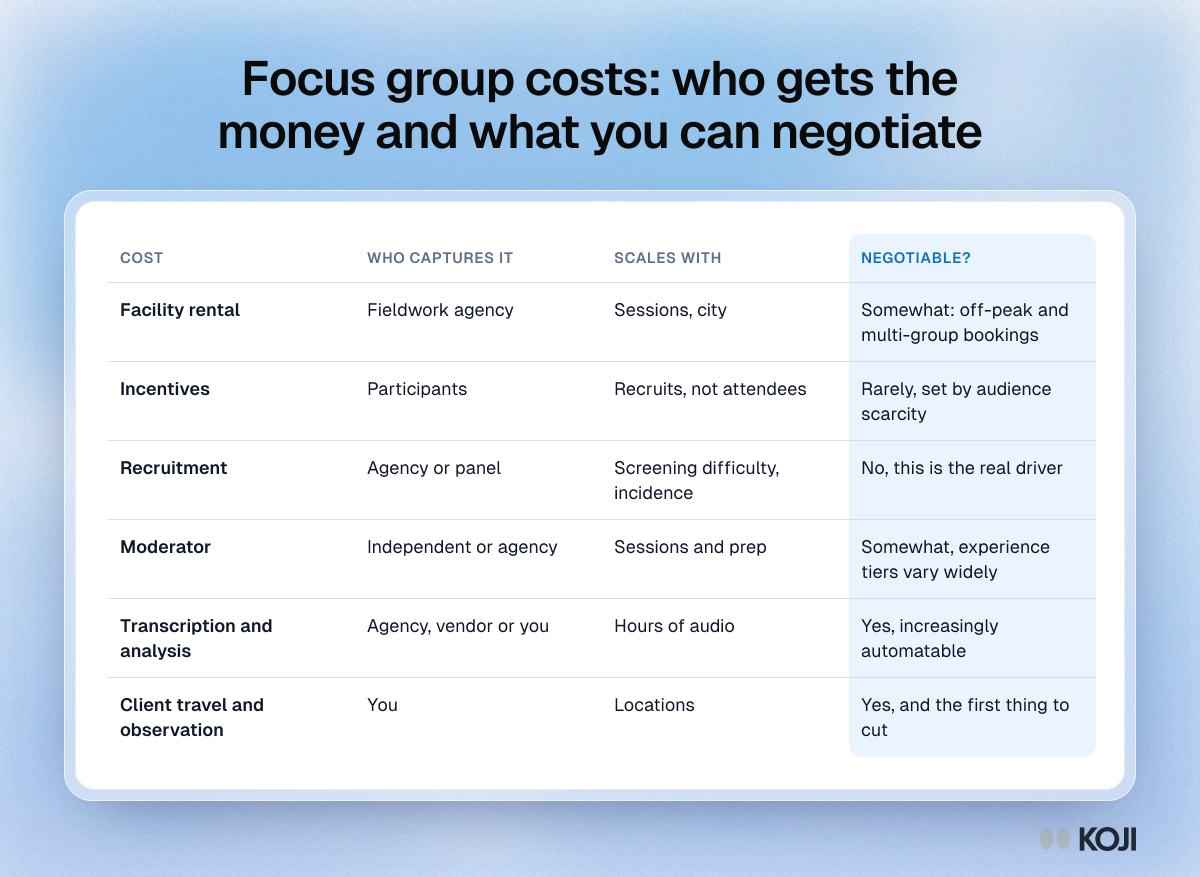
Table of six focus group cost items, from facility rental and incentives to client travel, with who captures each, what it scales with and if it is negotiable.

Reference table

Focus group costs: who gets the money and what you can negotiate
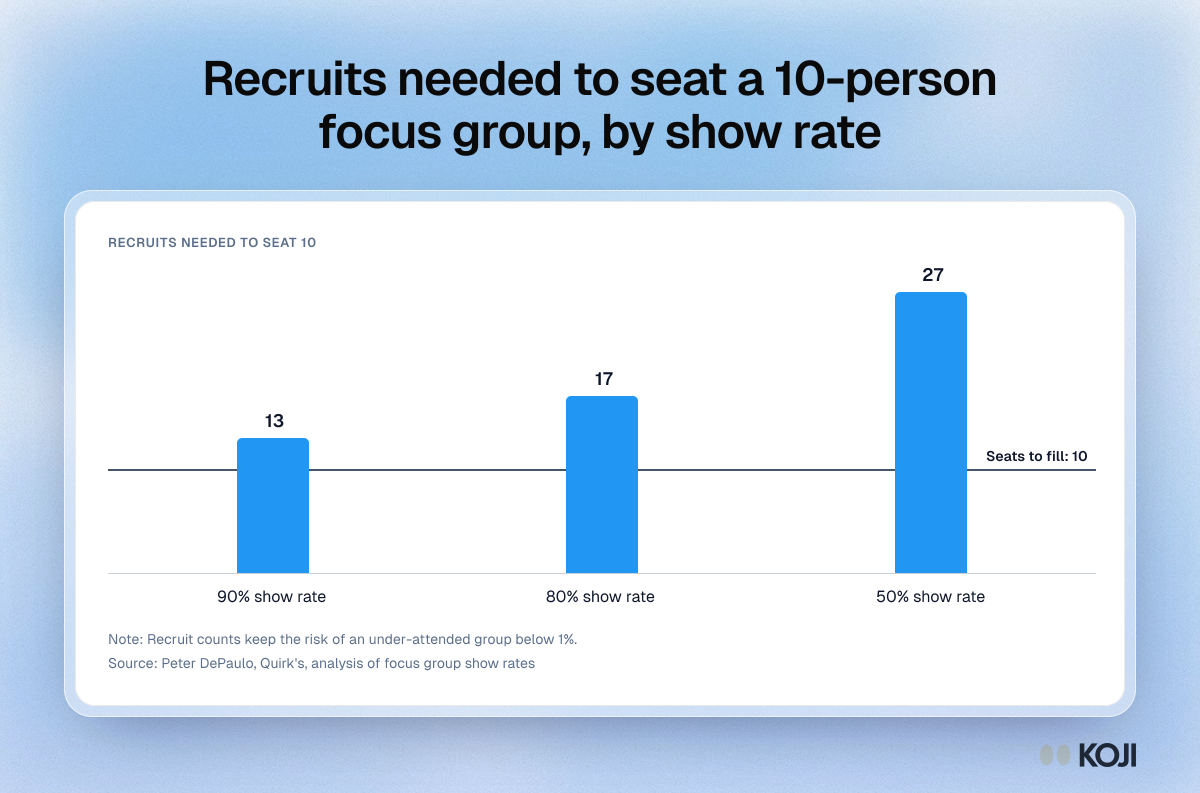
Column chart of recruits needed to seat a 10-person focus group: 13 at a 90% show rate, 17 at 80% and 27 at 50%.

Column chart

Recruits needed to seat a 10-person focus group, by show rate
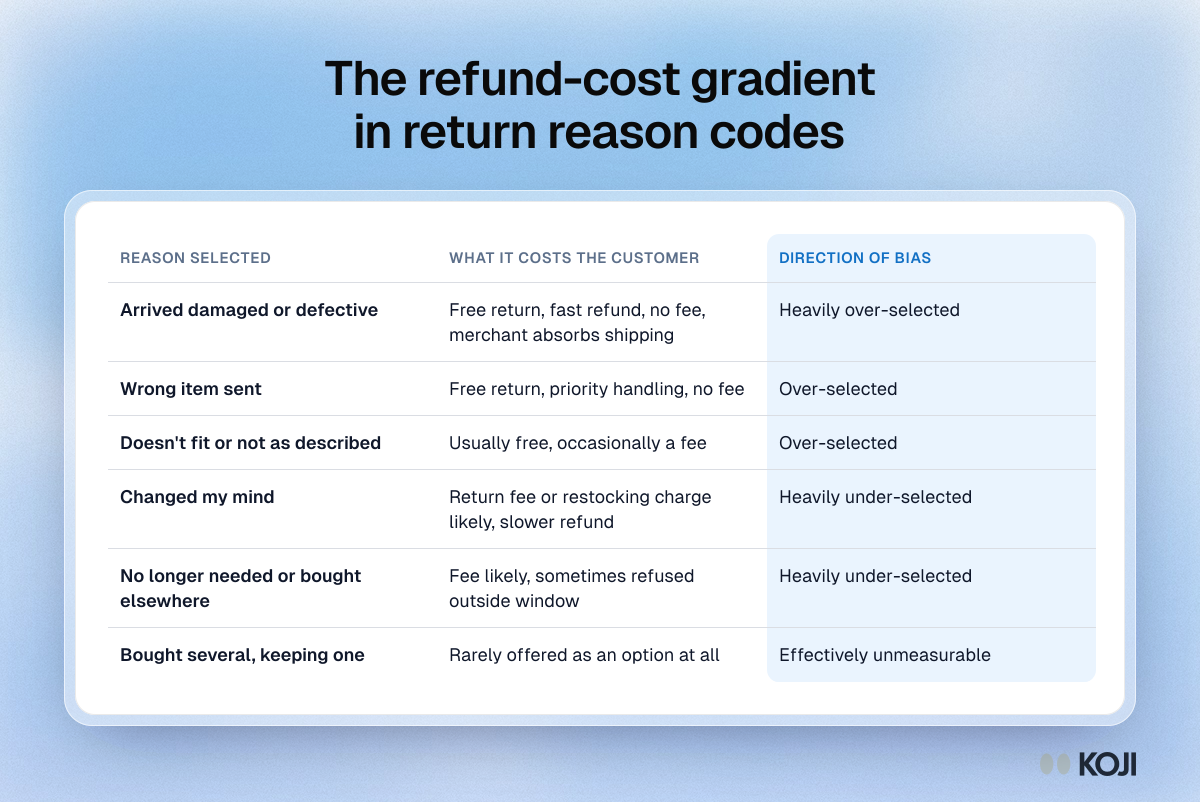
Table of six return reasons, what each costs the customer to select, and whether it ends up over or under-selected, from arrived damaged to changed my mind.

Reference table

The refund-cost gradient in return reason codes
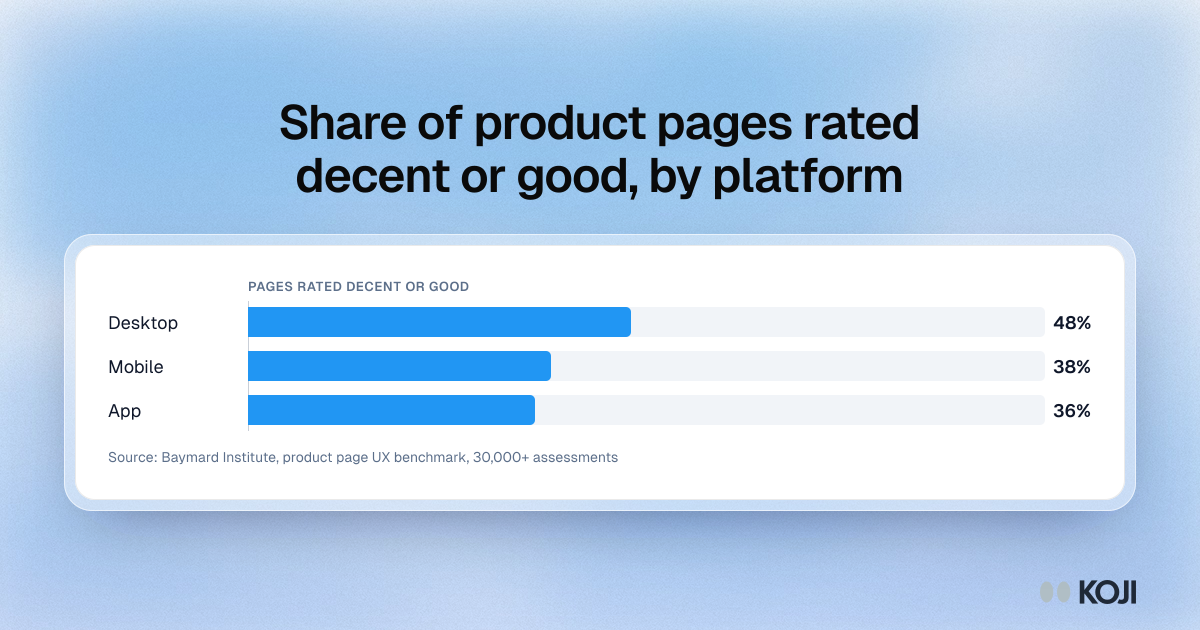
Bar chart of product pages Baymard Institute rated decent or good: 48% on desktop, 38% on mobile and 36% in apps.

Bar chart

Share of product pages rated decent or good, by platform
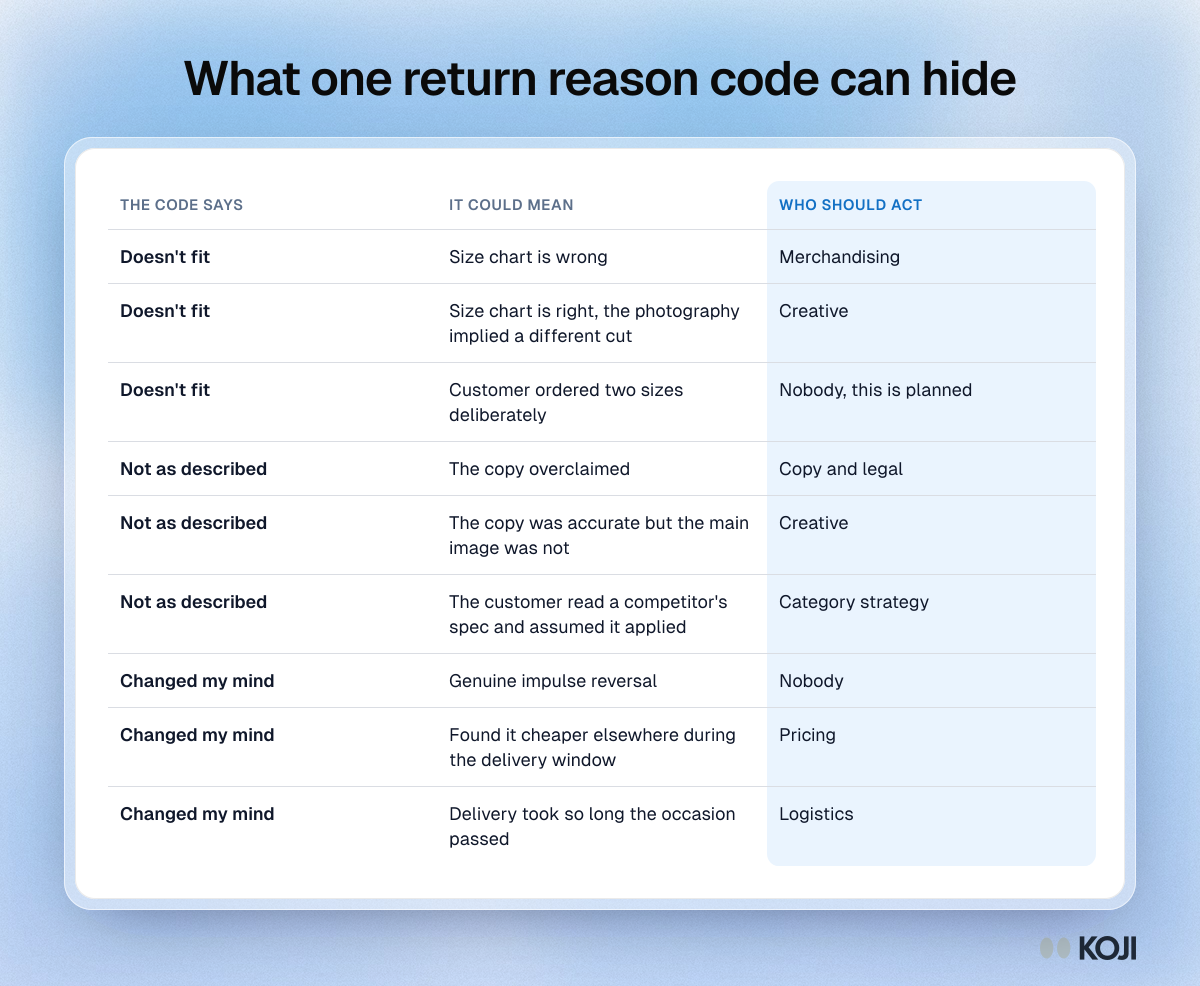
Table showing how three return reason codes hide nine different causes, such as a wrong size chart or misleading photos, each owned by a different team.

Reference table

What one return reason code can hide
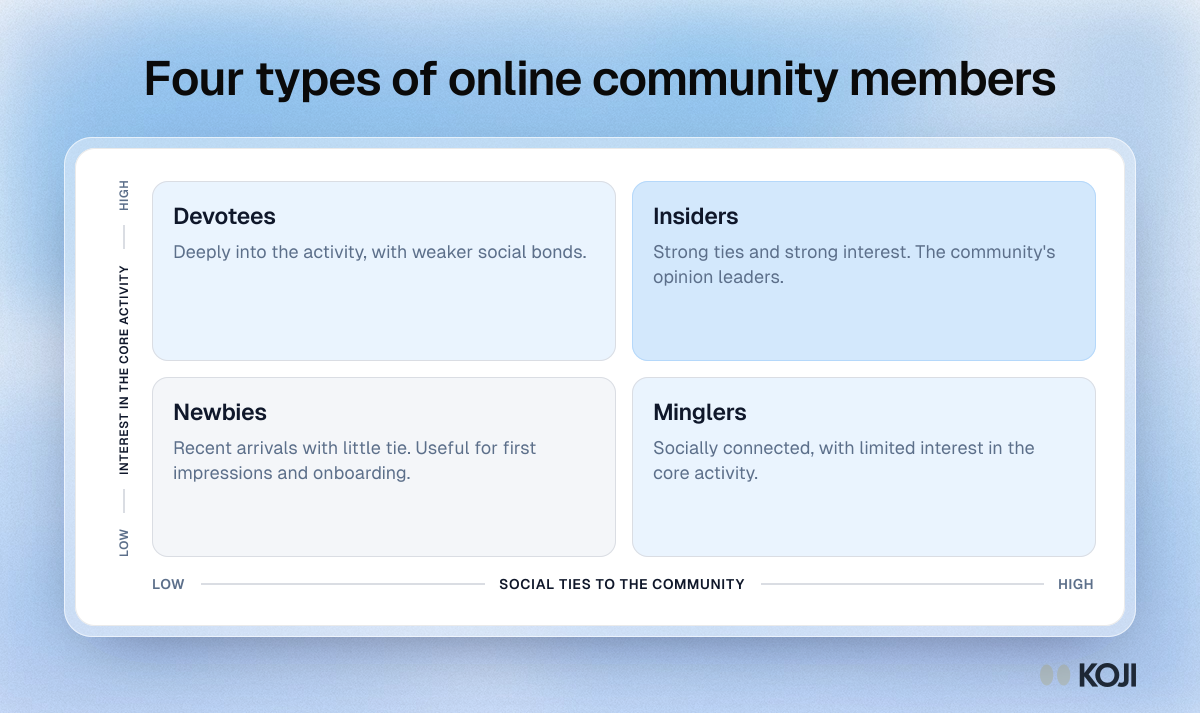
Matrix of four online community member types by social ties and interest in the core activity: newbies, minglers, devotees and insiders.

Matrix

Four types of online community members
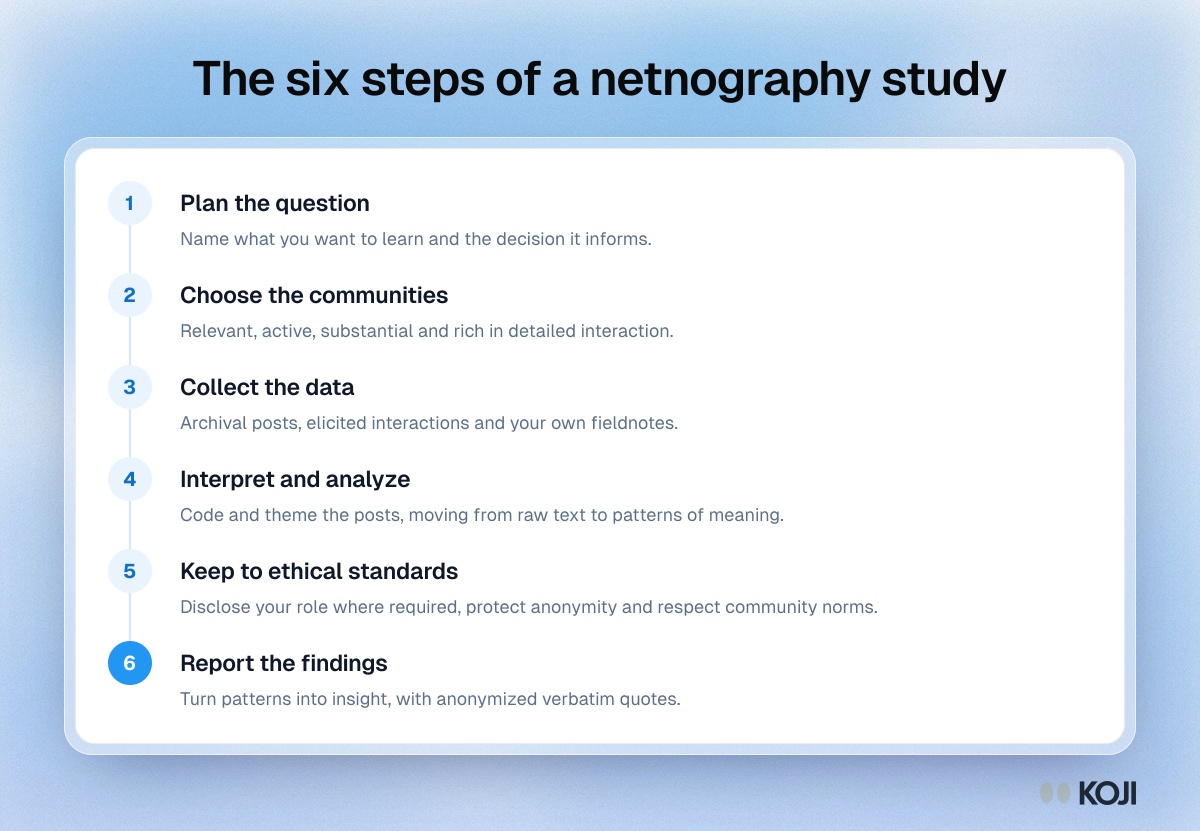
Process showing the six steps of a netnography study: plan the question, choose communities, collect data, analyze, keep to ethics and report findings.

Process

The six steps of a netnography study
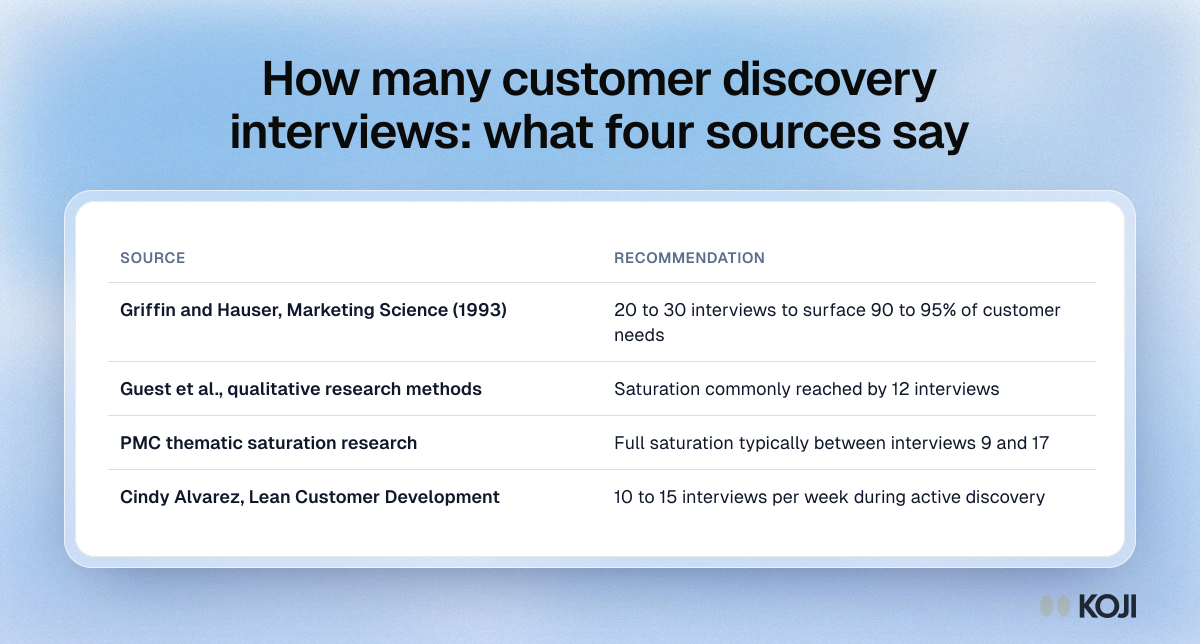
Table of four sources on how many customer discovery interviews you need, from saturation by 12 interviews to 20 to 30 to surface most customer needs.

Reference table

How many customer discovery interviews: what four sources say
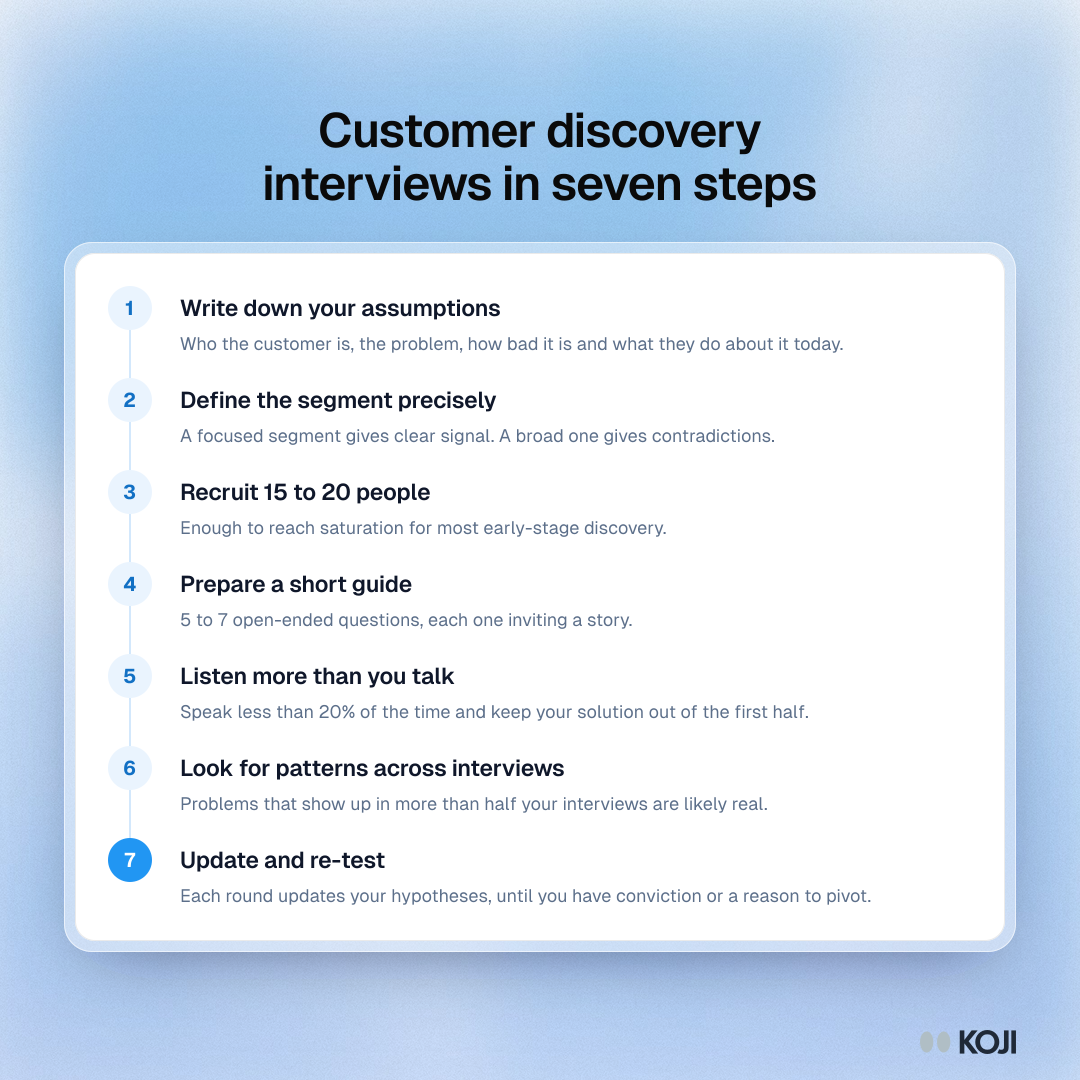
Process of seven steps for customer discovery interviews, from writing down assumptions and recruiting 15 to 20 people to finding patterns and re-testing.

Process

Customer discovery interviews in seven steps
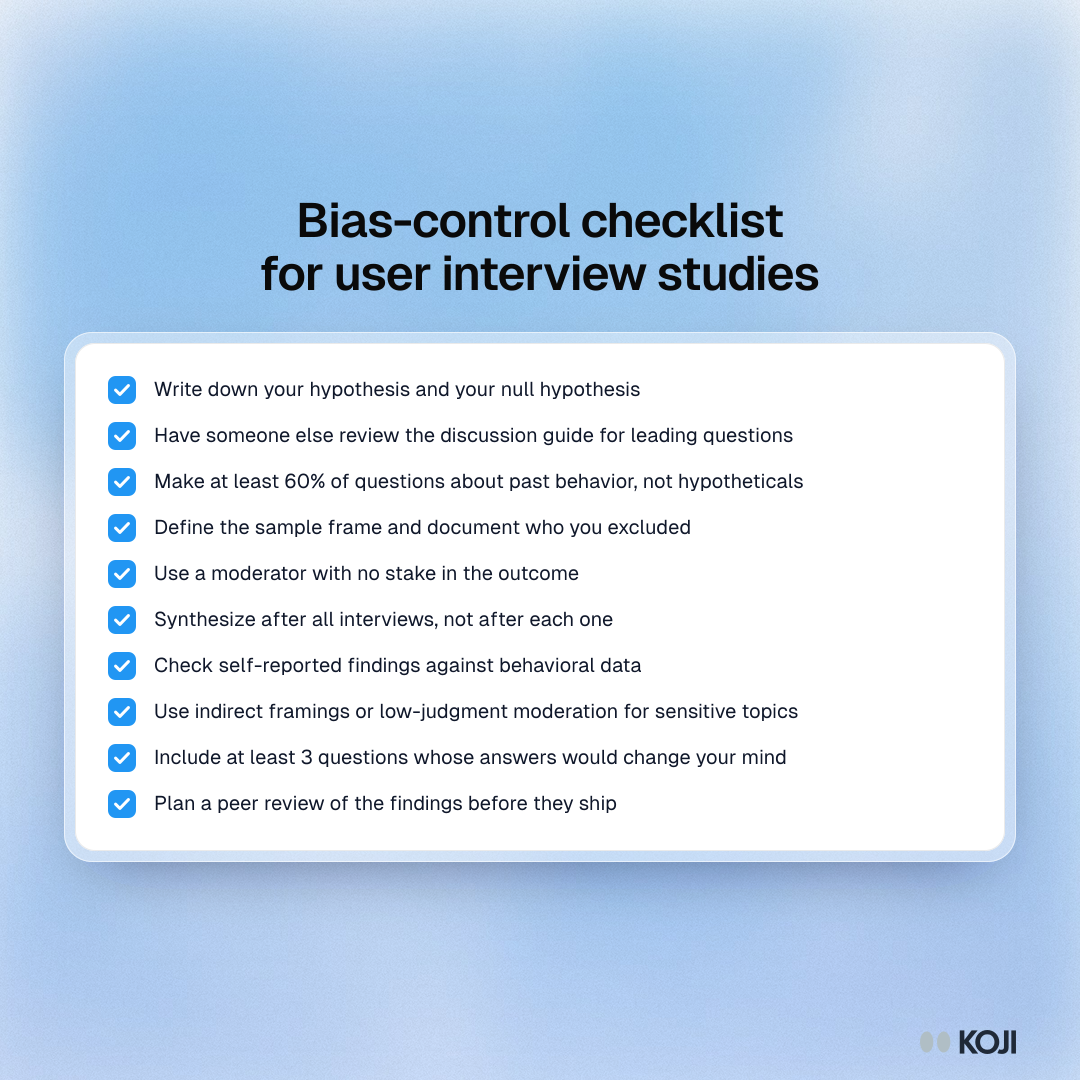
Checklist of ten bias checks for a user interview study, from writing a null hypothesis and reviewing the guide to synthesizing after all interviews.

Checklist

Bias-control checklist for user interview studies
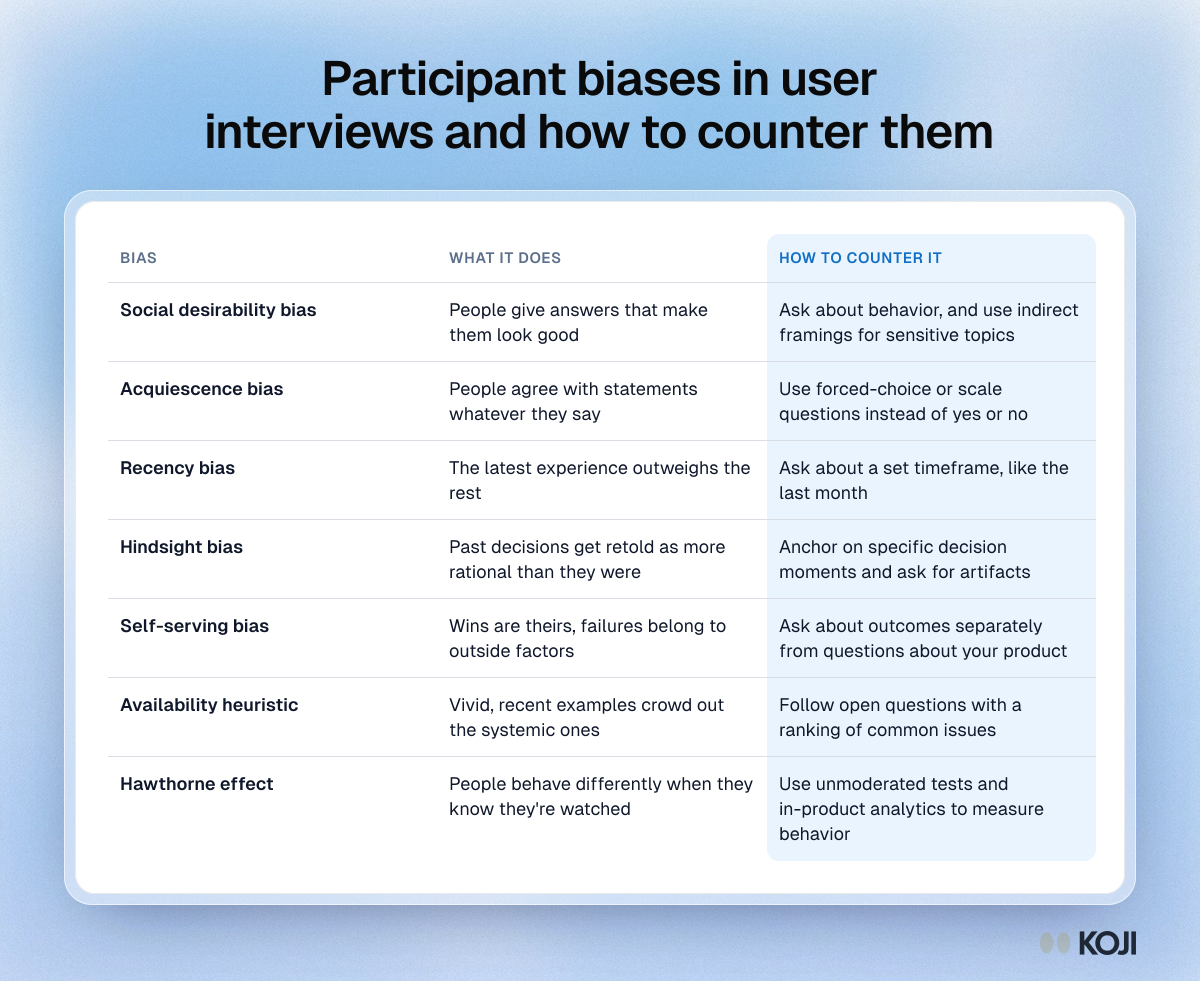
Table of seven participant-side biases in user interviews, from social desirability and recency bias to the Hawthorne effect, with a countermeasure for each.

Reference table

Participant biases in user interviews and how to counter them
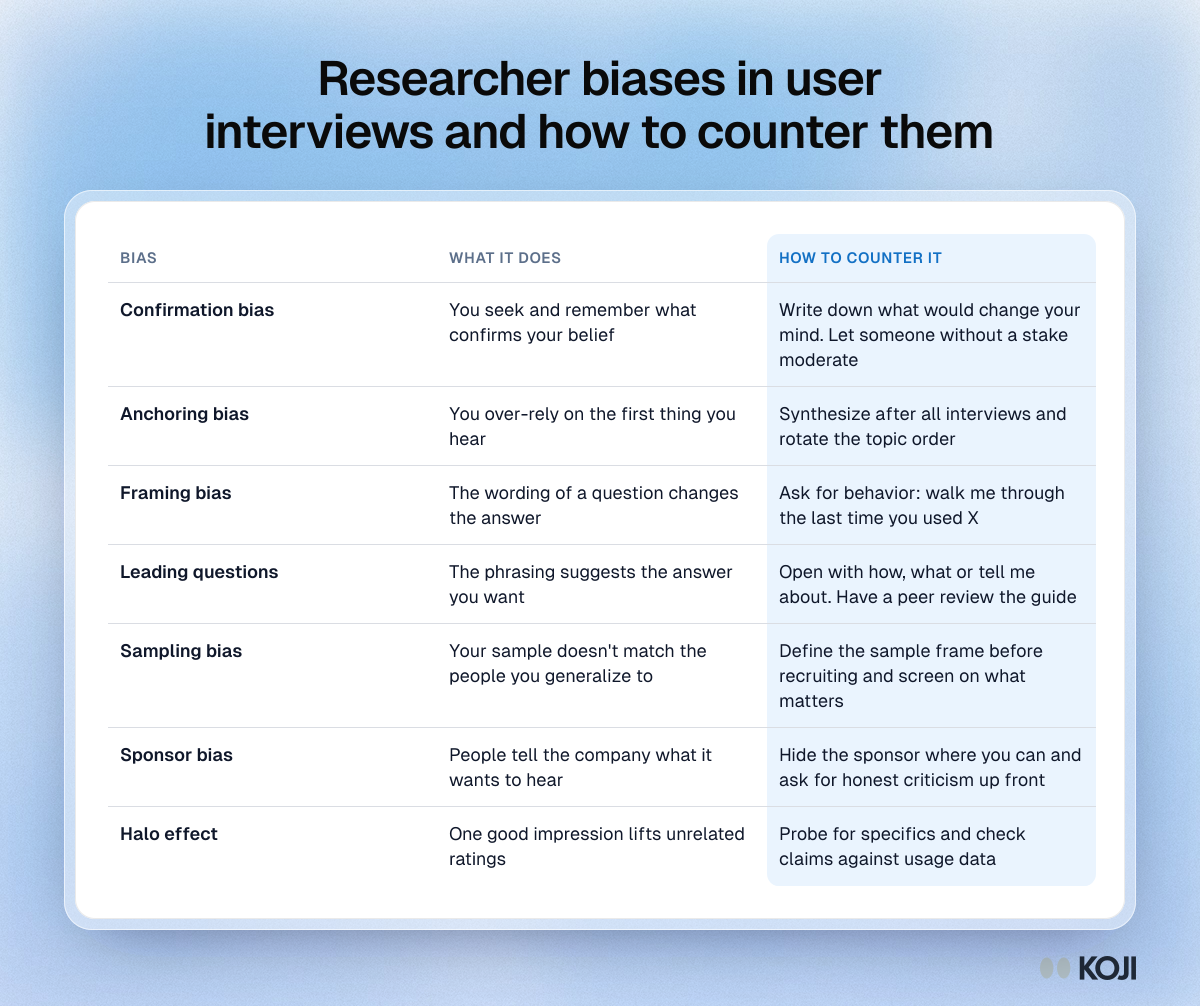
Table of seven researcher-side biases in user interviews, from confirmation and anchoring bias to the halo effect, each with what it does and a countermeasure.

Reference table

Researcher biases in user interviews and how to counter them
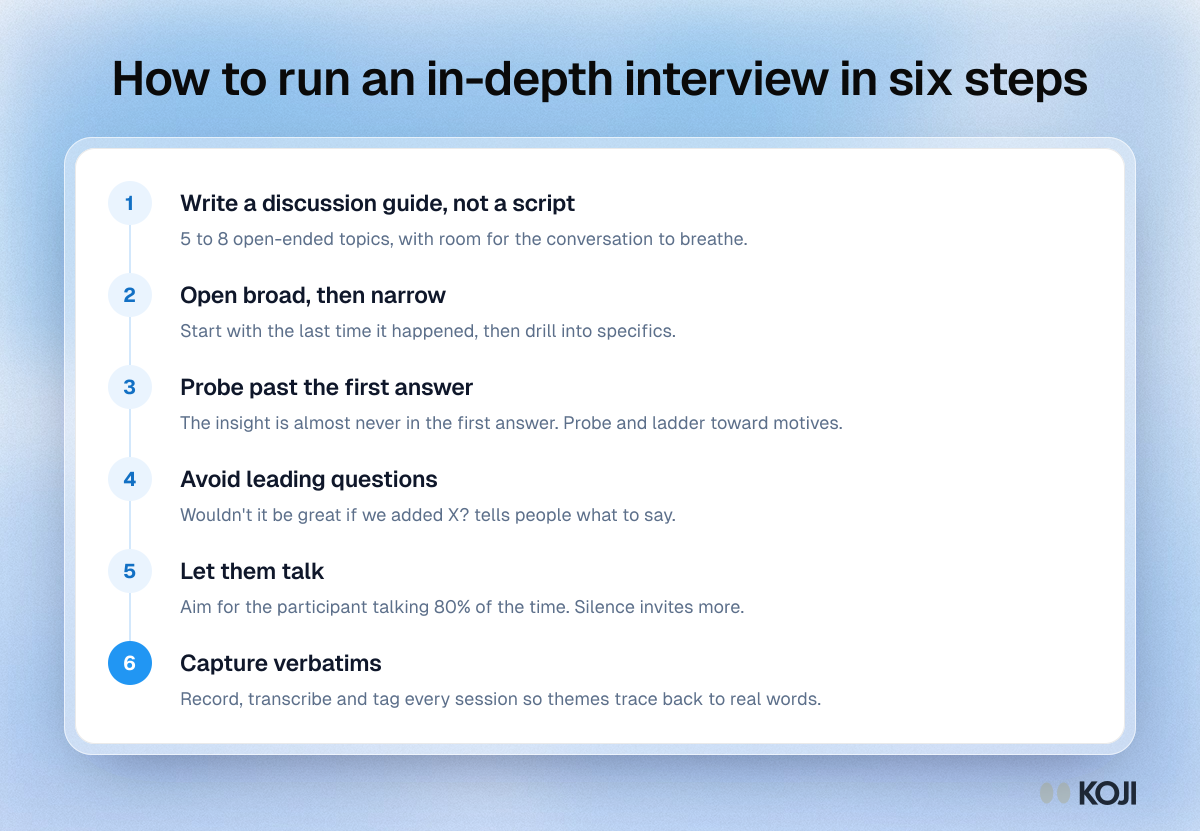
Process showing six steps for an in-depth interview: write a guide, open broad, probe, avoid leading questions, let them talk and capture verbatims.

Process

How to run an in-depth interview in six steps
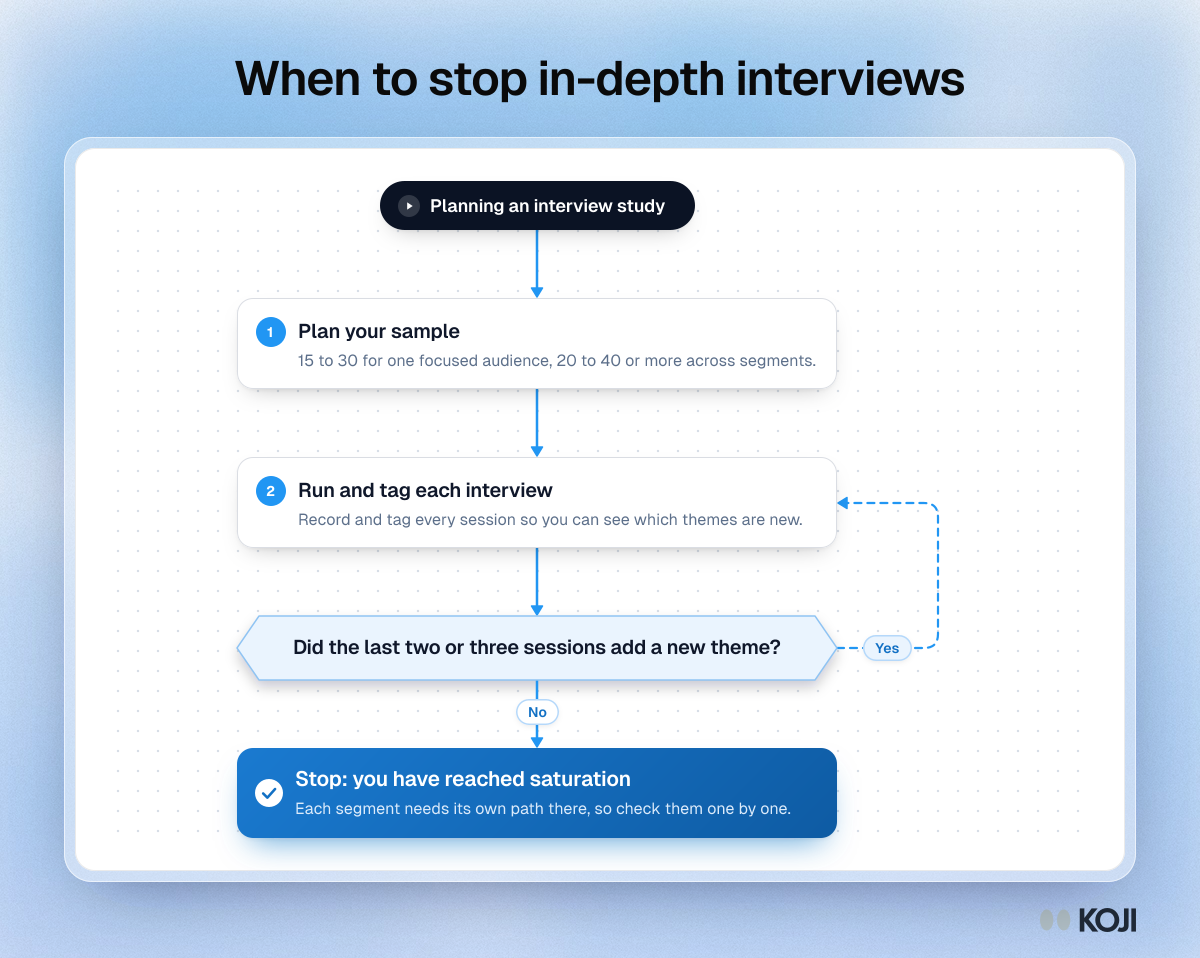
Flowchart for deciding when to stop in-depth interviews: plan the sample, run and tag sessions, and loop back until two or three in a row add no new theme.

Flowchart

When to stop in-depth interviews
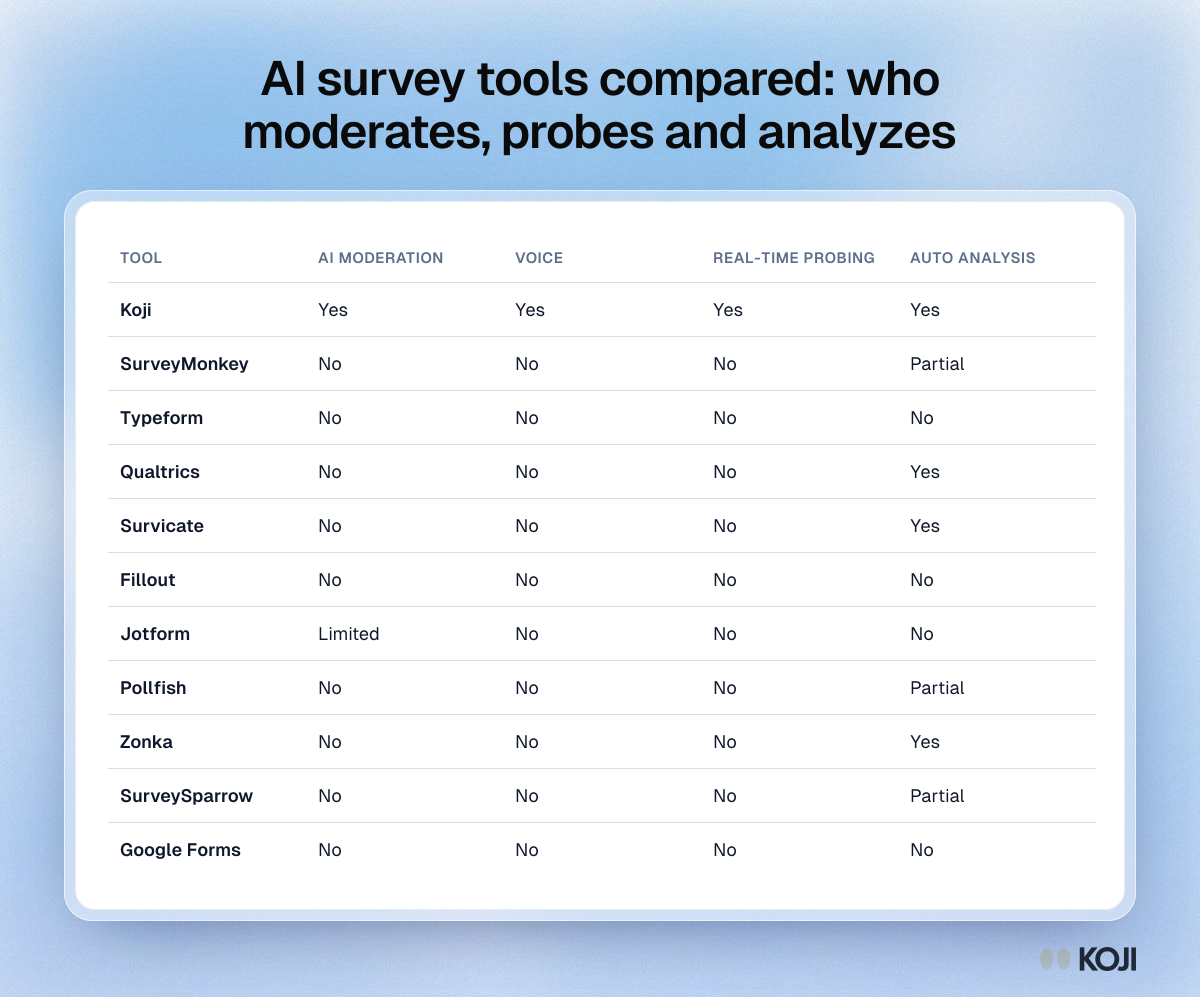
Table comparing 11 AI survey tools on AI moderation, voice, real-time probing and automatic analysis, from Koji and Typeform to Qualtrics and Google Forms.

Reference table

AI survey tools compared: who moderates, probes and analyzes
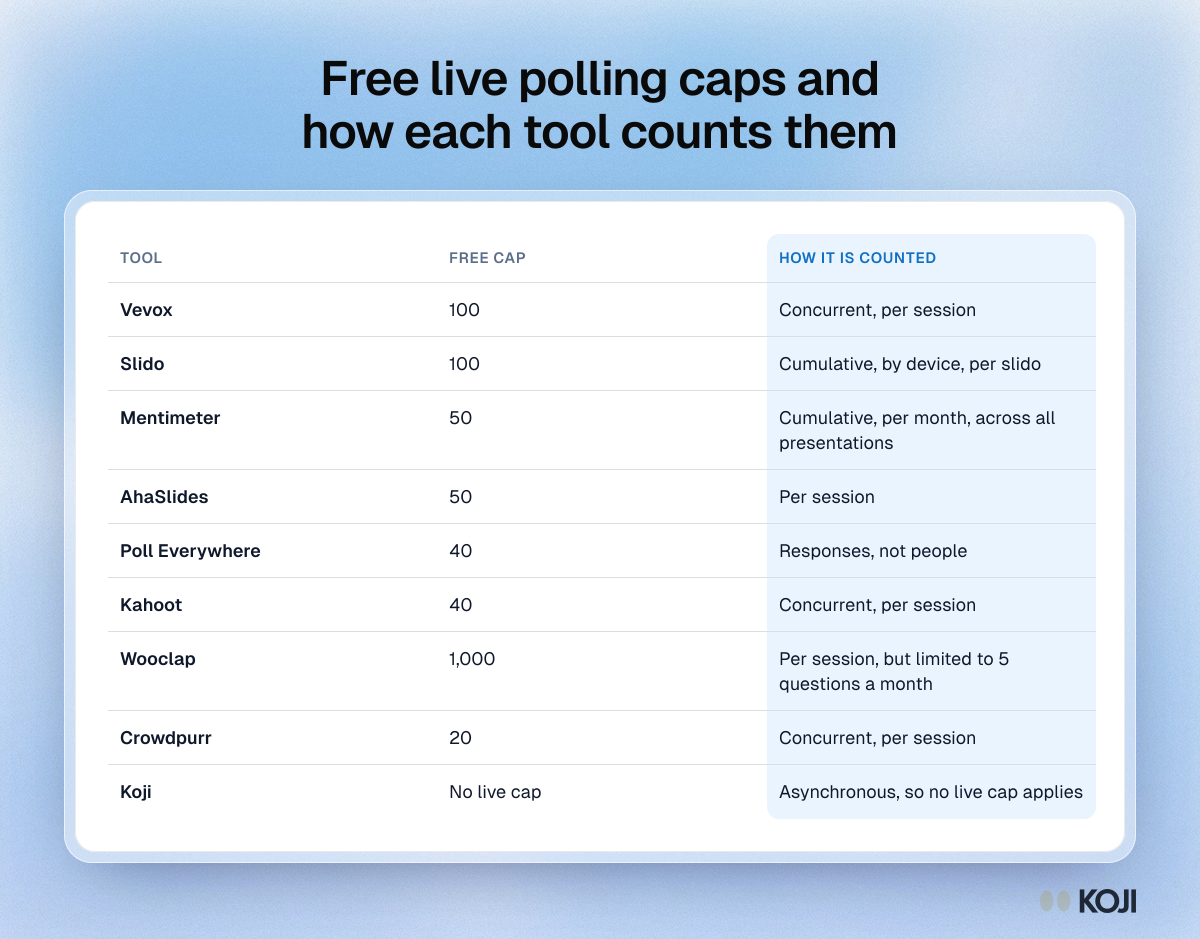
Table of free participant caps for nine live polling tools, from Vevox and Slido to Wooclap, and whether each counts people, devices or responses.

Reference table

Free live polling caps and how each tool counts them