Free to save and share

Frameworks and cheat sheets for customer research

Every framework, checklist and comparison from our guides, as an image you can download, drop into a deck or share with your team.
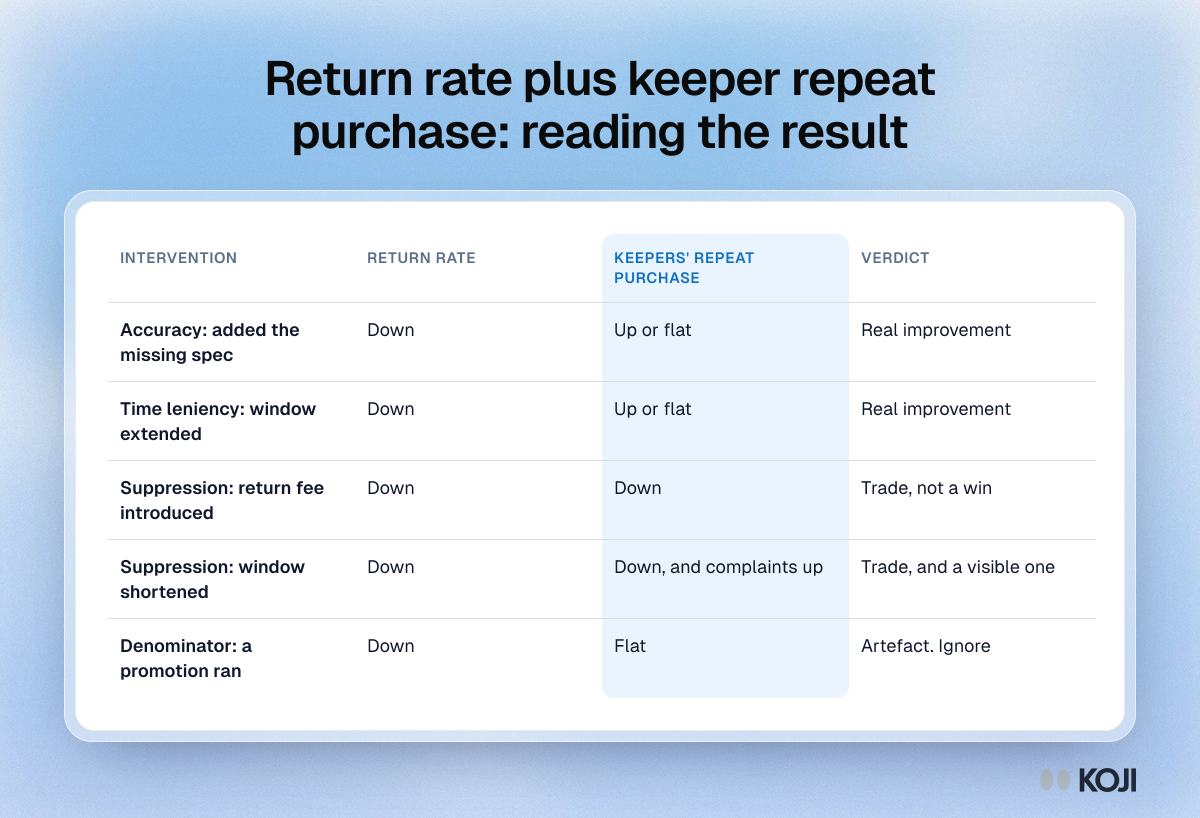
Table pairing return rate with the repeat purchase rate of customers who kept the item, showing which returns changes are real wins and which are suppression.

Reference table

Return rate plus keeper repeat purchase: reading the result
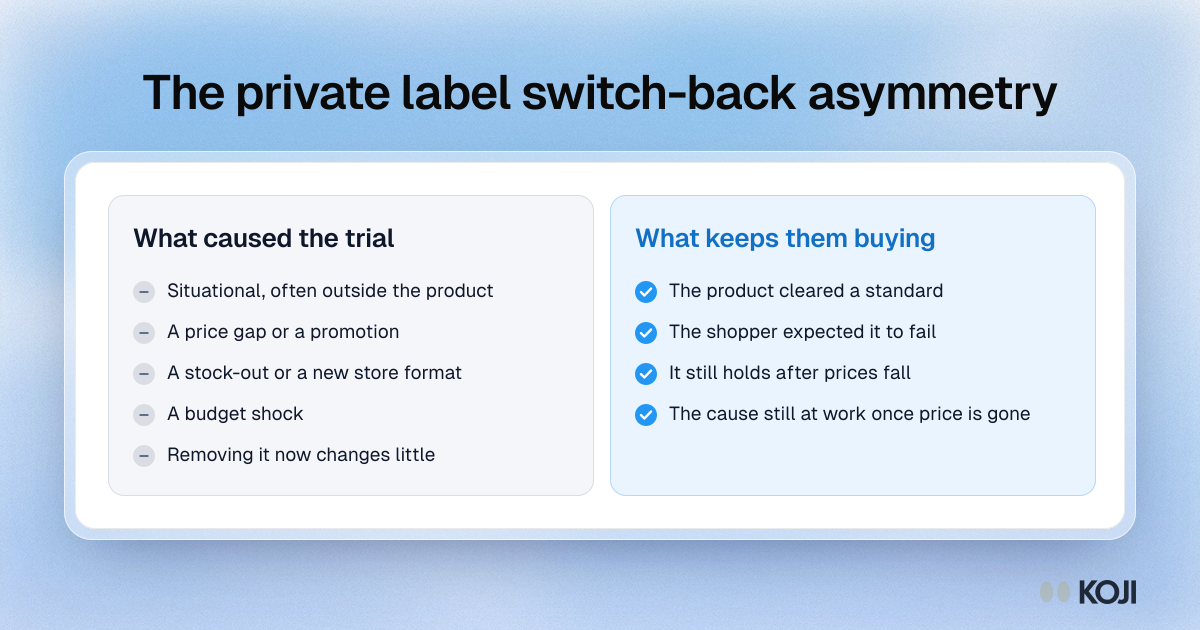
Comparison of what causes a shopper to try a store brand, such as price or a stock-out, against what keeps them buying it: the product met their standard.

Comparison

The private label switch-back asymmetry
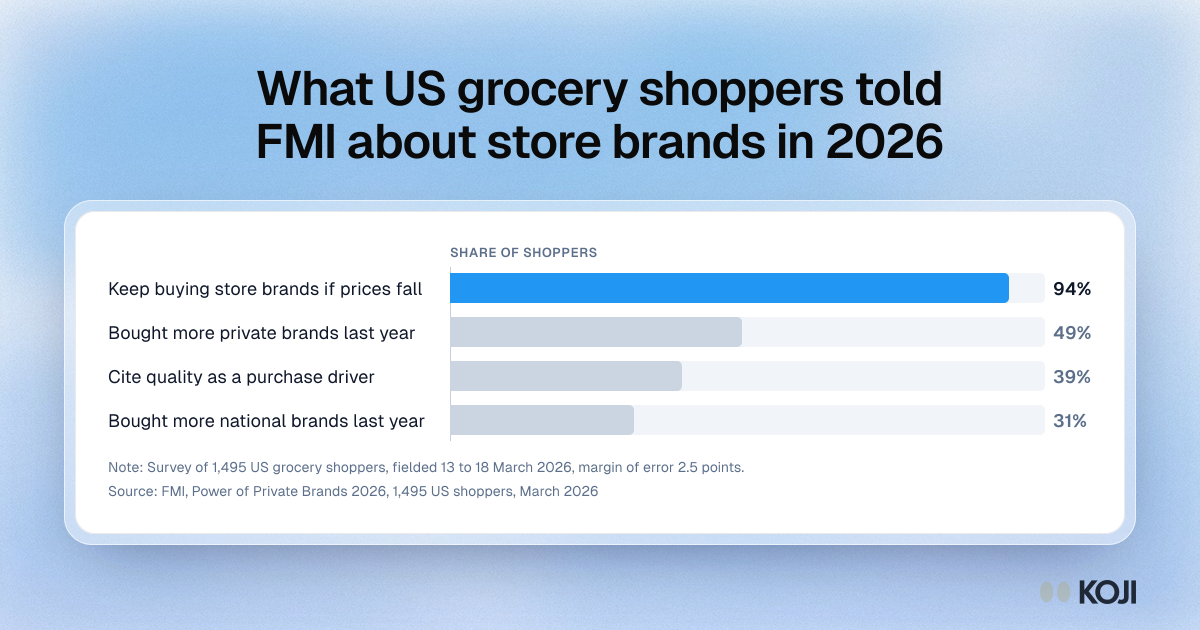
Bar chart of FMI 2026 survey results: 94% of shoppers will keep buying store brands if prices fall, 49% bought more private brands last year.

Bar chart

What US grocery shoppers told FMI about store brands in 2026
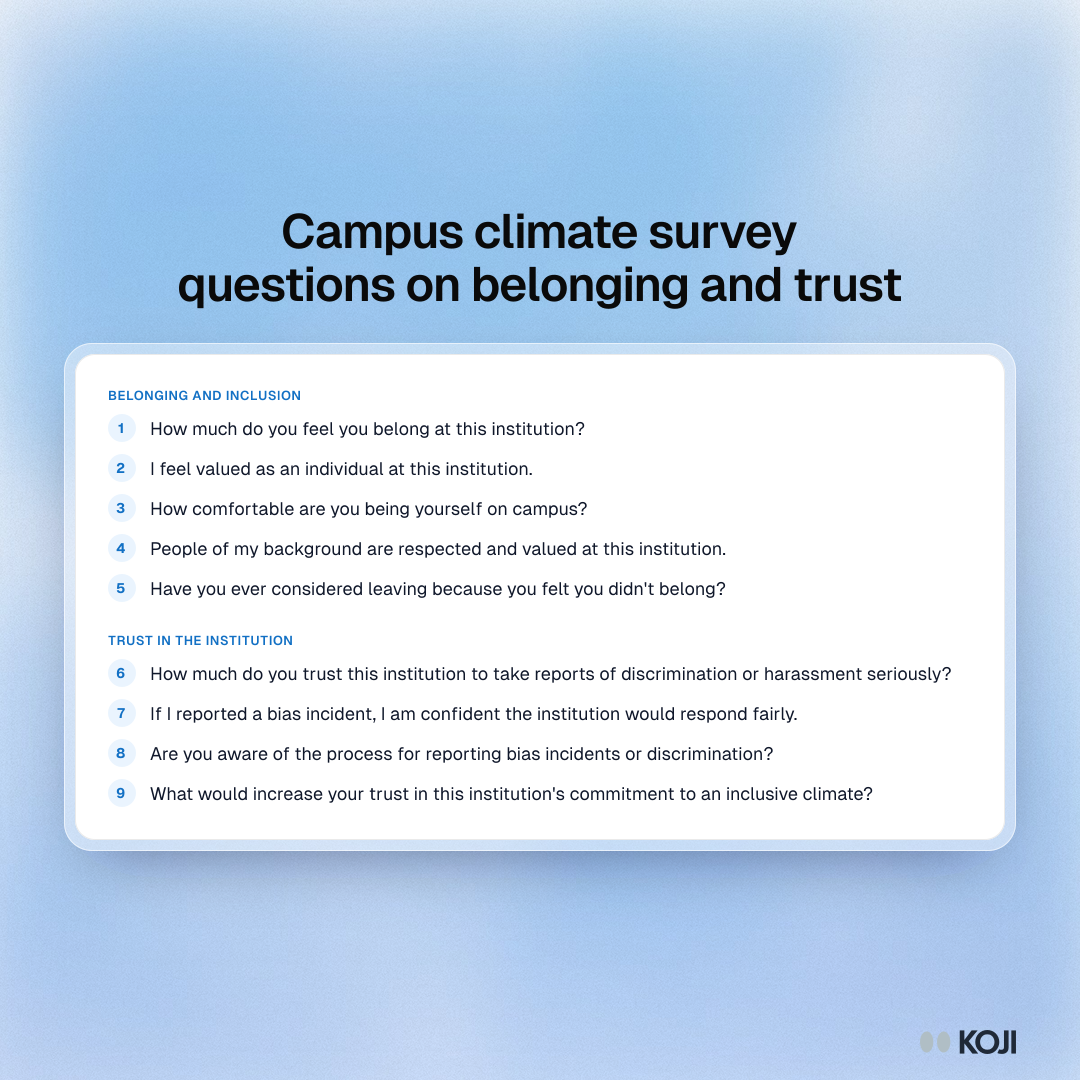
Question bank of nine campus climate survey questions in two sections: belonging and inclusion, and trust in the institution.

Question bank

Campus climate survey questions on belonging and trust
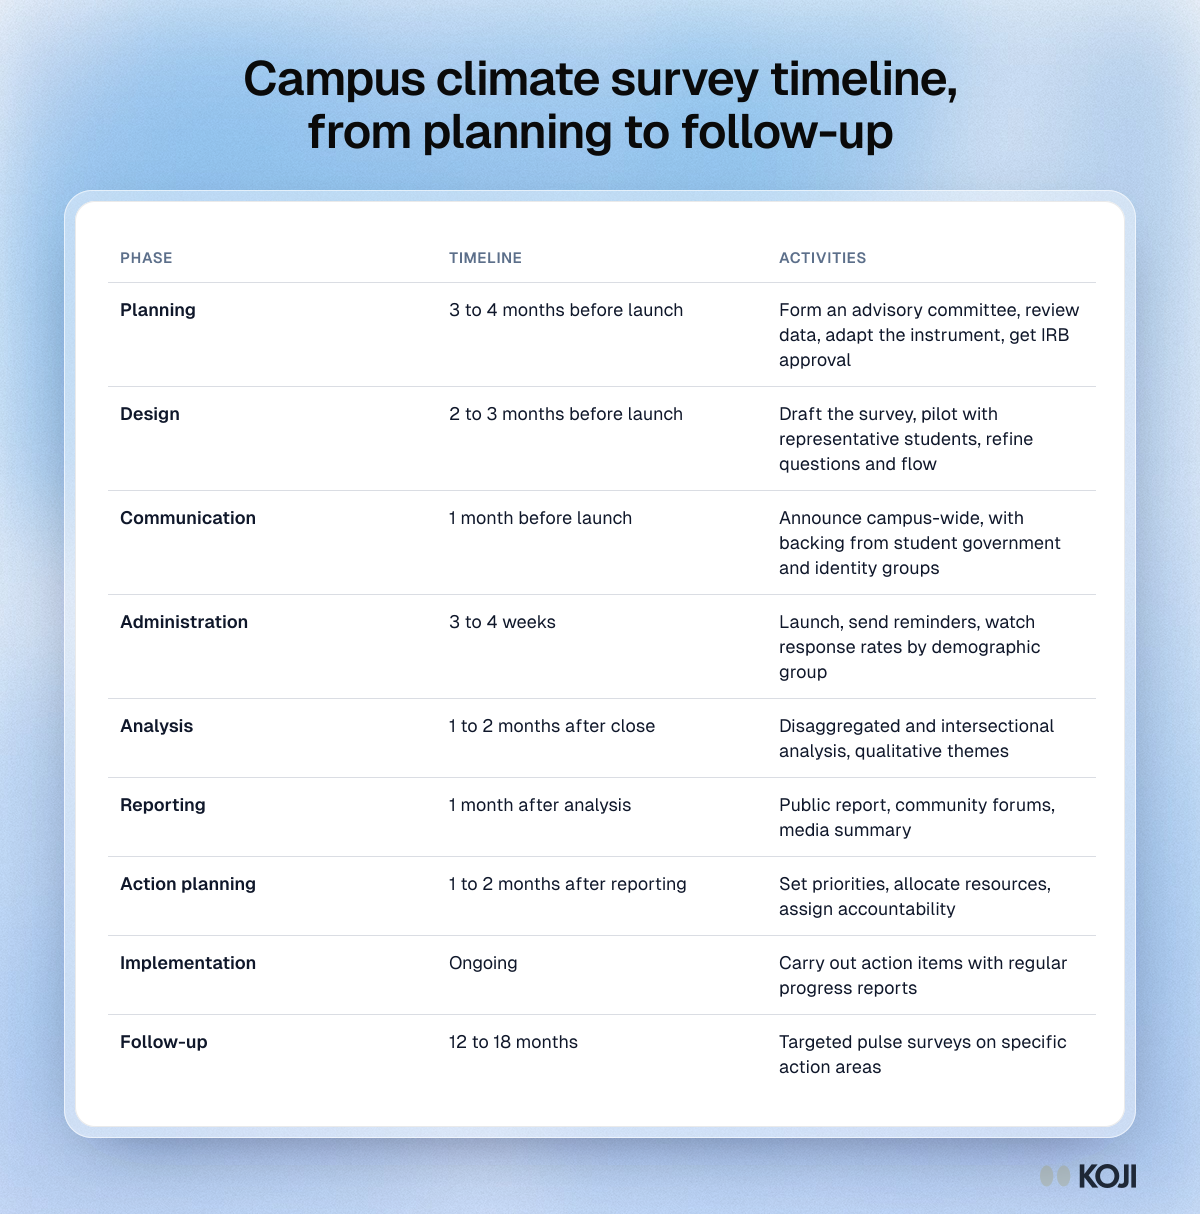
Table of the nine phases of a campus climate survey, from planning 3 to 4 months before launch to a follow-up pulse at 12 to 18 months.

Reference table

Campus climate survey timeline, from planning to follow-up
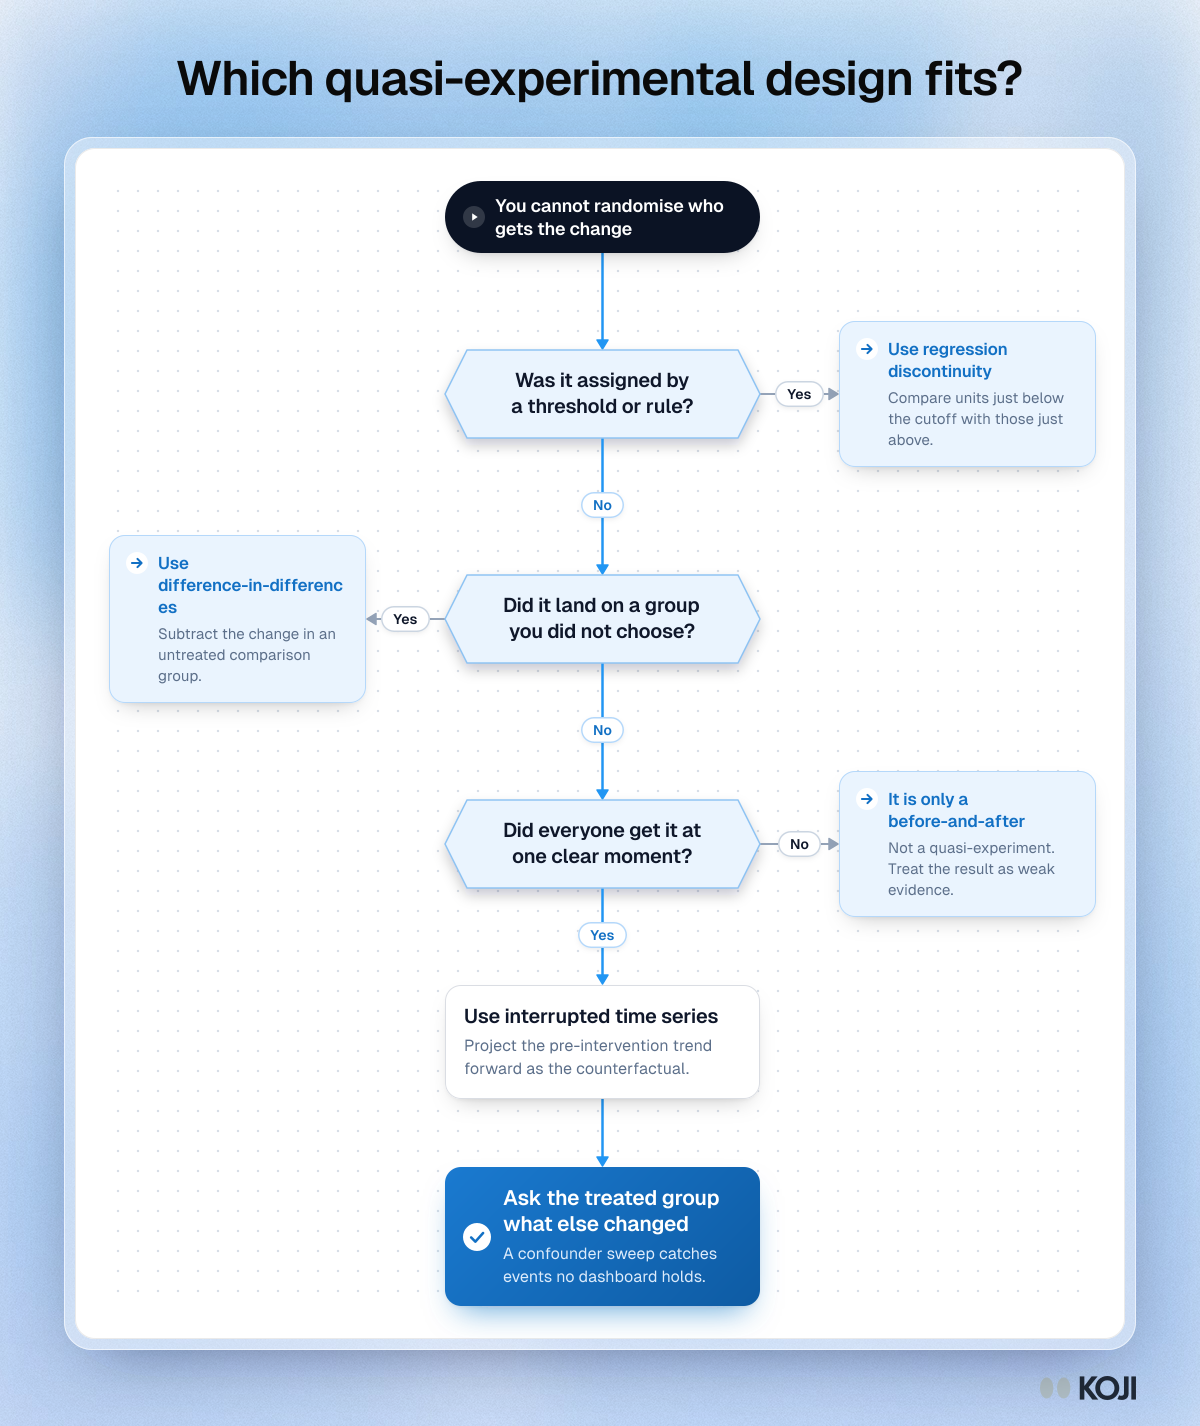
Flowchart for choosing a quasi-experimental design: three questions on how treatment was assigned, leading to one of three designs.

Flowchart

Which quasi-experimental design fits?
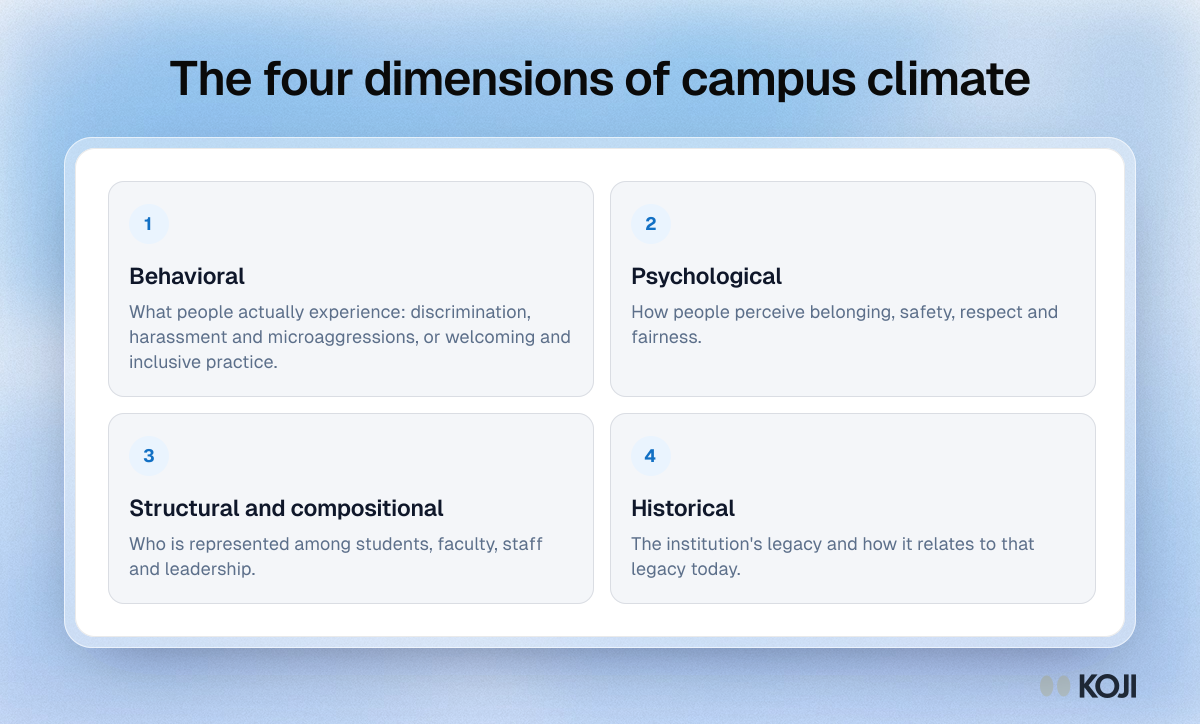
Framework of the four dimensions of campus climate: behavioral, psychological, structural and compositional, and historical.

Framework

The four dimensions of campus climate
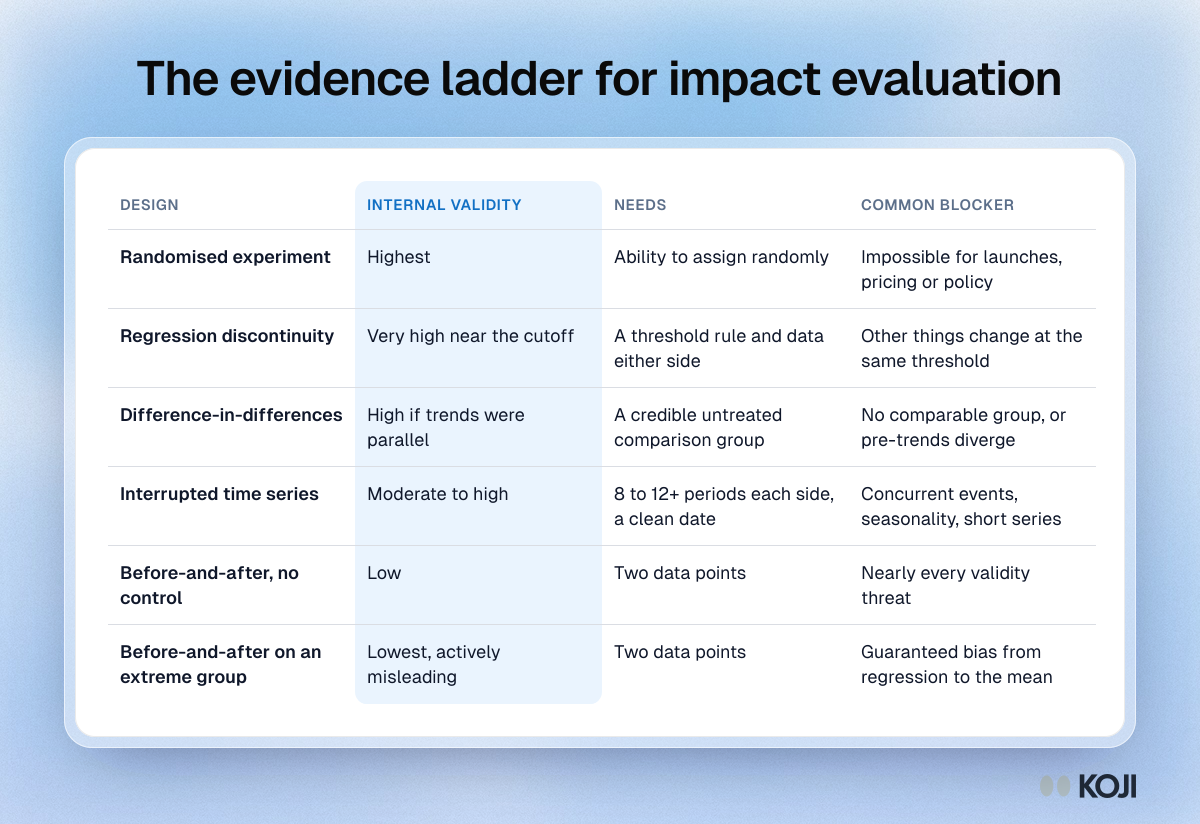
Table ranking six evaluation designs by internal validity, from randomised experiment down to before-and-after on an extreme group, with what each needs.

Reference table

The evidence ladder for impact evaluation
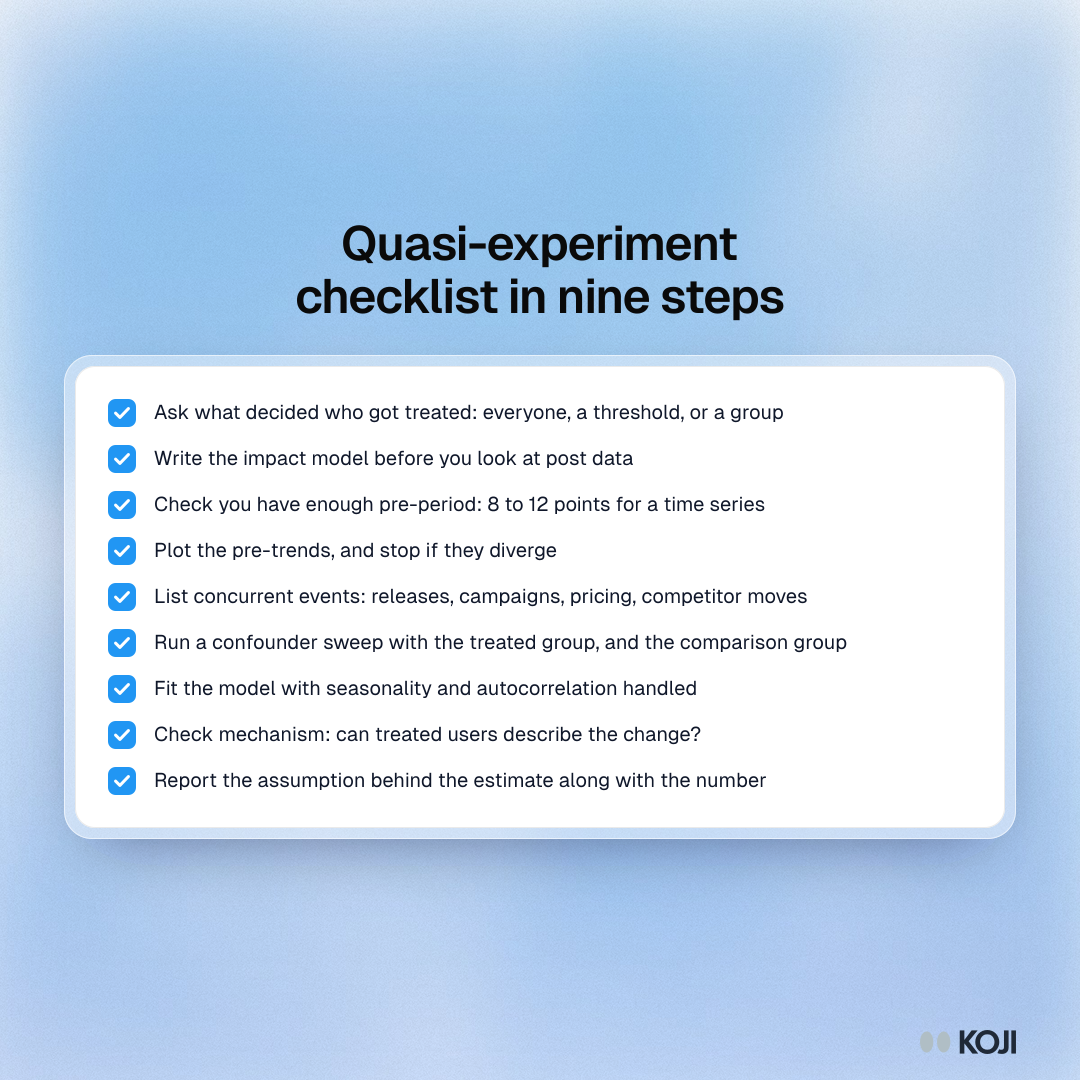
Checklist of nine steps for a quasi-experiment, from naming the design and writing the impact model to checking mechanism and reporting assumptions.

Checklist

Quasi-experiment checklist in nine steps
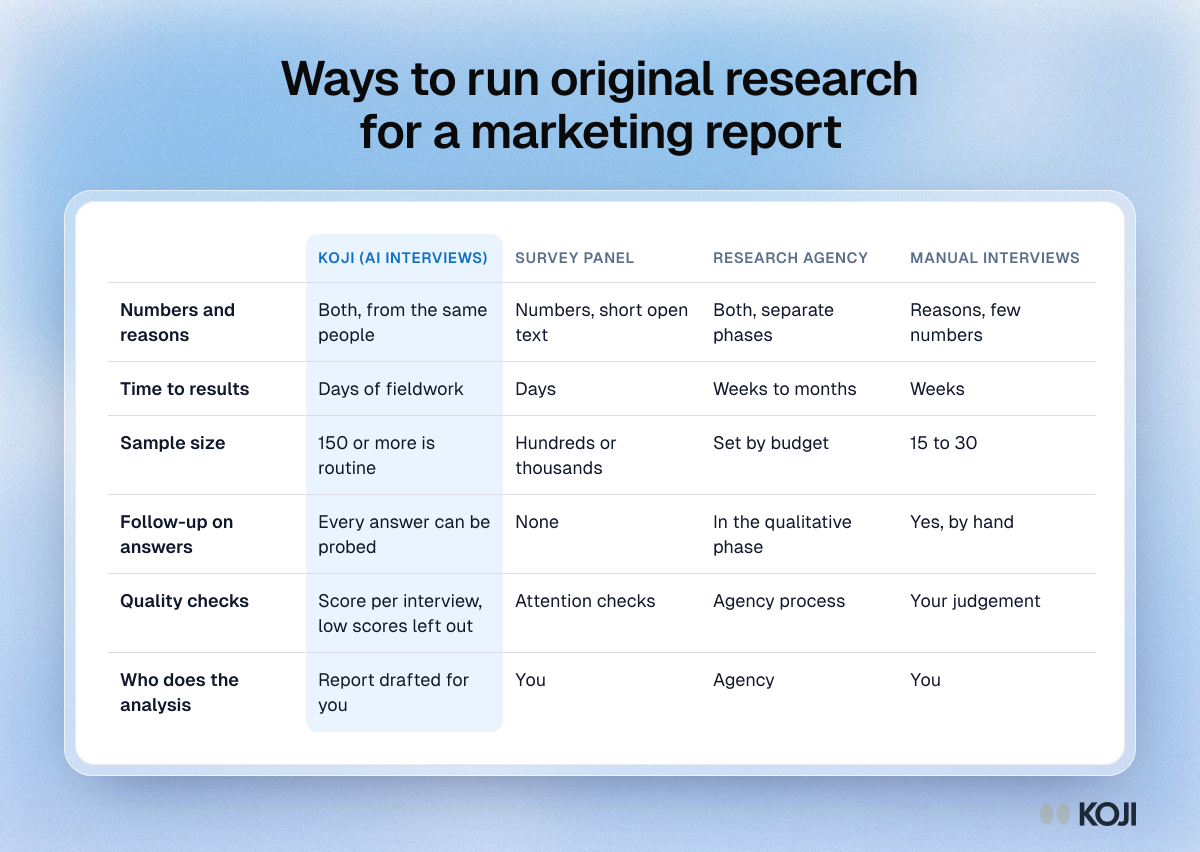
Table comparing Koji AI interviews, survey panels, research agencies and manual interviews on depth, speed, sample size, follow-up, quality and analysis.

Reference table

Ways to run original research for a marketing report
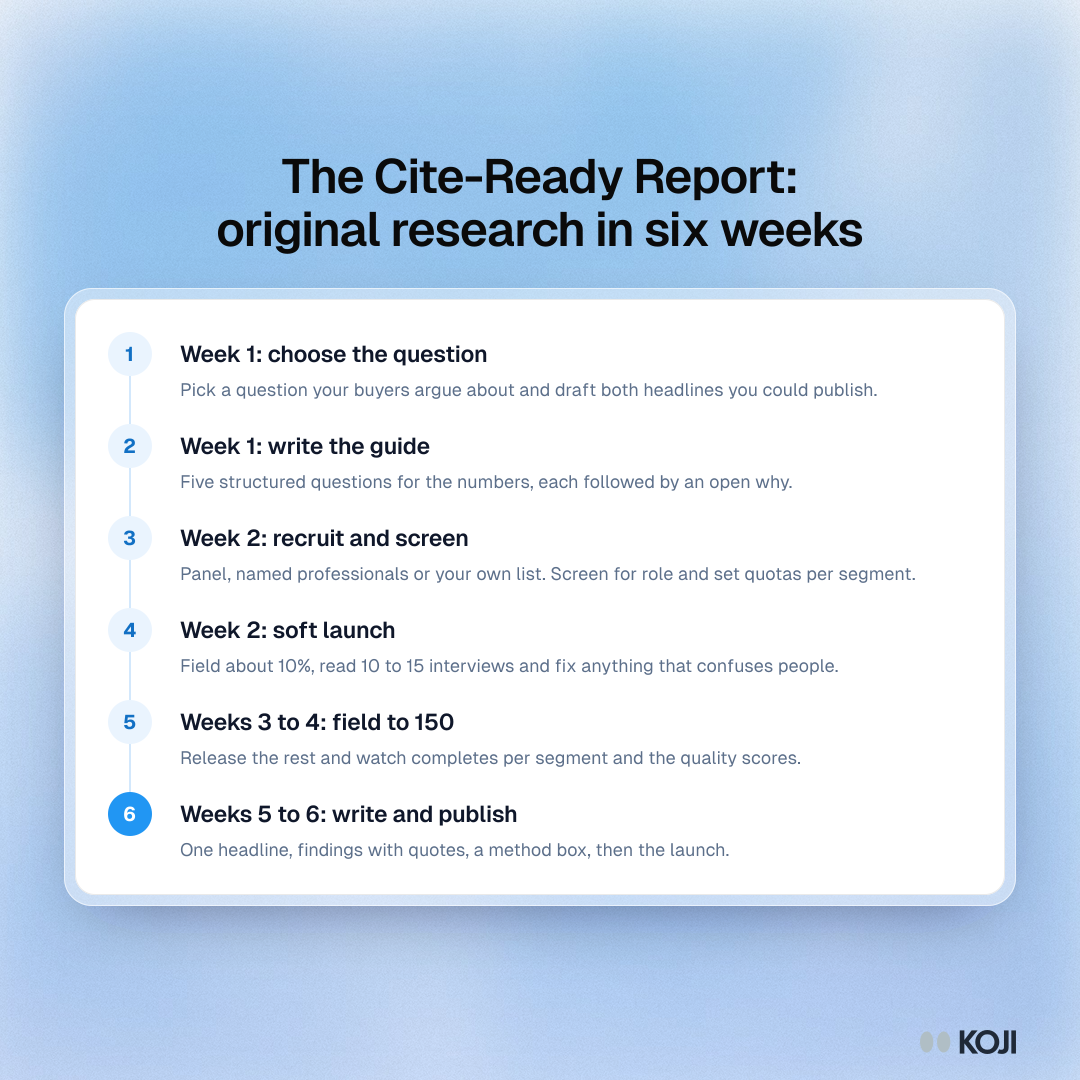
Process of the six-week Cite-Ready Report method: choose the question, write the guide, recruit and screen, soft launch, field to 150, write and publish.

Process

The Cite-Ready Report: original research in six weeks
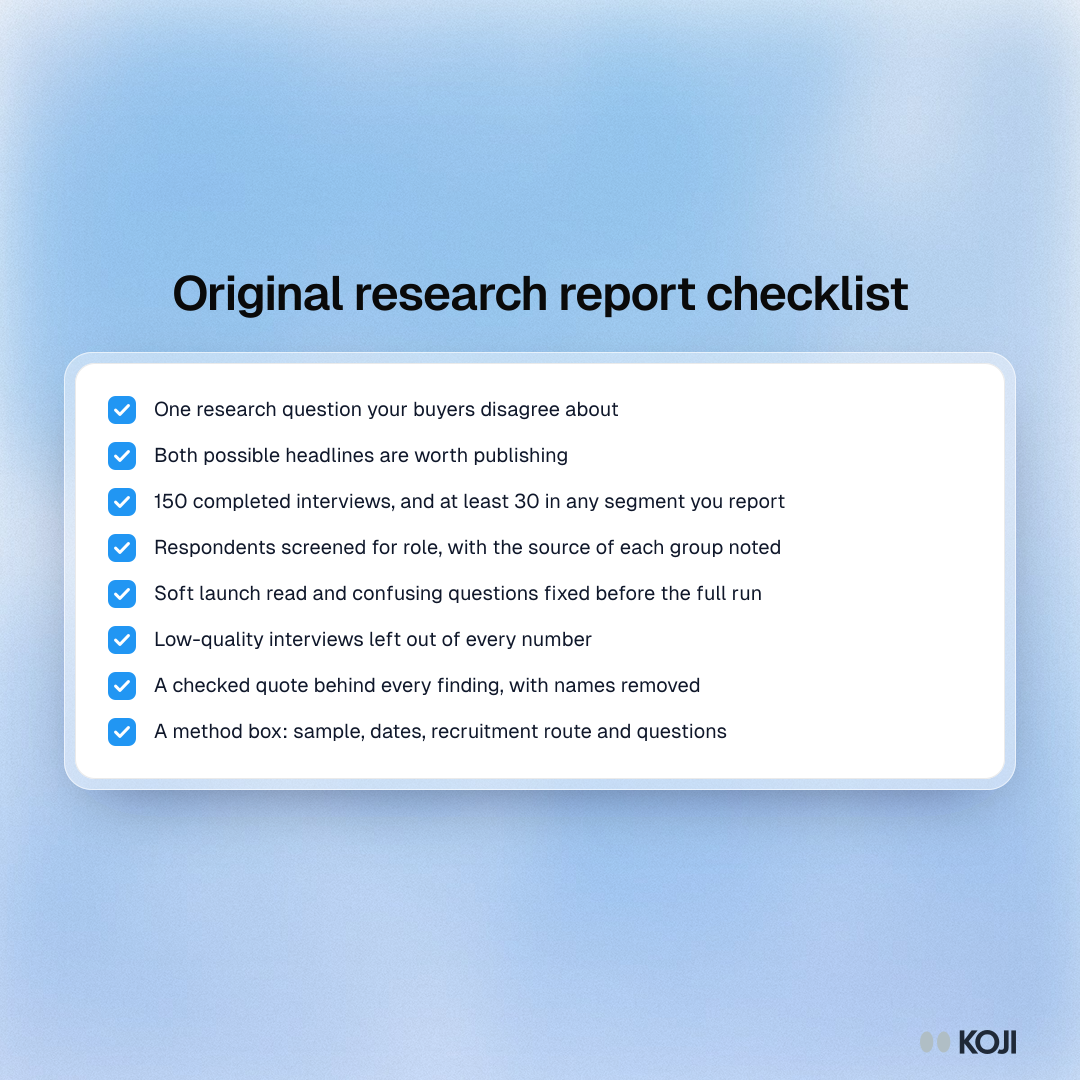
Checklist for publishing original research: a contested question, 150 interviews, 30 per segment, screening, soft launch, quality checks, quotes, method box.

Checklist

Original research report checklist
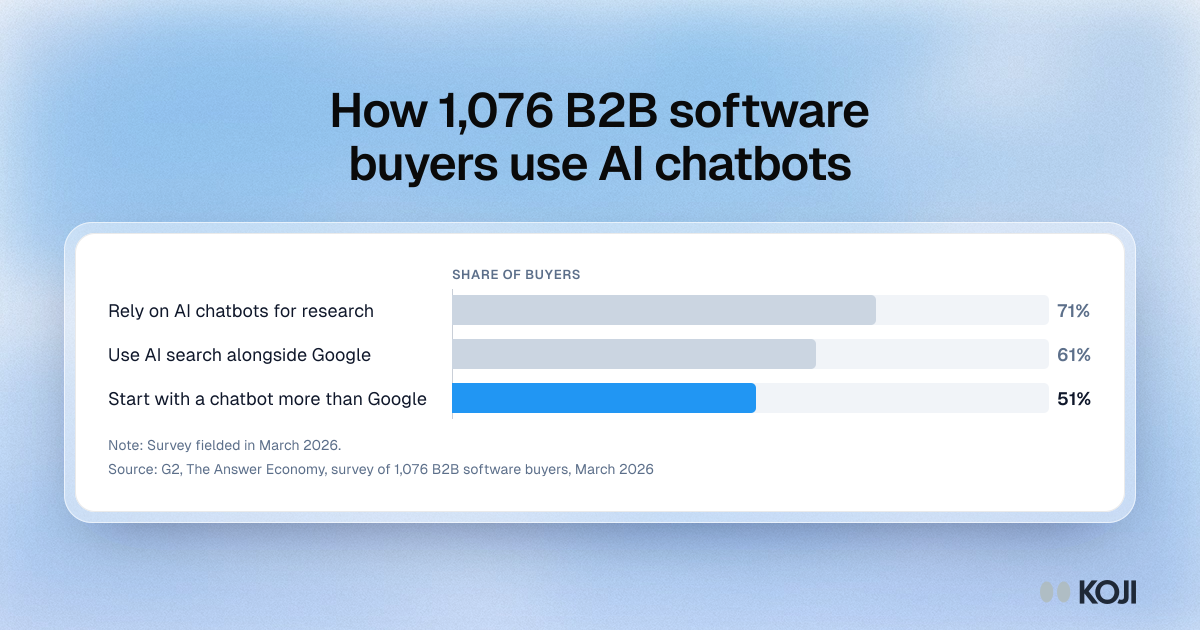
Bar chart of G2's 2026 survey of 1,076 software buyers: 71% rely on AI chatbots, 61% pair AI search with Google, 51% start with a chatbot.

Bar chart

How 1,076 B2B software buyers use AI chatbots
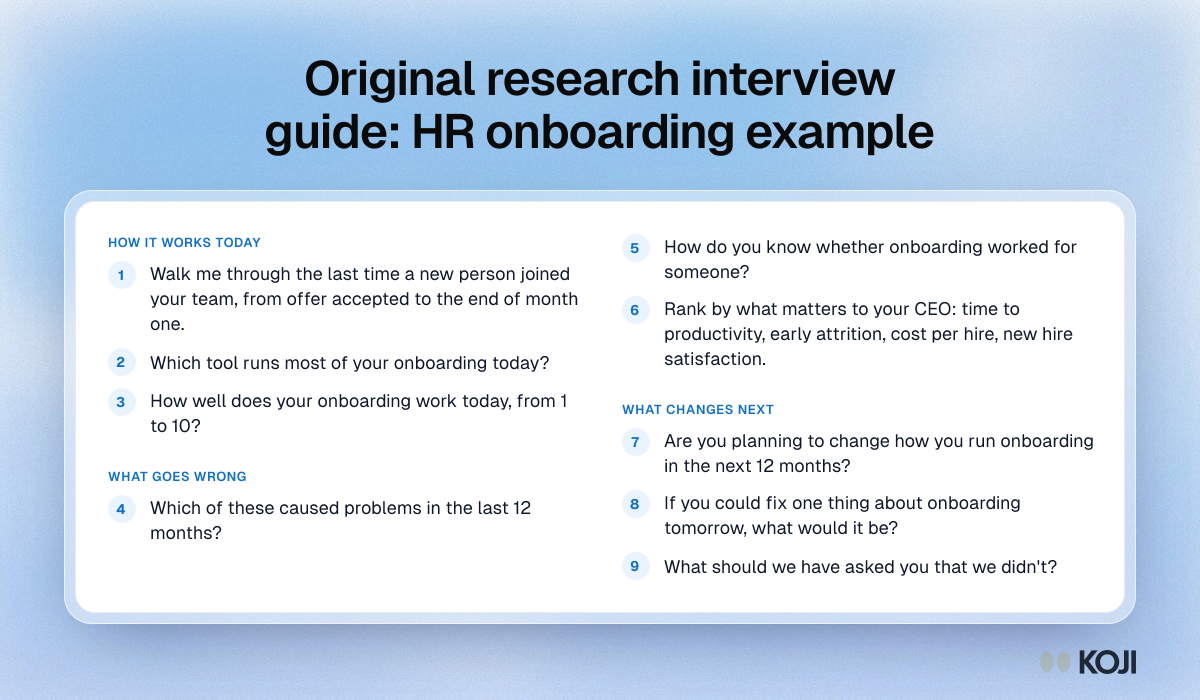
Question bank for an original research interview on employee onboarding, in three sections: how it works today, what goes wrong and what changes next.

Question bank

Original research interview guide: HR onboarding example
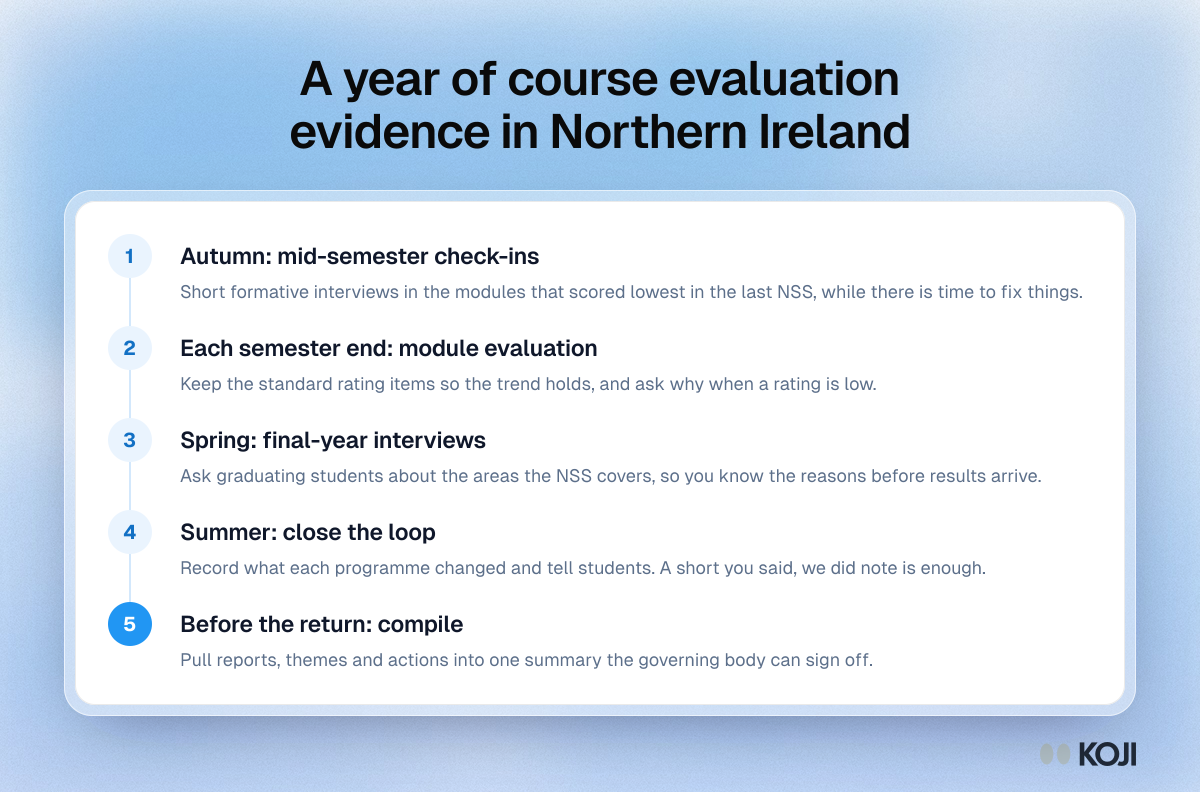
Process in five steps for a year of course evaluation evidence in Northern Ireland, from mid-semester check-ins to the governing body summary

Process

A year of course evaluation evidence in Northern Ireland
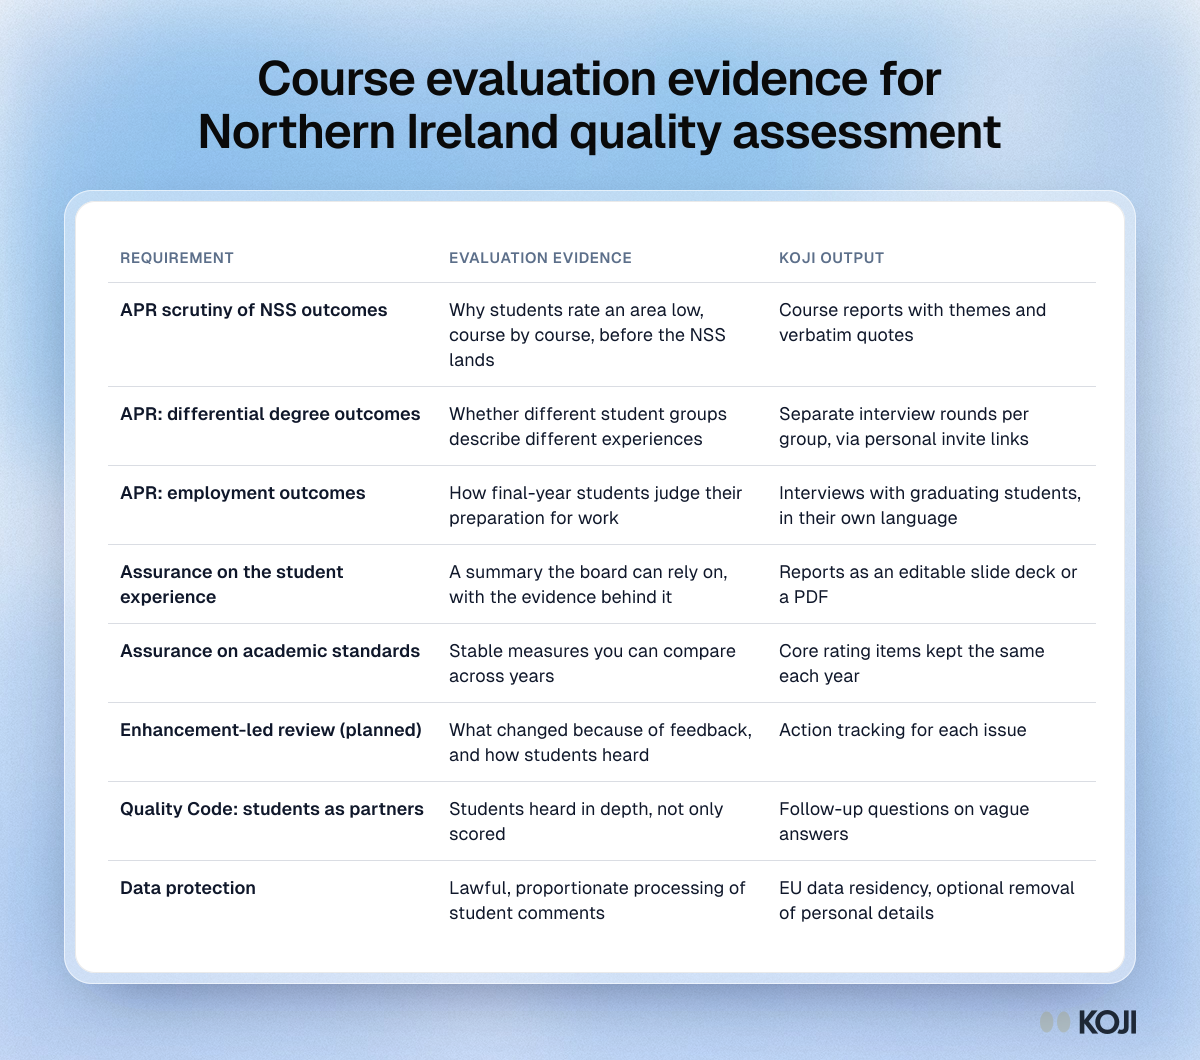
Table mapping Northern Ireland quality requirements, from NSS scrutiny to enhancement-led review, to course evaluation evidence and Koji outputs

Reference table

Course evaluation evidence for Northern Ireland quality assessment
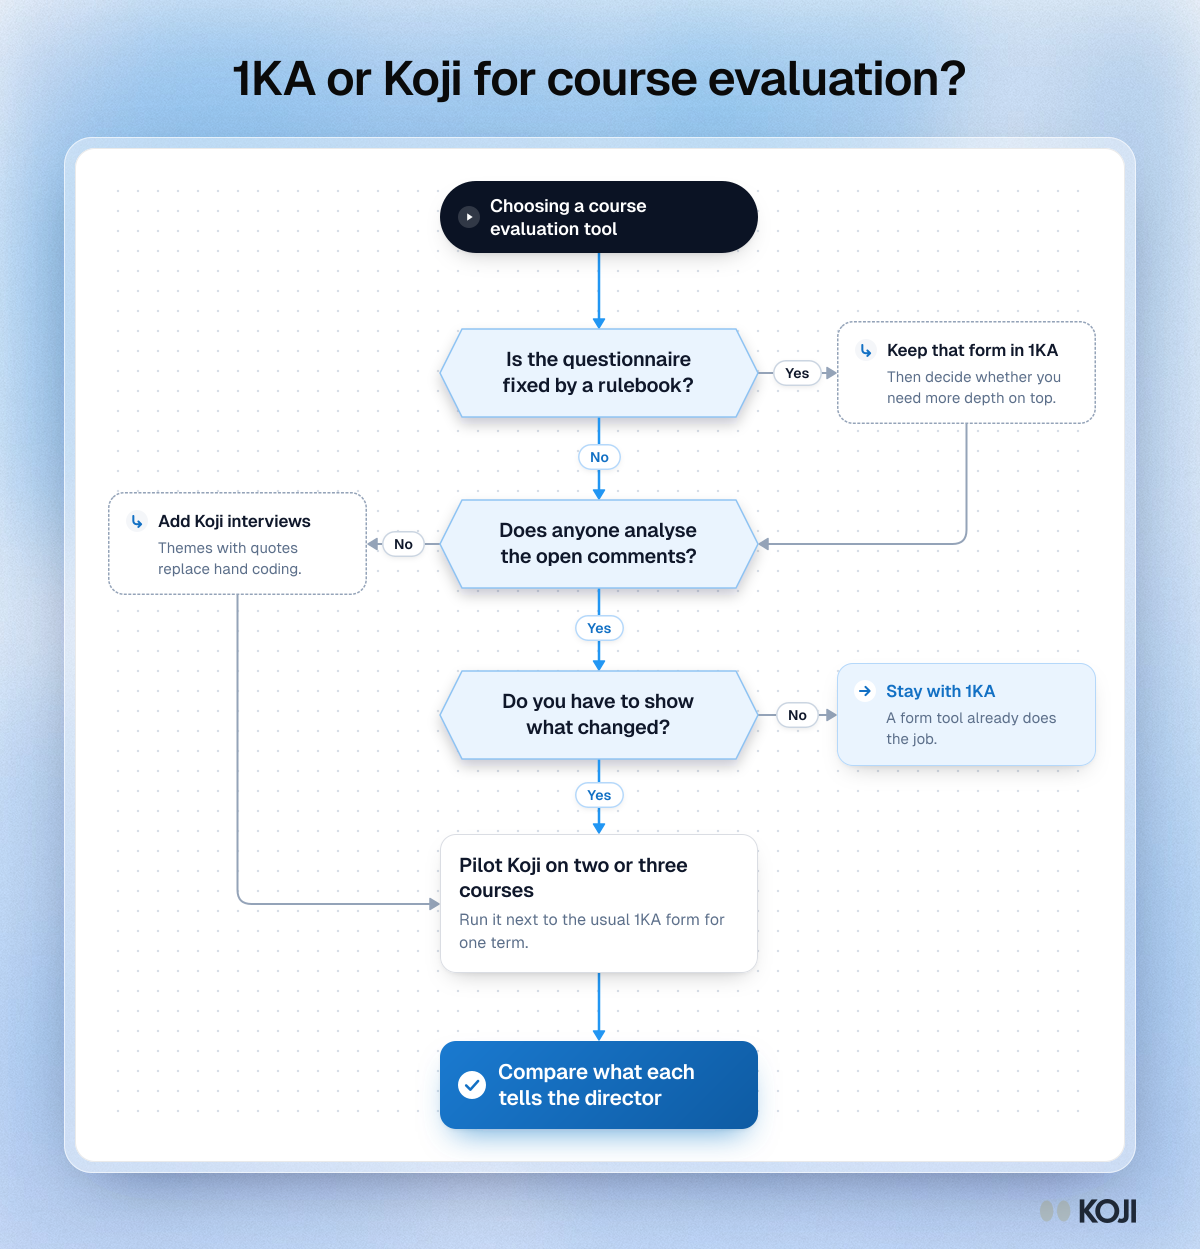
Flowchart for choosing between 1KA and Koji: three questions about a fixed questionnaire, comment analysis and evidence of change, ending in a pilot

Flowchart

1KA or Koji for course evaluation?
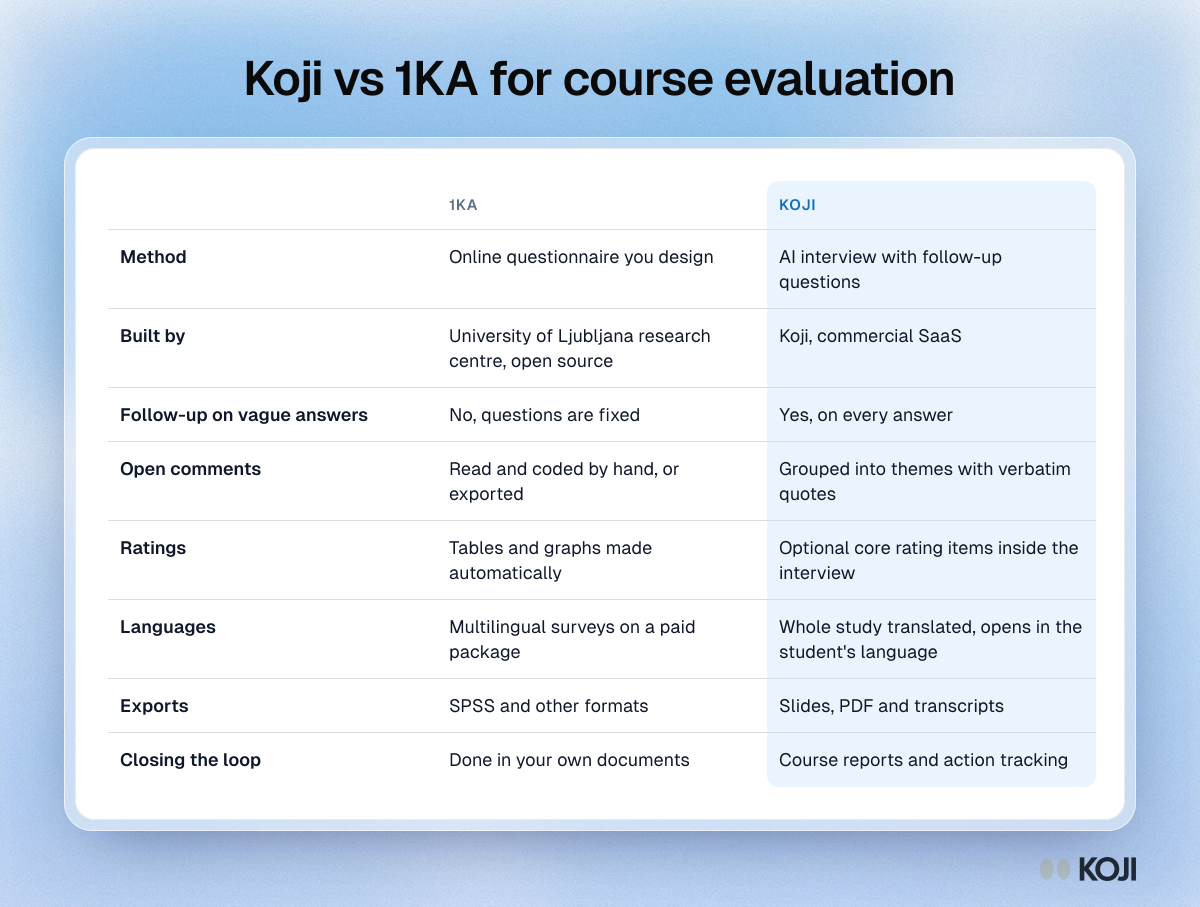
Comparison table of 1KA and Koji for course evaluation: method, follow-up questions, comment analysis, languages, exports and closing the loop

Reference table

Koji vs 1KA for course evaluation
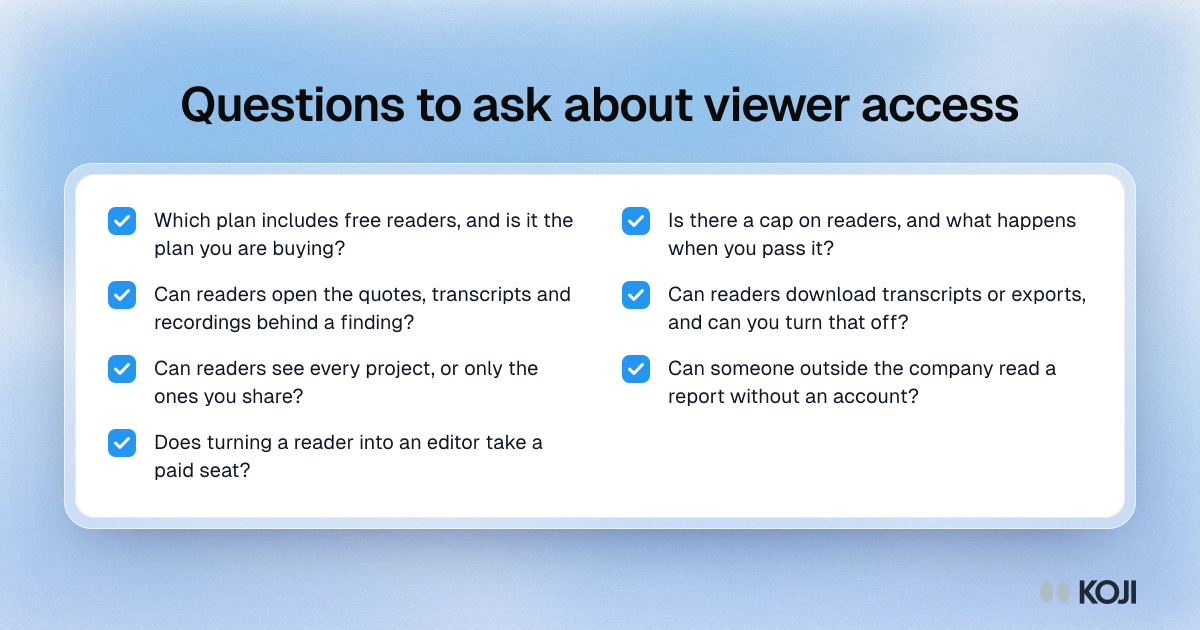
Checklist of questions to ask a research tool vendor about free viewer access, from the plans that include it to what viewers can download.

Checklist

Questions to ask about viewer access
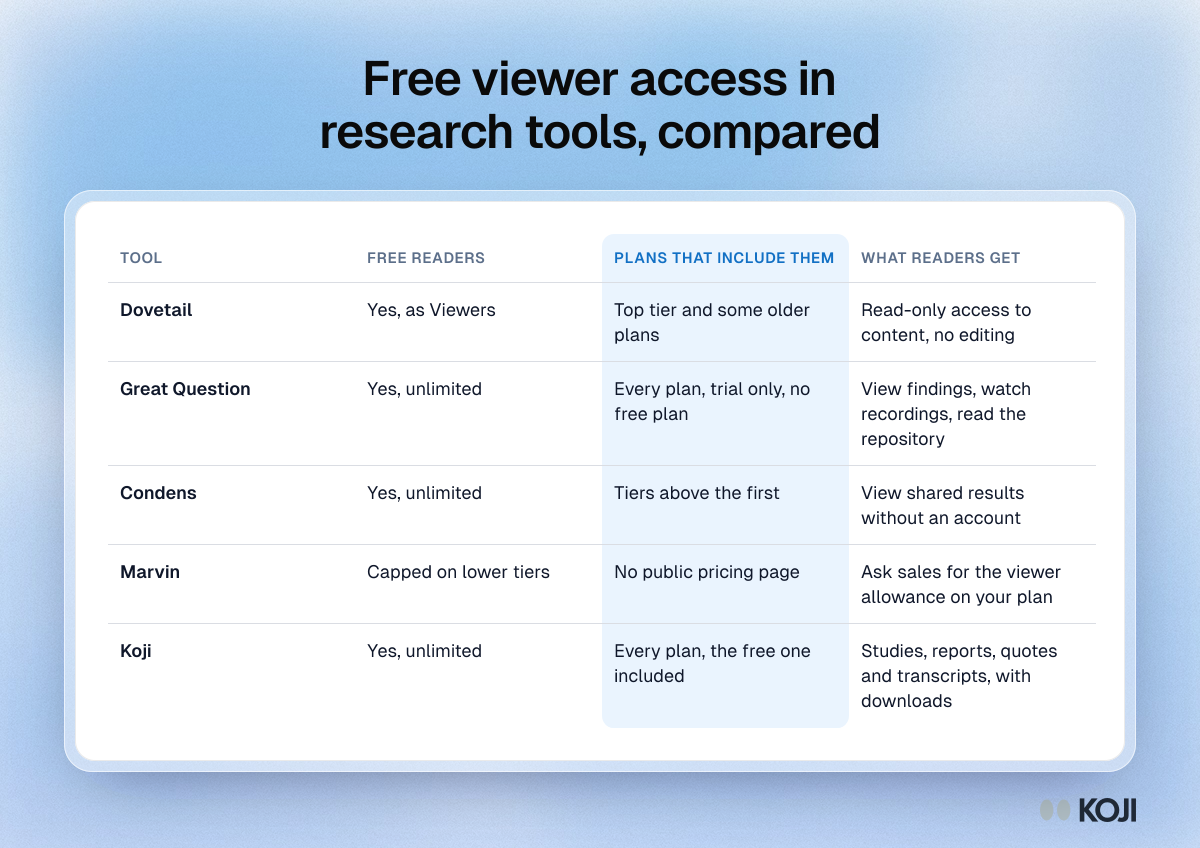
Table comparing free reader access in Dovetail, Great Question, Condens, Marvin and Koji: which plans include it and what readers can do.

Reference table

Free viewer access in research tools, compared
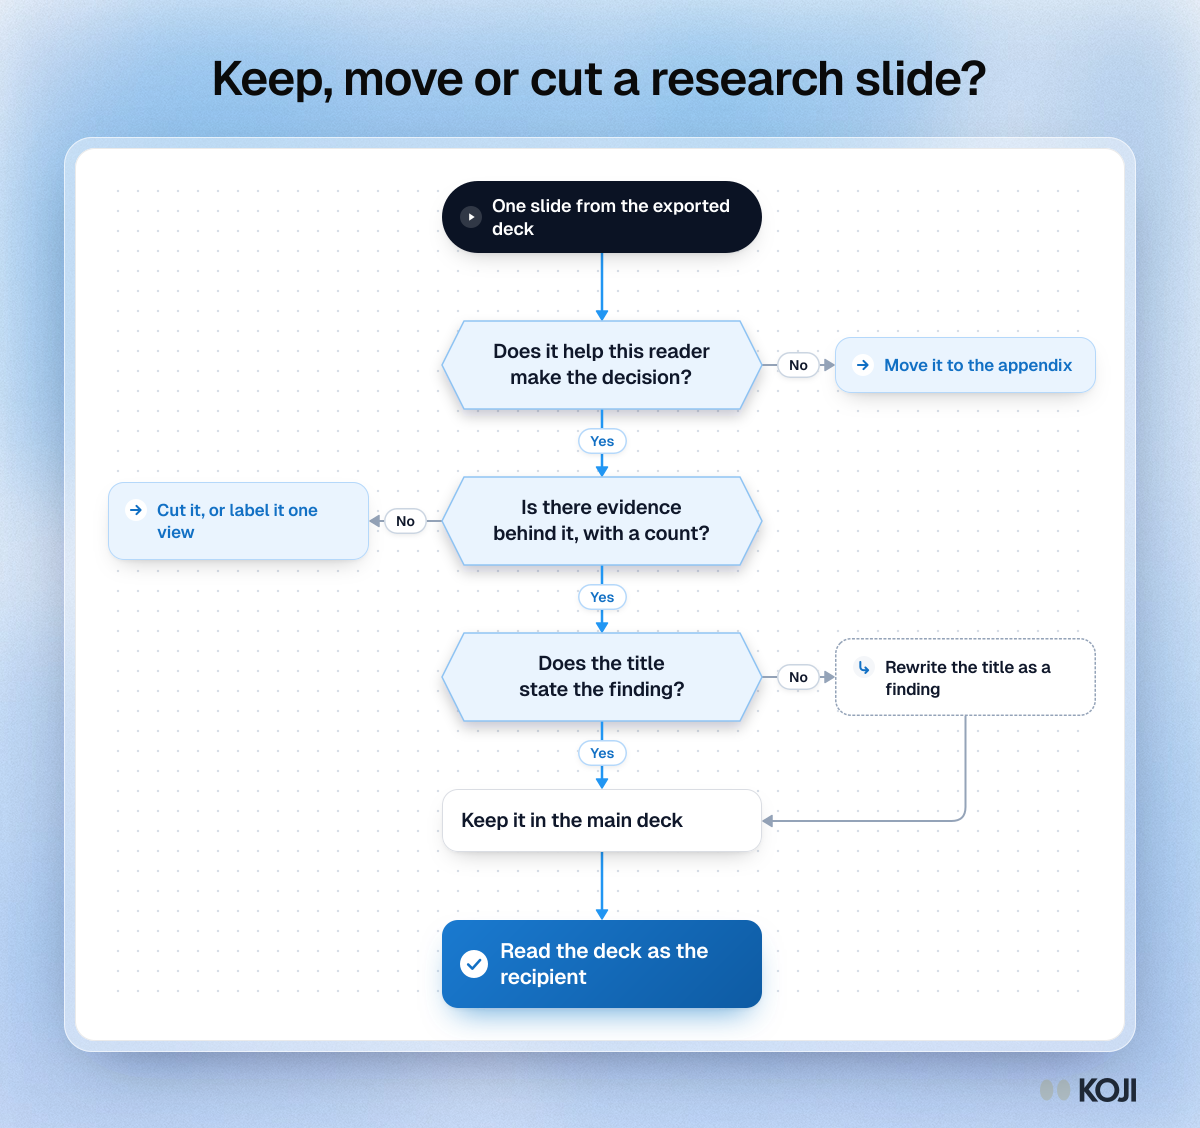
Flowchart for sorting slides in a research deck: three questions decide whether a slide moves to the appendix, gets cut or stays with a rewritten title.

Flowchart

Keep, move or cut a research slide?
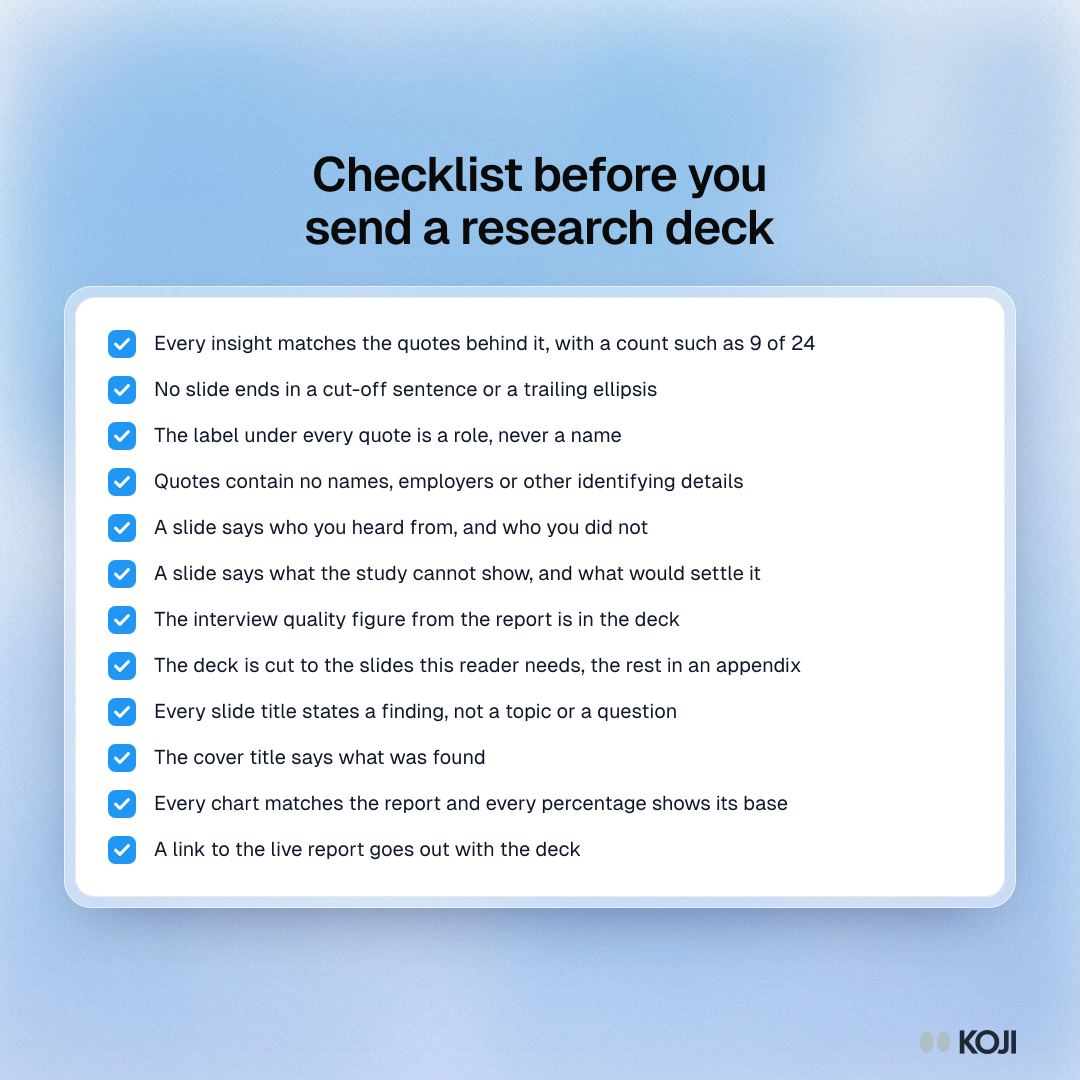
Checklist of twelve checks for an exported research deck, from matching insights to quotes and labelling quotes by role to adding a limits slide.

Checklist

Checklist before you send a research deck
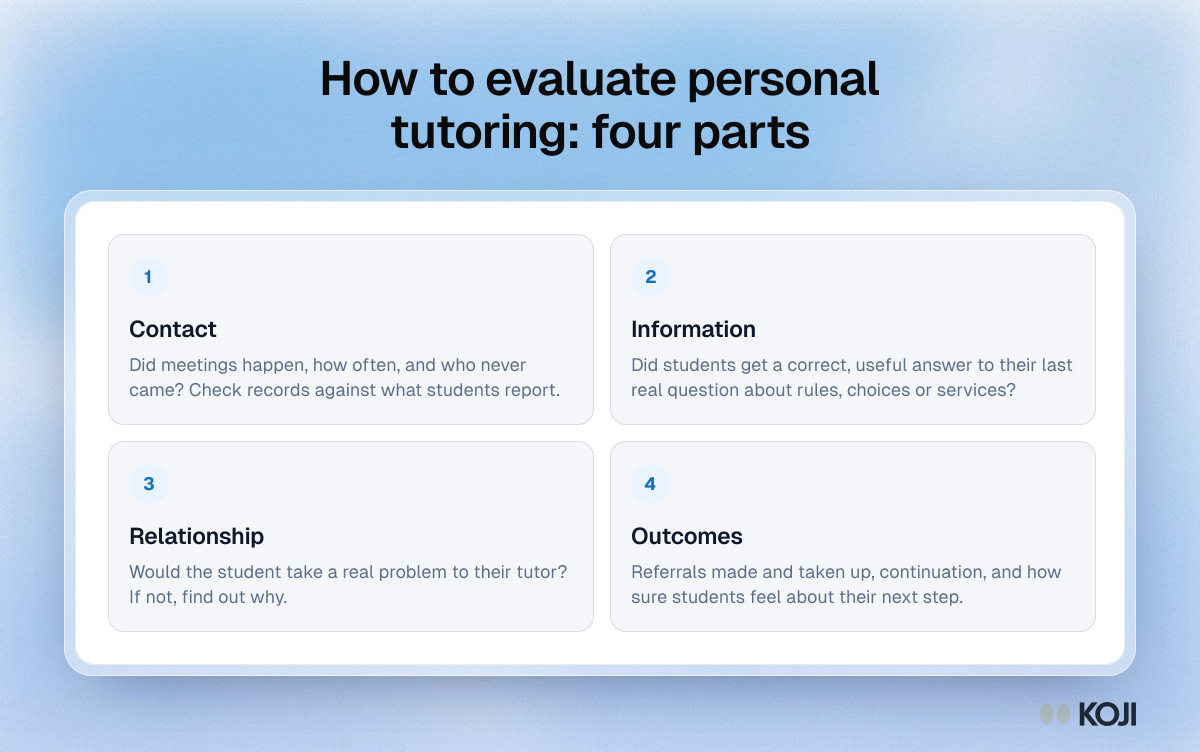
Framework for evaluating personal tutoring in four parts: contact, information, relationship and outcomes, each with the evidence to collect.

Framework

How to evaluate personal tutoring: four parts
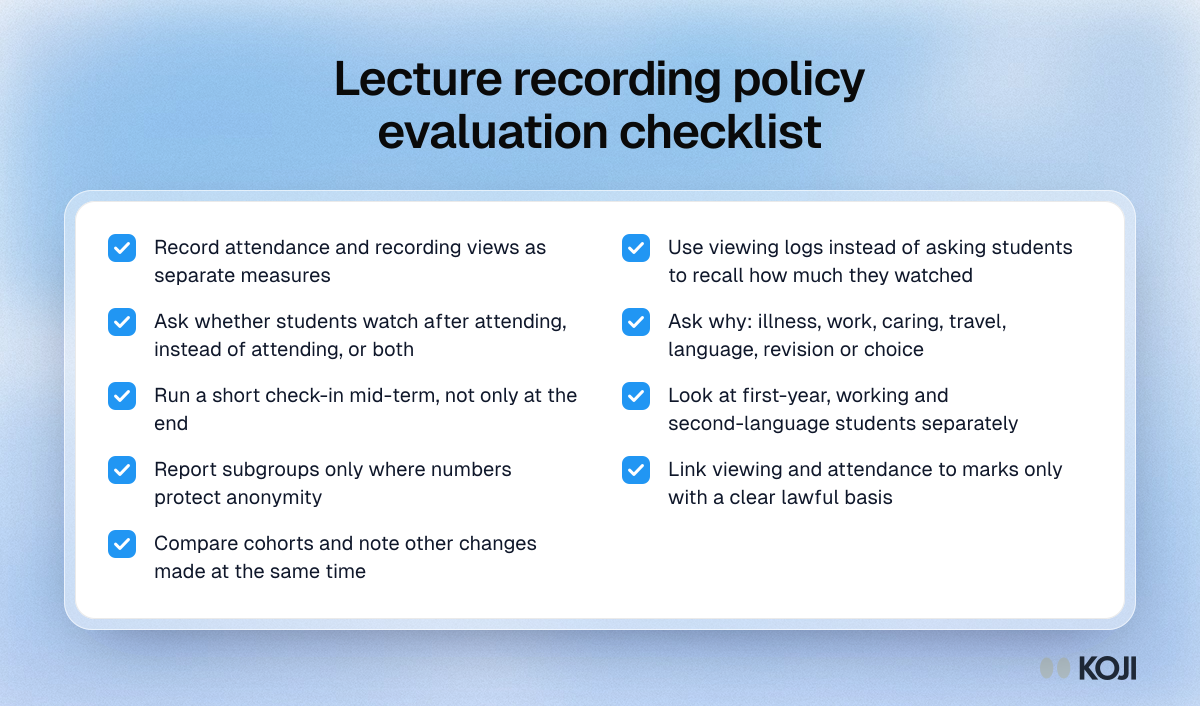
Checklist for evaluating a lecture recording policy, from measuring attendance and viewing separately to asking students why they watch and comparing cohorts.

Checklist

Lecture recording policy evaluation checklist
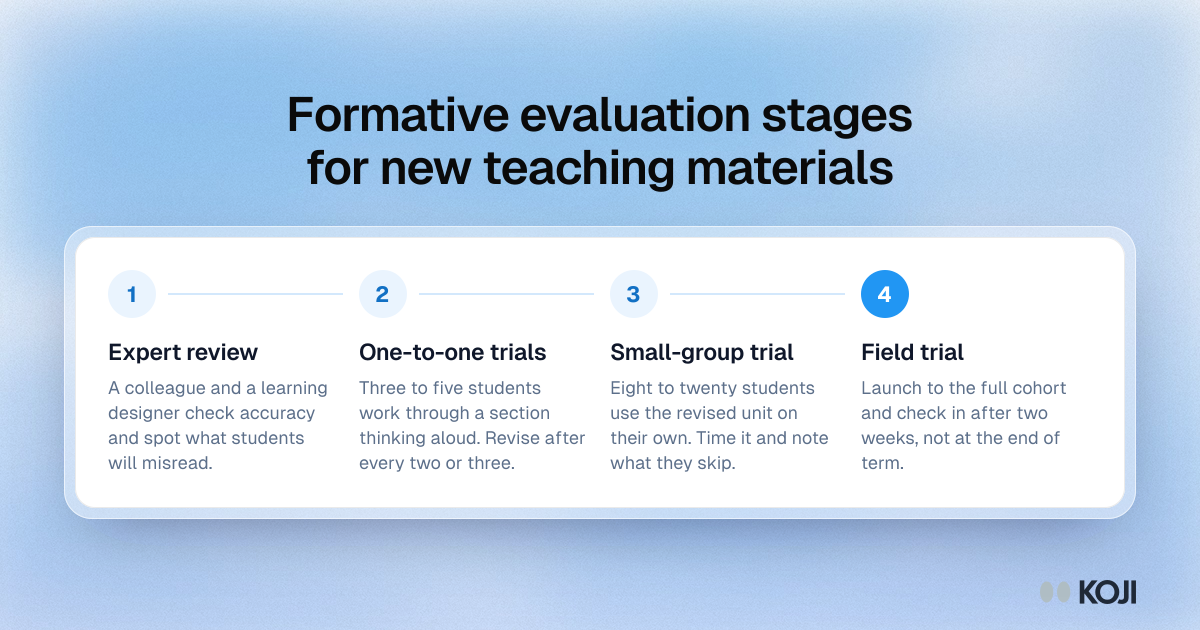
Process diagram of four formative evaluation stages for new teaching materials: expert review, one-to-one trials, a small-group trial and a field trial.

Process

Formative evaluation stages for new teaching materials
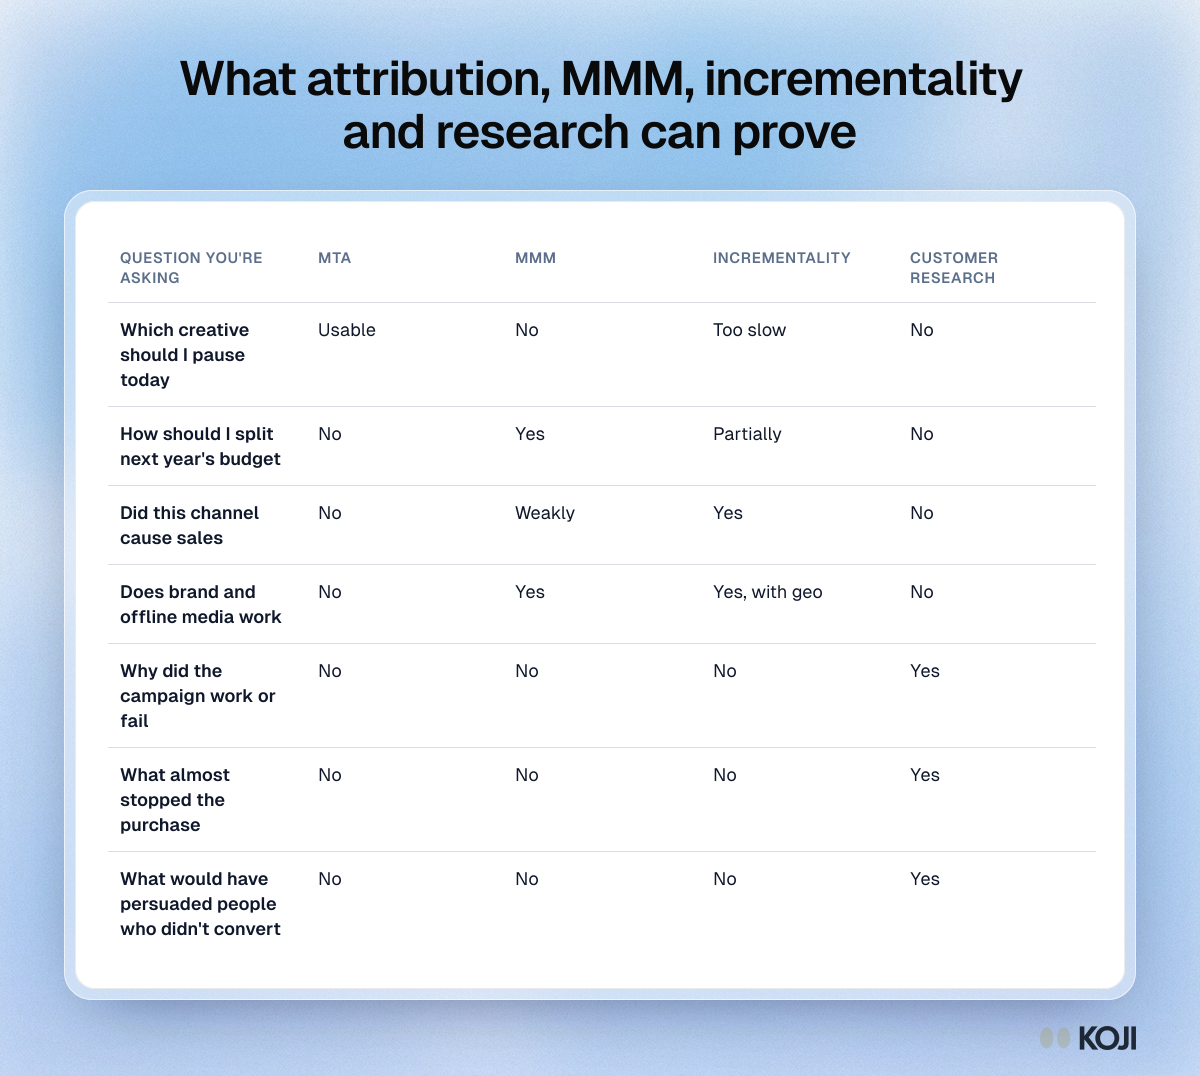
Table of seven marketing questions and which of attribution, MMM, incrementality testing and customer research can answer each, from budgets to why.

Reference table

What attribution, MMM, incrementality and research can prove
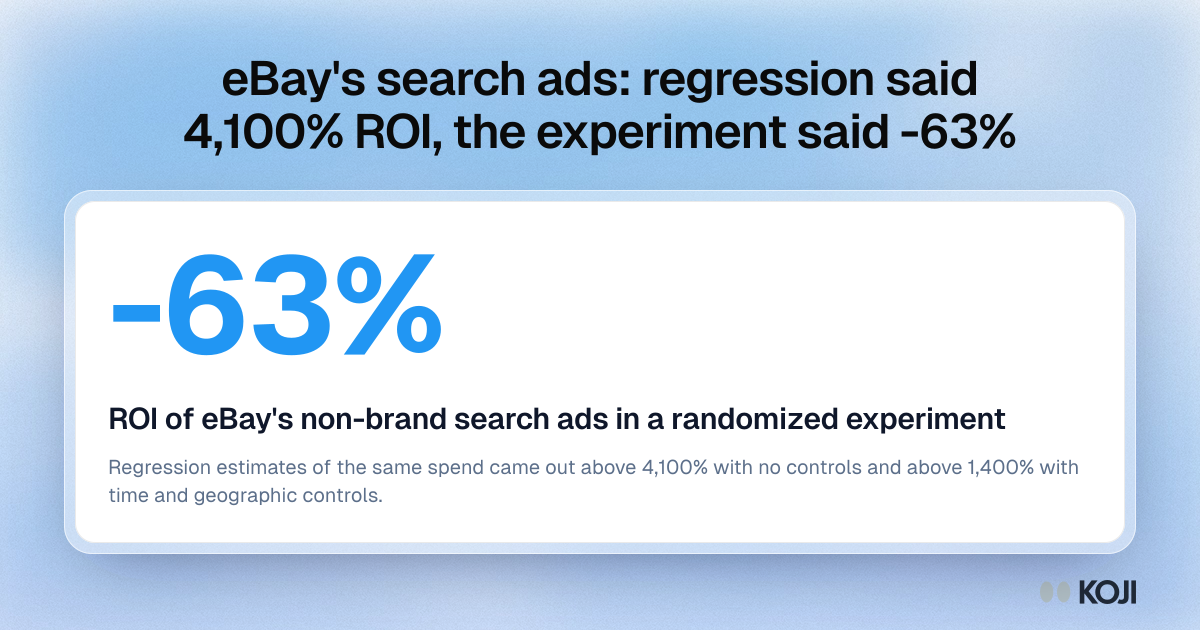
Stat card: eBay's randomized experiment on non-brand search ads found an ROI of minus 63%, where regression estimates had put it above 4,100%.

Key figure

eBay's search ads: regression said 4,100% ROI, experiment said -63%
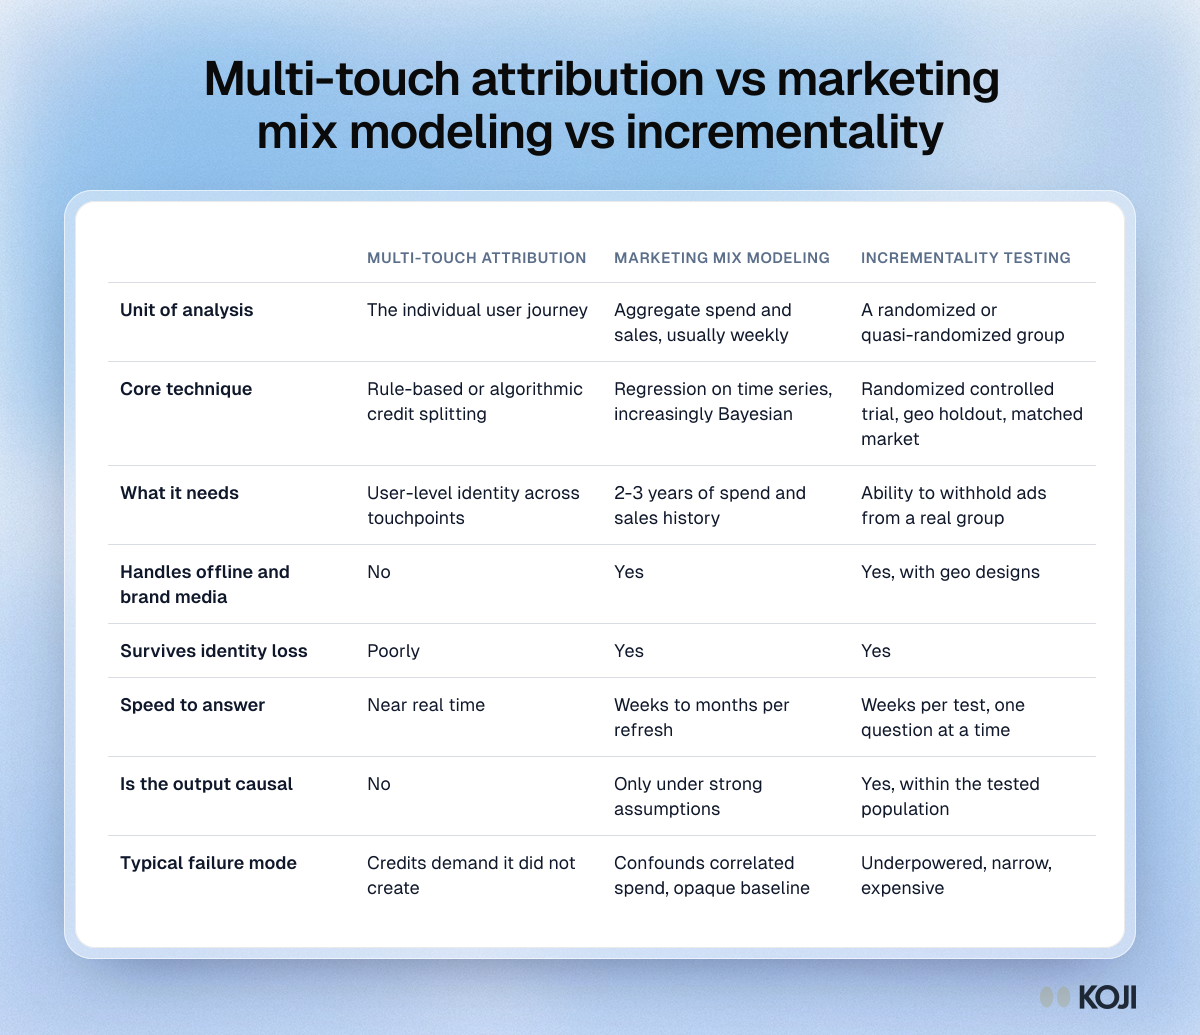
Table comparing multi-touch attribution, marketing mix modeling and incrementality testing on data needs, offline media, identity loss, speed and causality.

Reference table

Multi-touch attribution vs marketing mix modeling vs incrementality
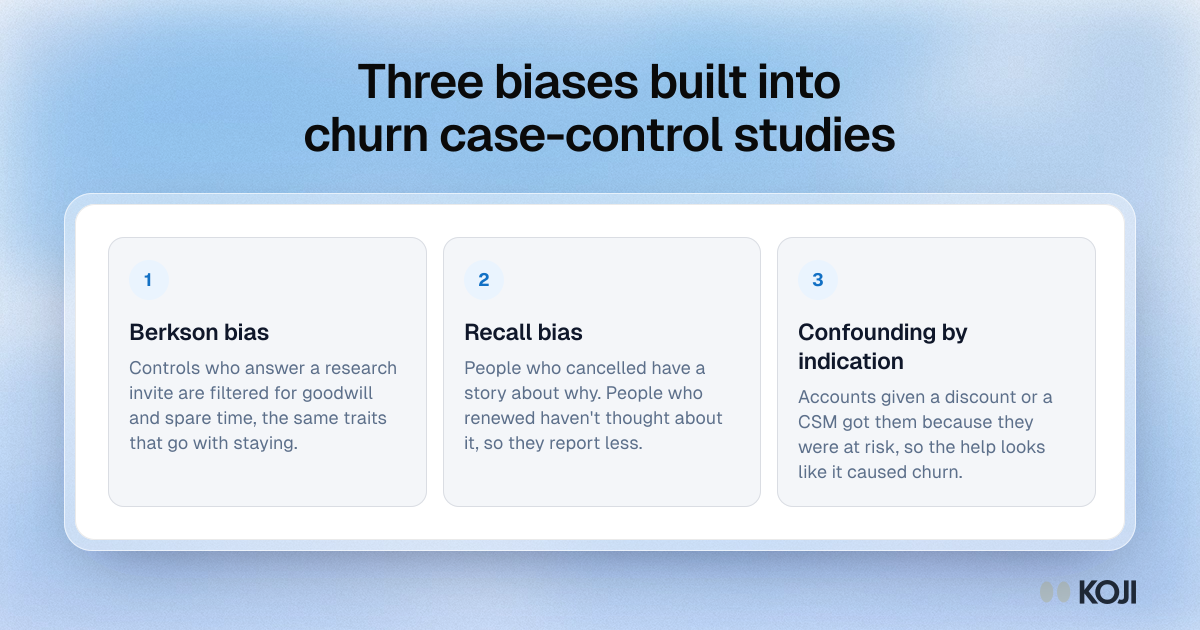
Framework of three biases in churn case-control research: Berkson bias from who answers invites, recall bias, and confounding by indication.

Framework

Three biases built into churn case-control studies
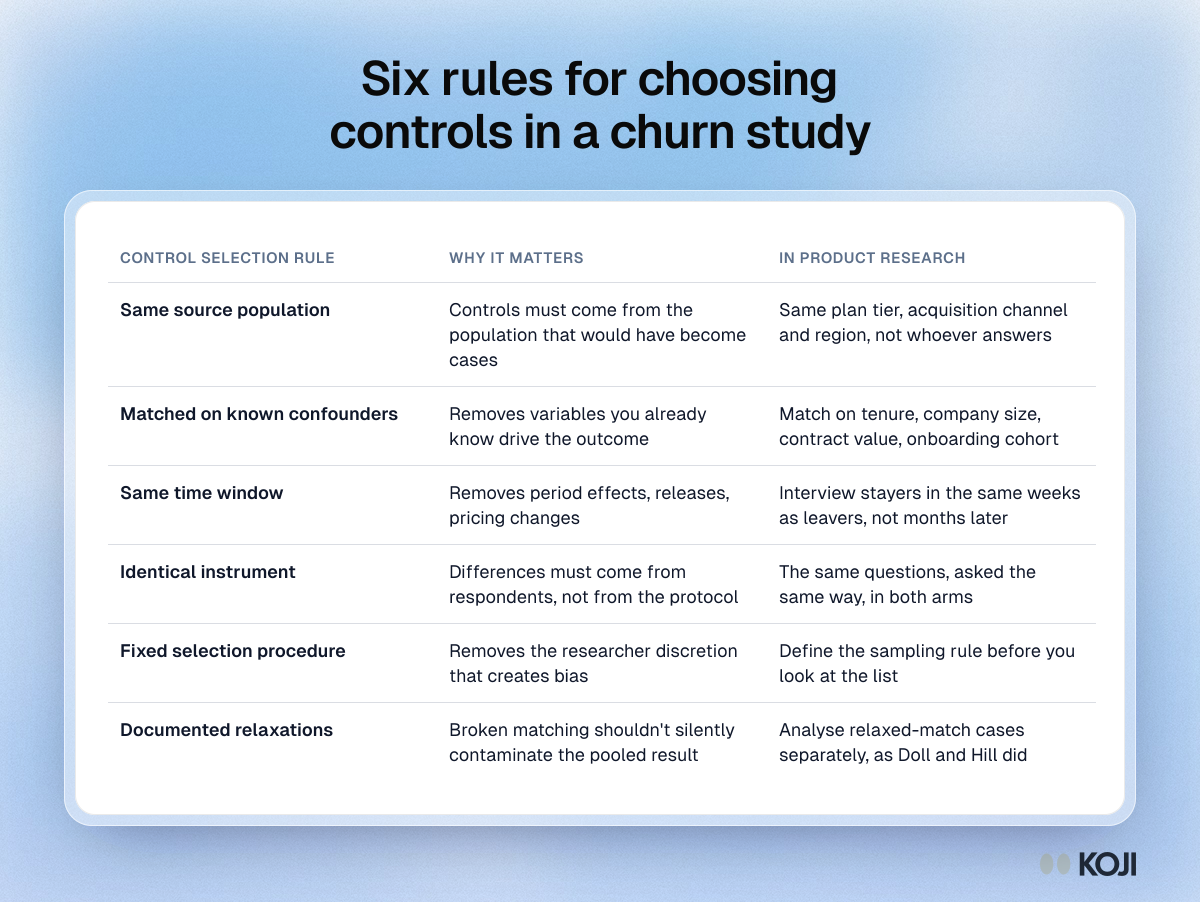
Table of six rules for choosing a control group in churn research, from same source population and matching on tenure to an identical interview instrument.

Reference table

Six rules for choosing controls in a churn study
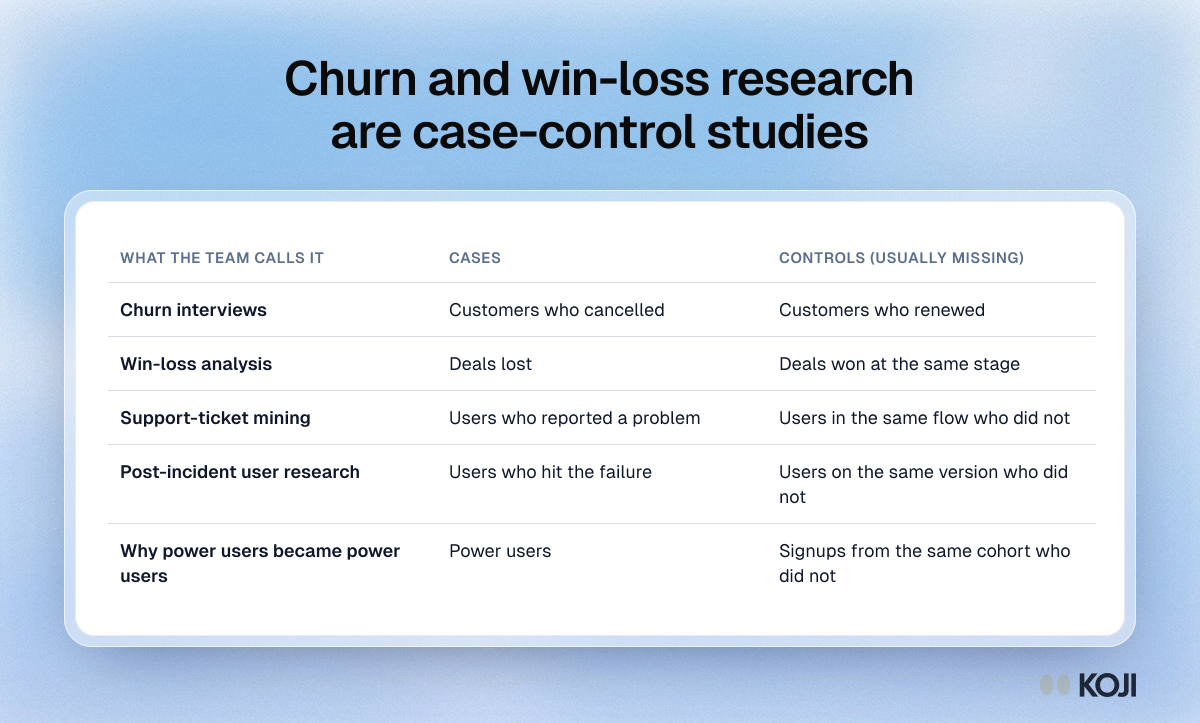
Table of five product research studies as case-control designs, such as churn interviews, with cancelled customers as cases and renewed ones as controls.

Reference table

Churn and win-loss research are case-control studies
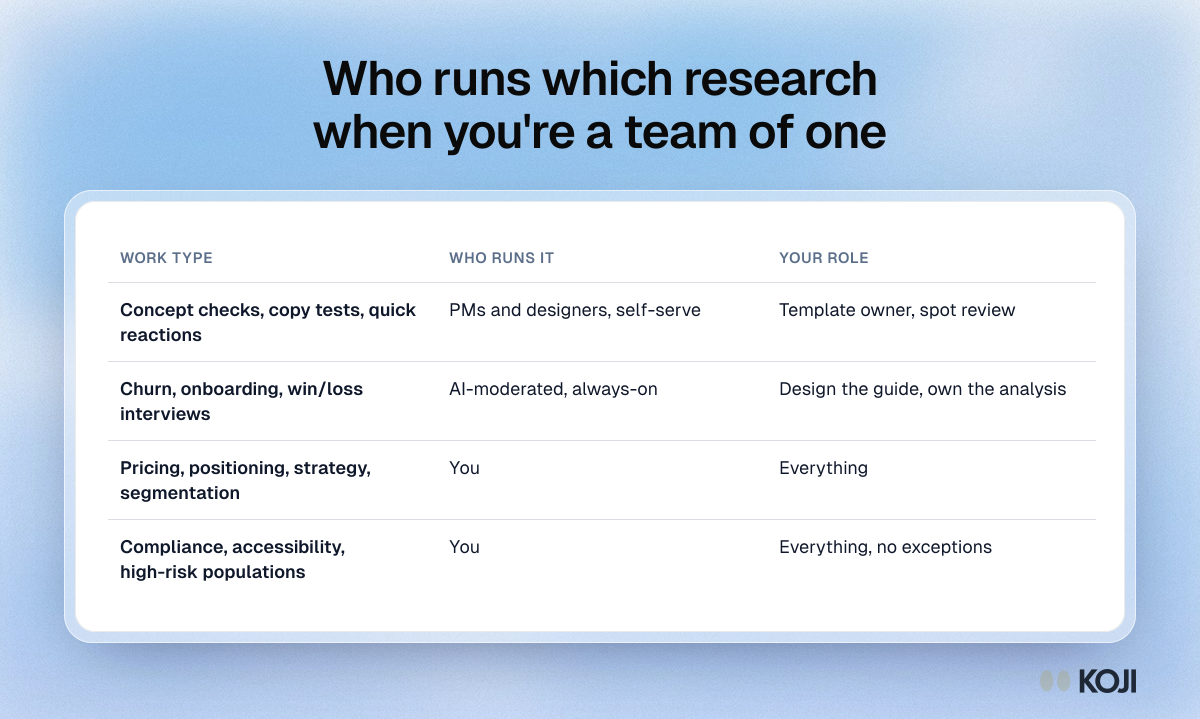
Table for a solo researcher: PMs and designers self-serve quick tests, AI runs always-on churn interviews, and you keep pricing, strategy and high-risk work.

Reference table

Who runs which research when you're a team of one
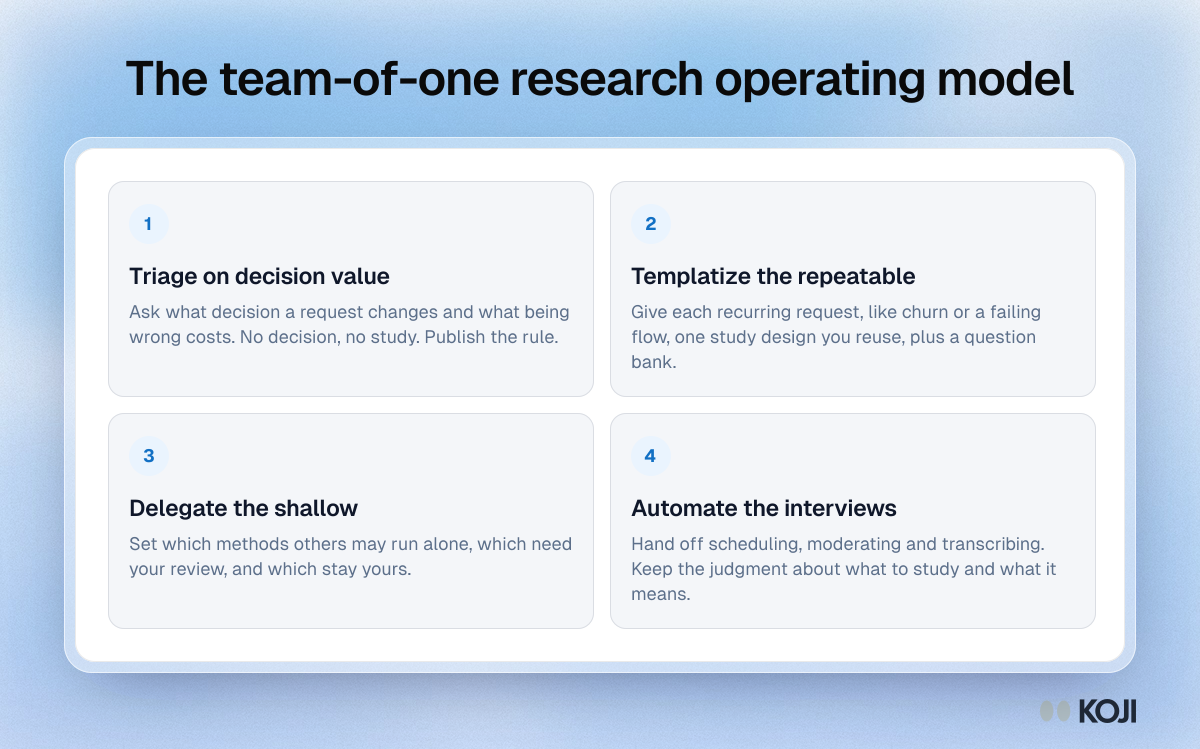
Framework for a solo researcher with four parts: triage requests on decision value, templatize repeat studies, delegate shallow work and automate interviews.

Framework

The team-of-one research operating model
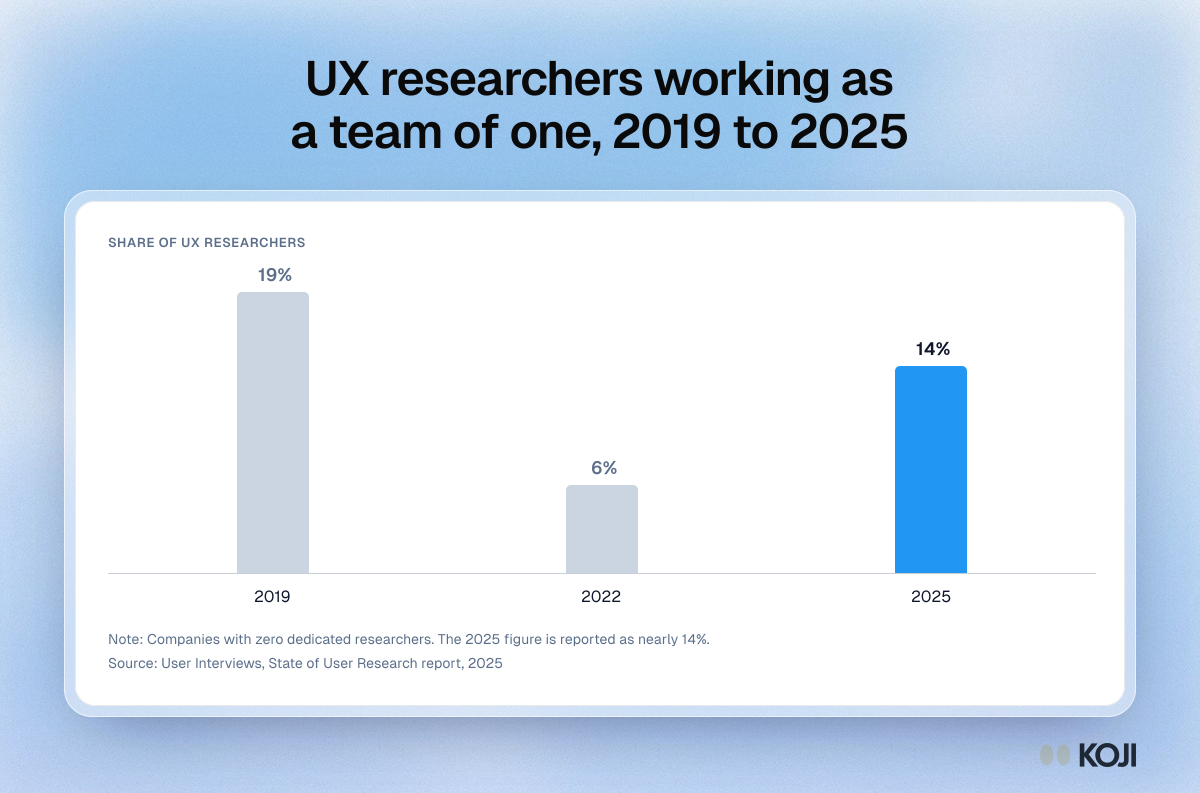
Column chart: the share of UX researchers at companies with zero dedicated researchers was 19% in 2019, 6% in 2022 and nearly 14% in 2025.

Column chart

UX researchers working as a team of one, 2019 to 2025
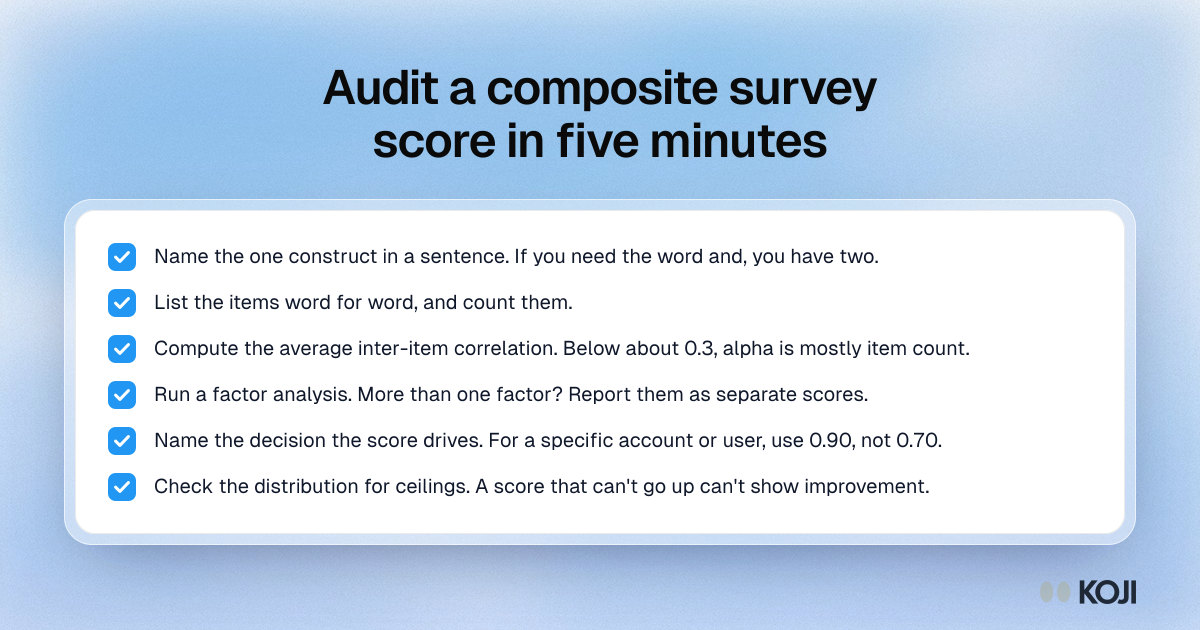
Checklist for auditing a composite score: name one construct, list the items, check correlations, run a factor analysis, set the bar, look for ceilings.

Checklist

Audit a composite survey score in five minutes
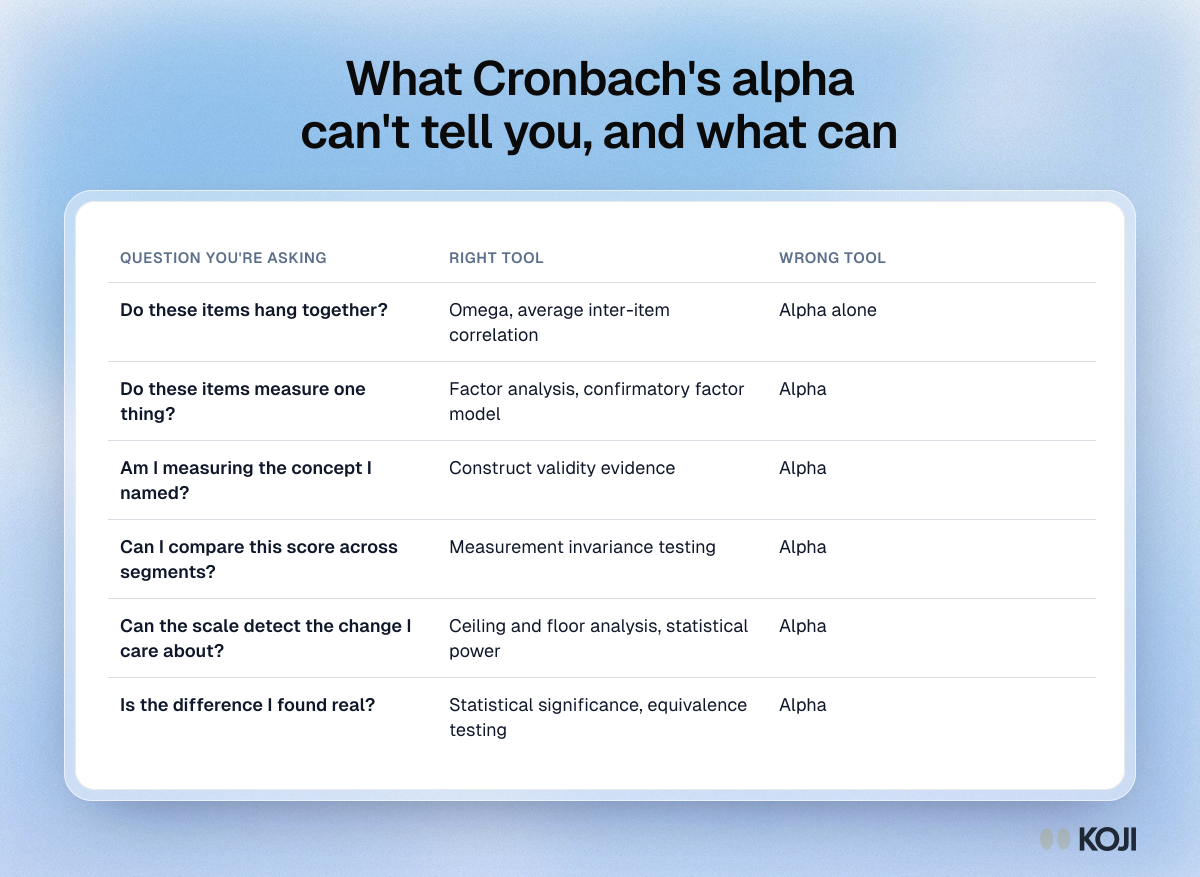
Table matching six questions about a survey scale to the right tool, such as omega, factor analysis or invariance testing, with alpha as the wrong tool.

Reference table

What Cronbach's alpha can't tell you, and what can
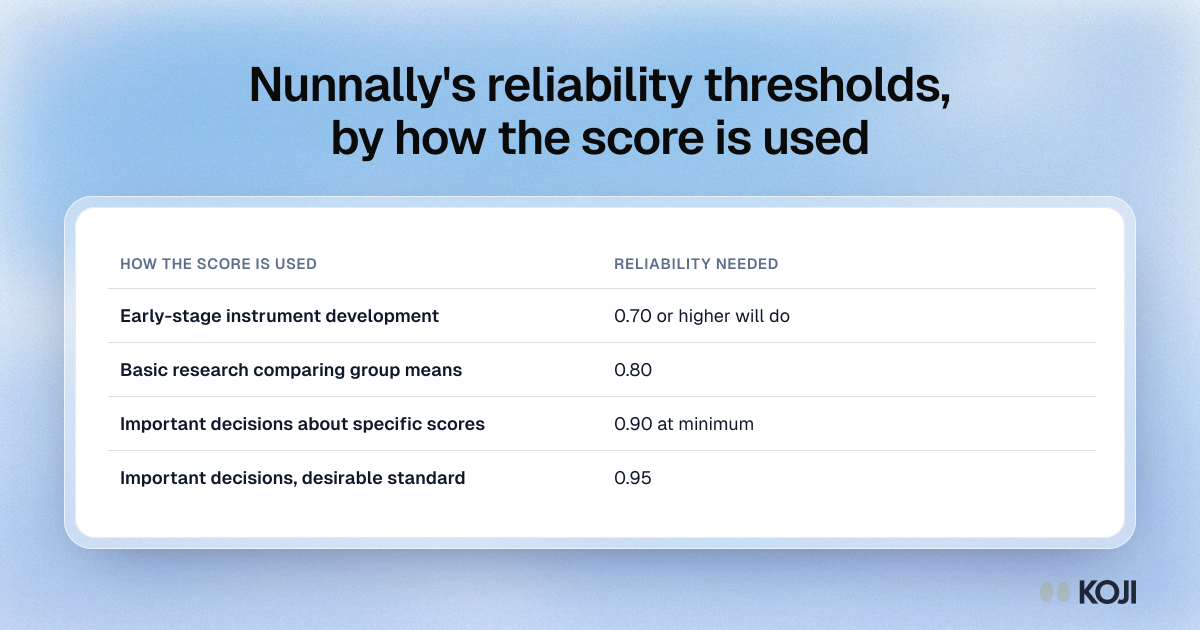
Table of Nunnally's reliability thresholds: 0.70 for early-stage work, 0.80 for basic research, 0.90 minimum and 0.95 desirable when decisions rest on scores.

Reference table

Nunnally's reliability thresholds, by how the score is used
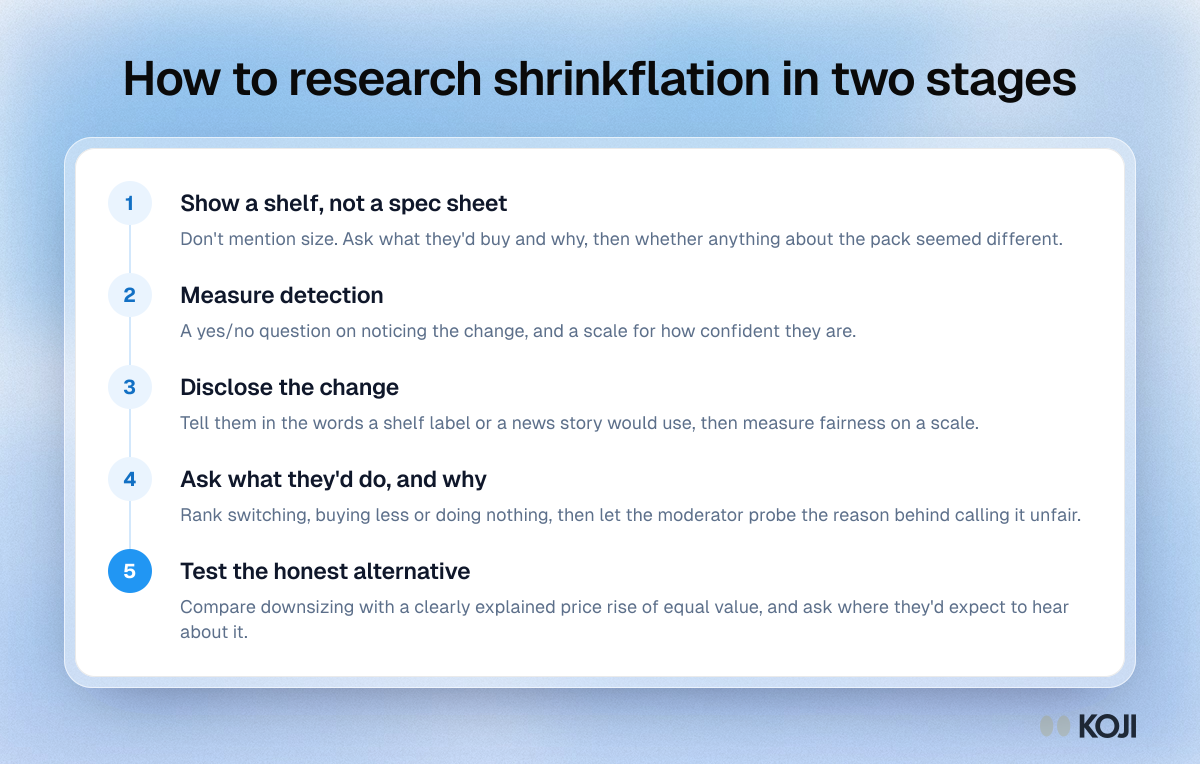
Process for shrinkflation research: show a shelf without naming size, measure detection, disclose the change, ask what shoppers would do, test a price rise.

Process

How to research shrinkflation in two stages
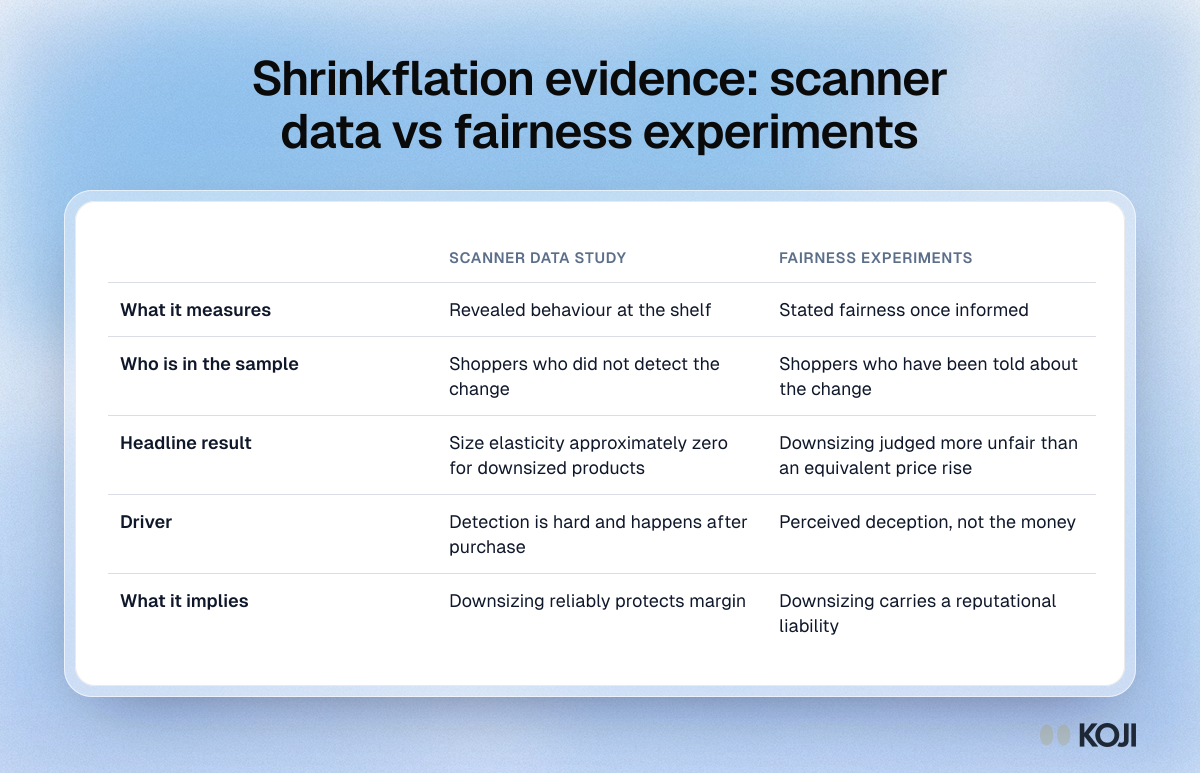
Table comparing shrinkflation evidence: scanner data shows shoppers who didn't notice barely react, while experiments show informed shoppers call it unfair.

Reference table

Shrinkflation evidence: scanner data vs fairness experiments
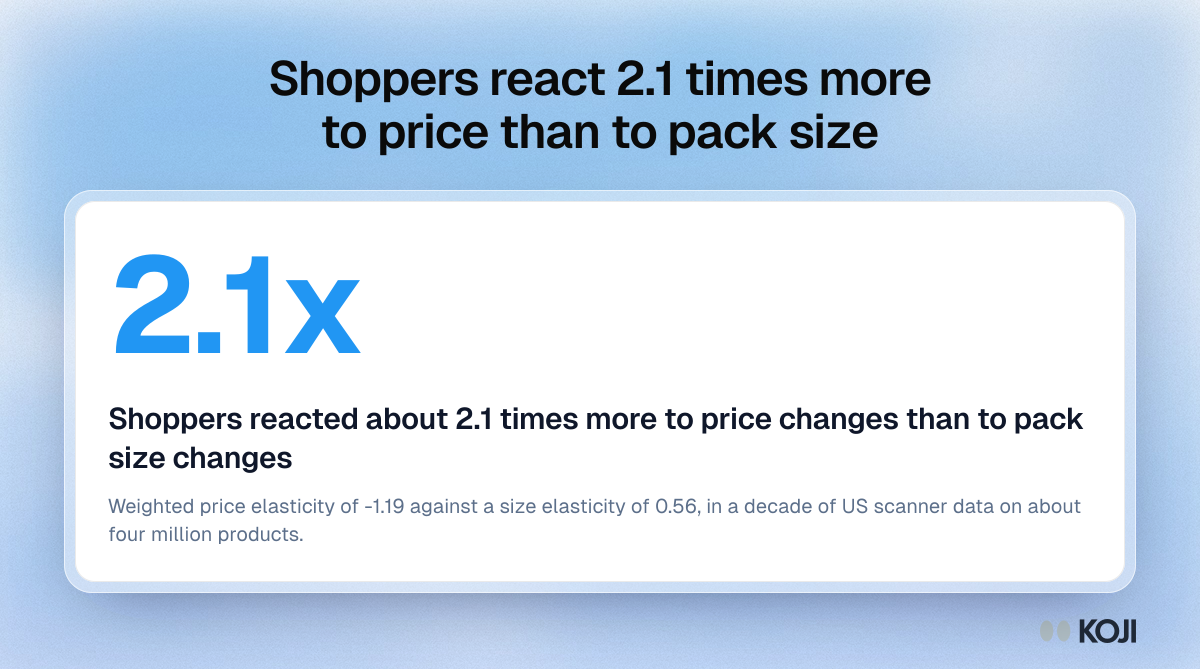
Stat card: shoppers were about 2.1 times more responsive to price changes than to size changes, a price elasticity of -1.19 against a size elasticity of 0.56.

Key figure

Shoppers react 2.1 times more to price than to pack size
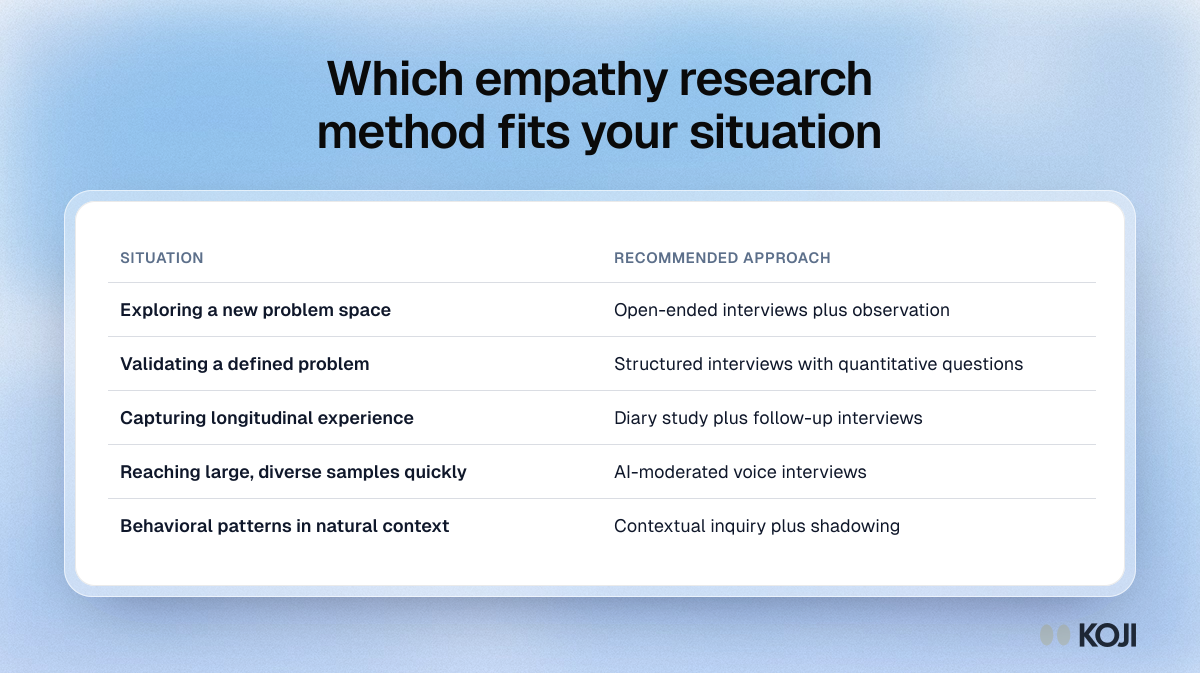
Table matching five empathy research situations to methods, from open-ended interviews and observation to diary studies, AI voice interviews and shadowing.

Reference table

Which empathy research method fits your situation
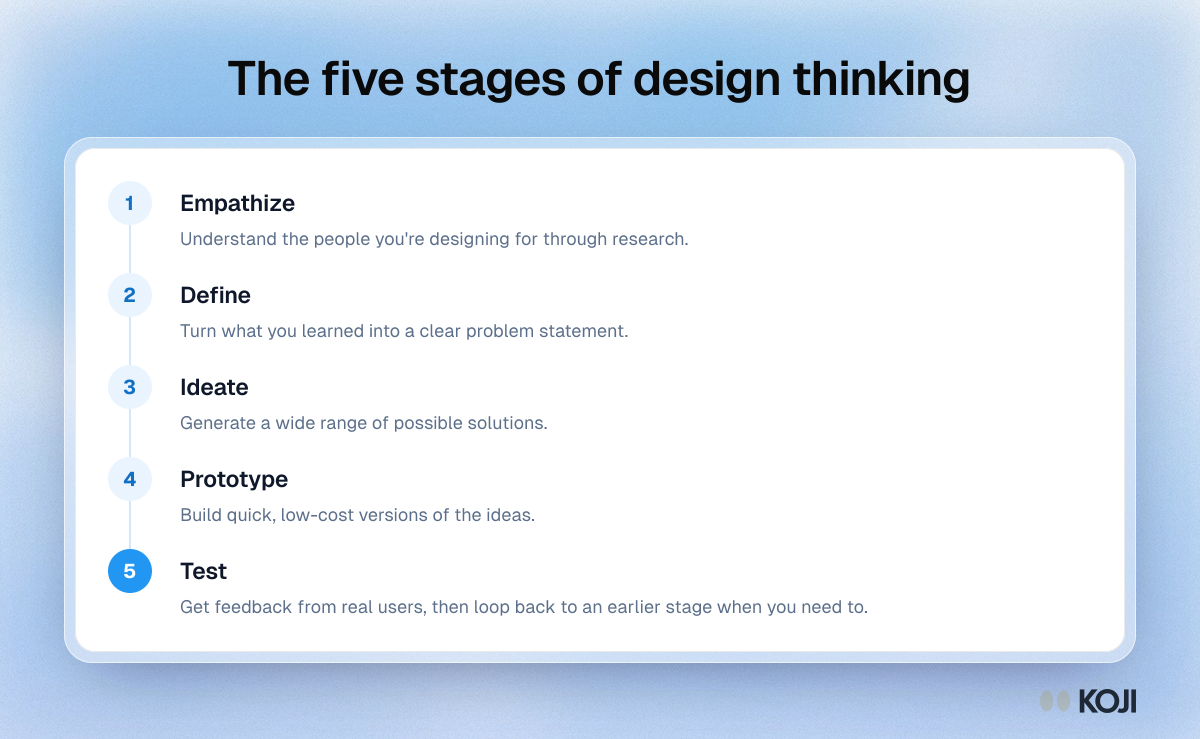
Process diagram of the five stages of design thinking: empathize, define, ideate, prototype and test, with teams looping back as they learn.

Process

The five stages of design thinking
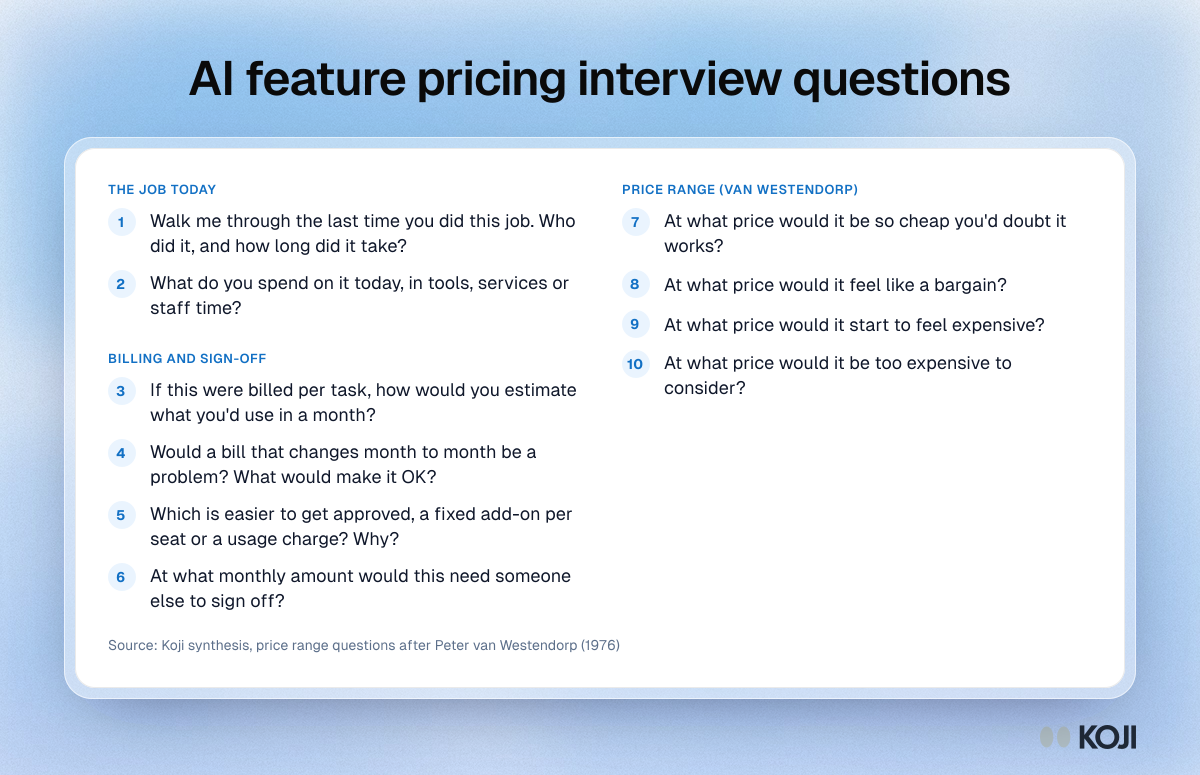
Question bank for AI feature pricing interviews: current spend, billing units, bill variability, sign-off amounts and the four Van Westendorp price questions.

Question bank

AI feature pricing interview questions
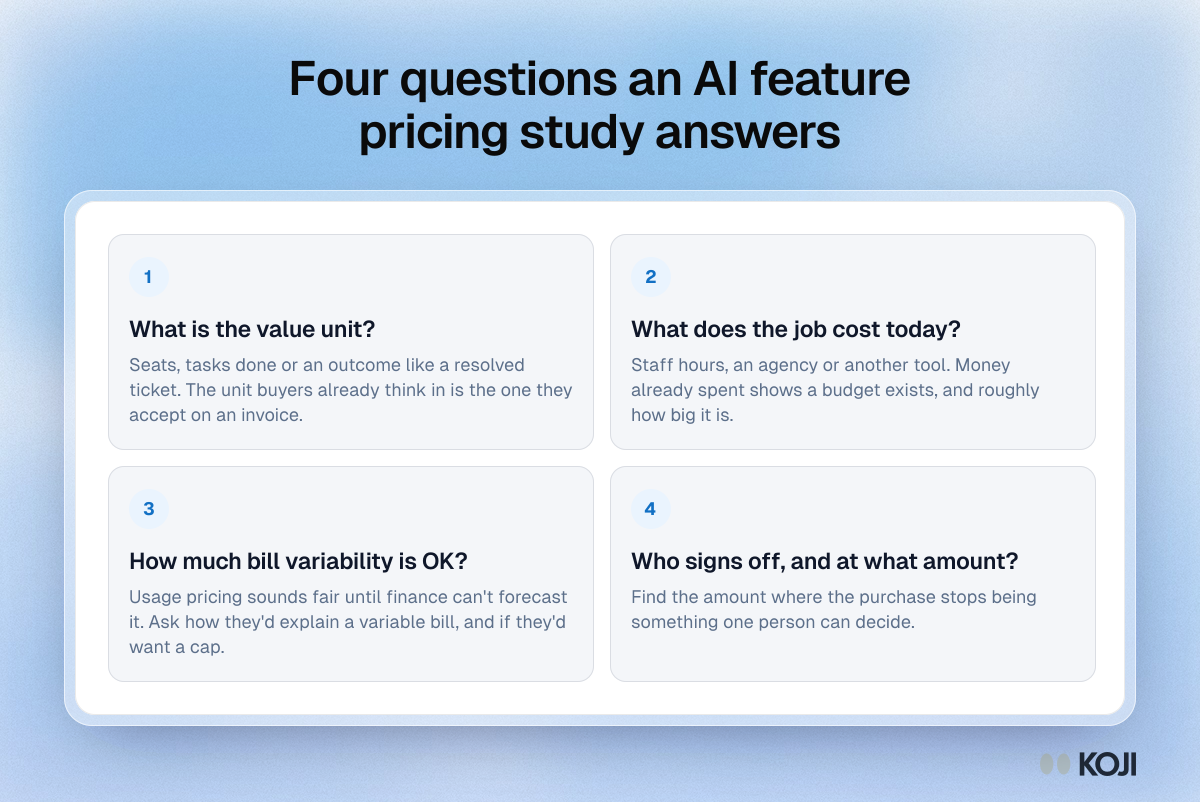
Framework of four questions for pricing an AI feature: the value unit, what the job costs today, tolerance for variable bills and who signs off.

Framework

Four questions an AI feature pricing study answers
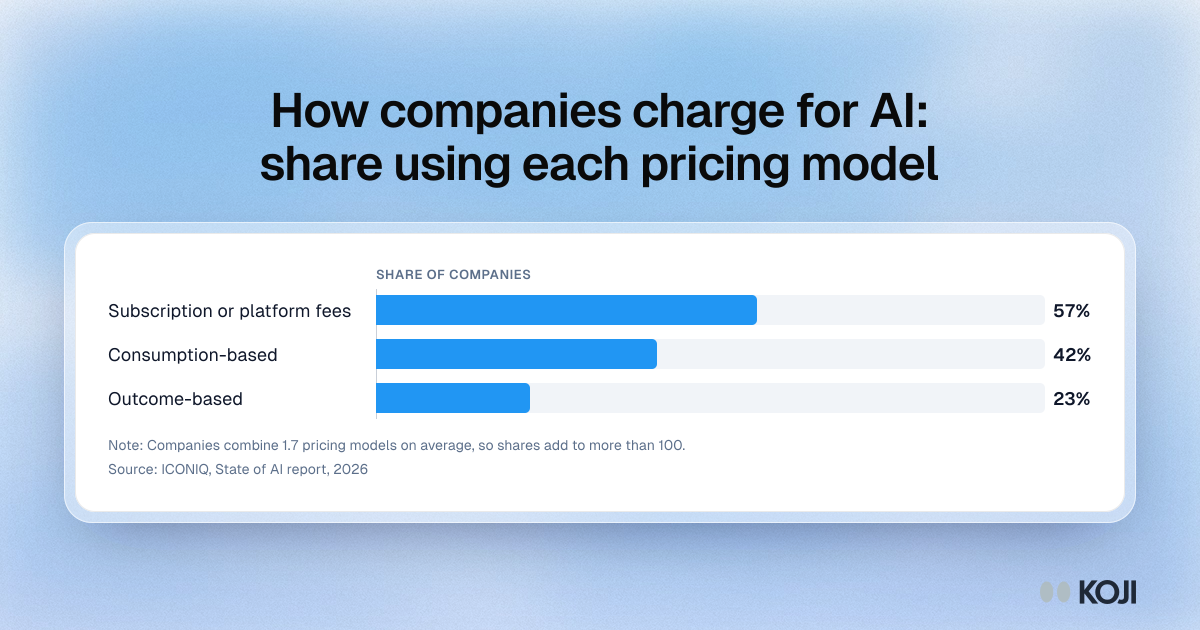
Bar chart of AI pricing models in 2026: 57% of companies use subscription or platform fees, 42% consumption-based and 23% outcome-based pricing.

Bar chart

How companies charge for AI: share using each pricing model
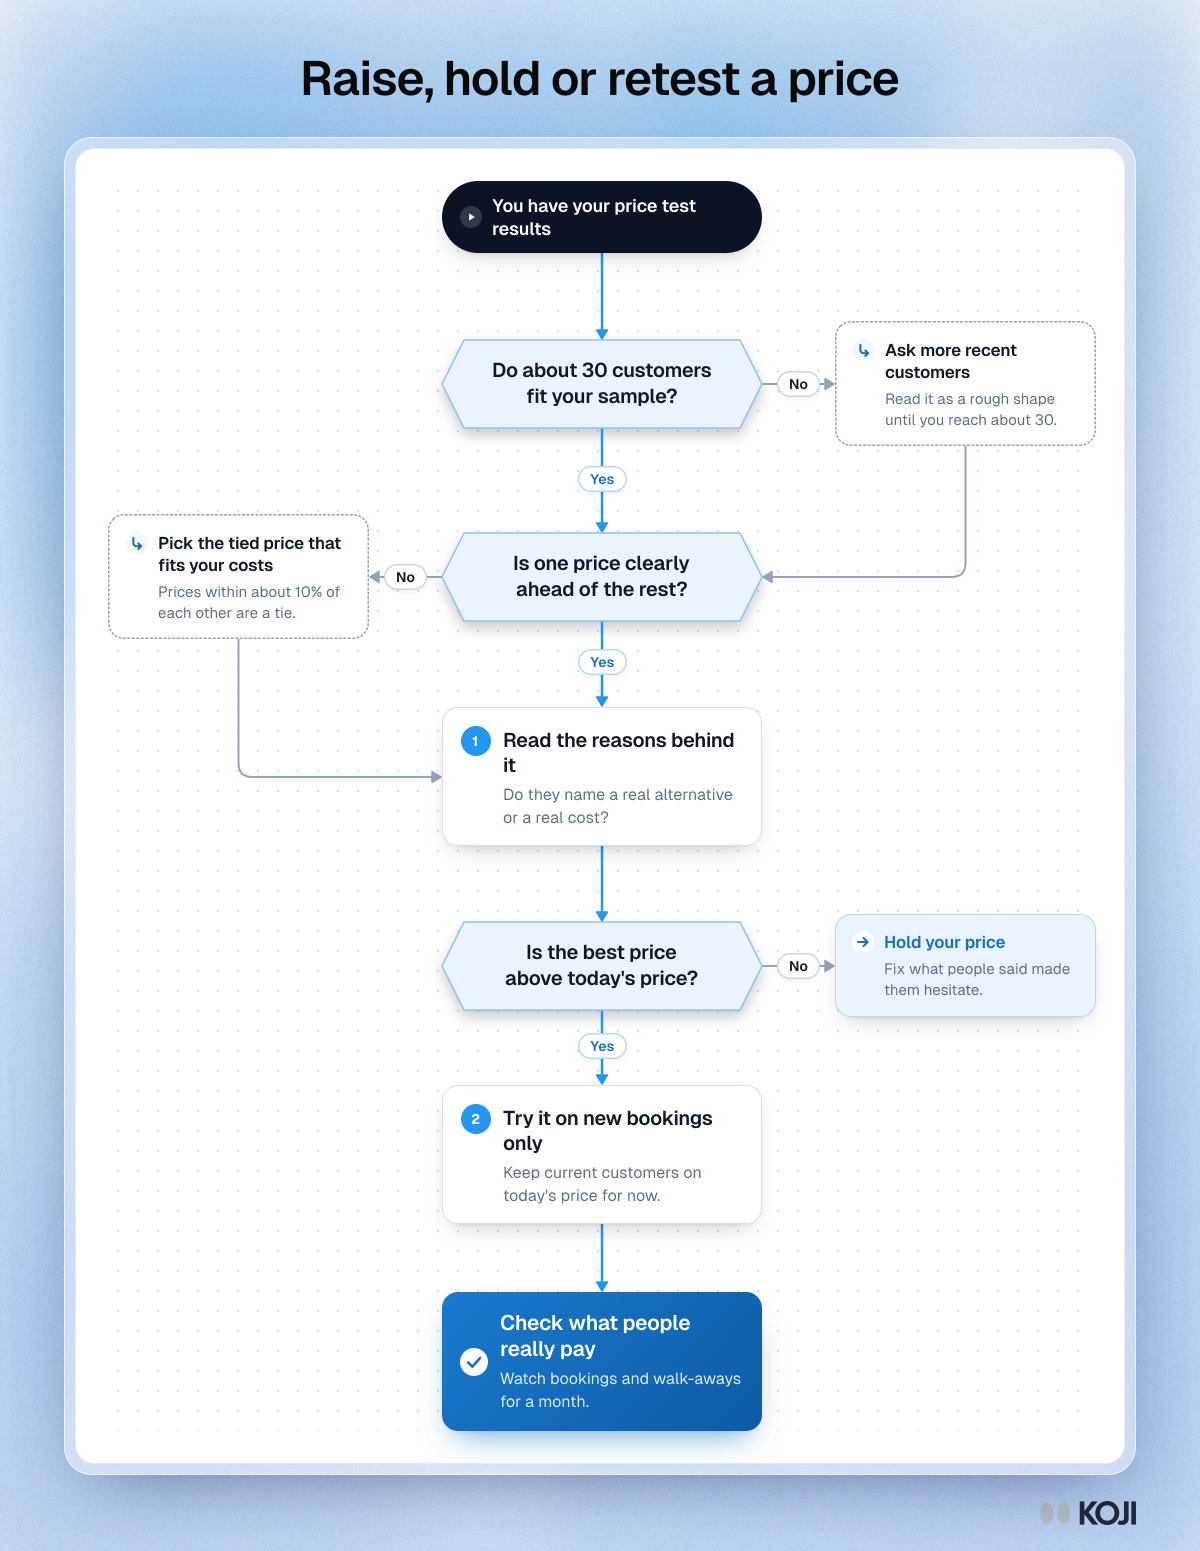
Flowchart for reading a price test: three questions, two side steps and one exit, ending in checking what people really pay.

Flowchart

Raise, hold or retest a price
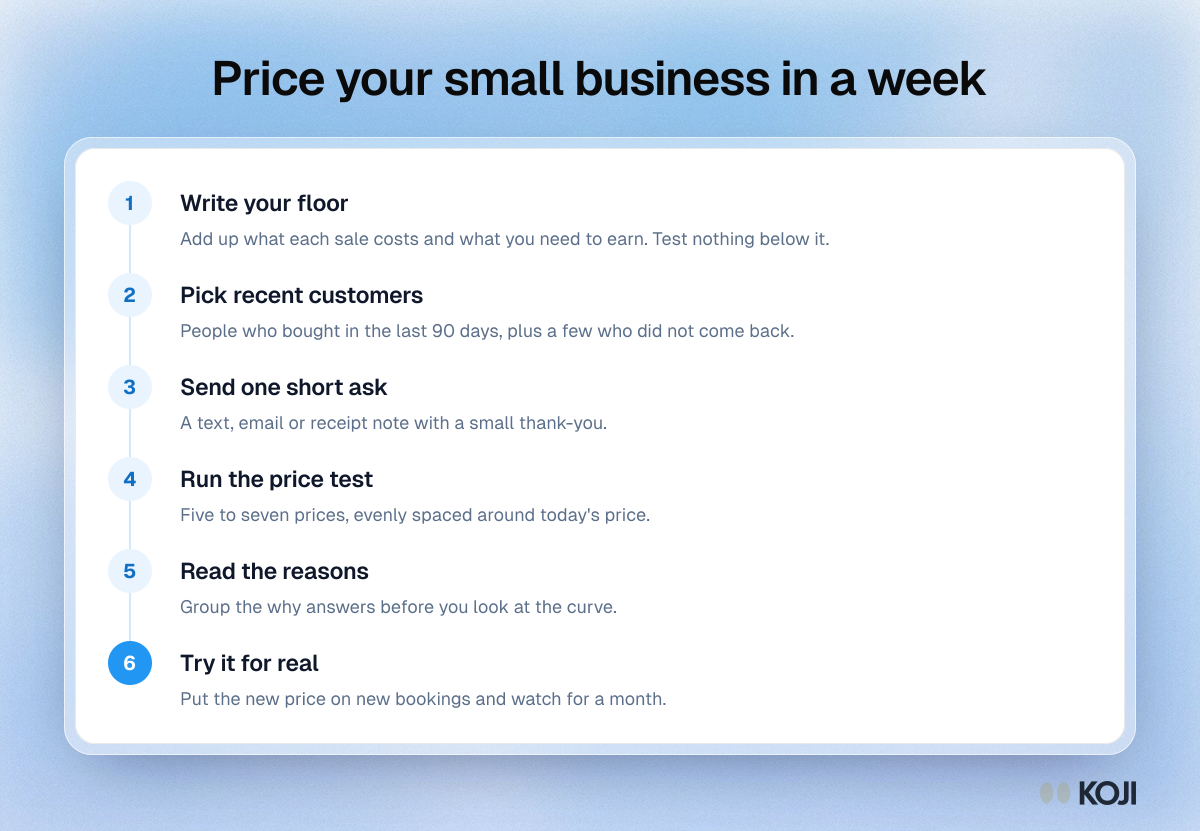
Process for pricing a small business in a week: set a floor, pick recent customers, ask, run a price test, read the reasons, try it.

Process

Price your small business in a week
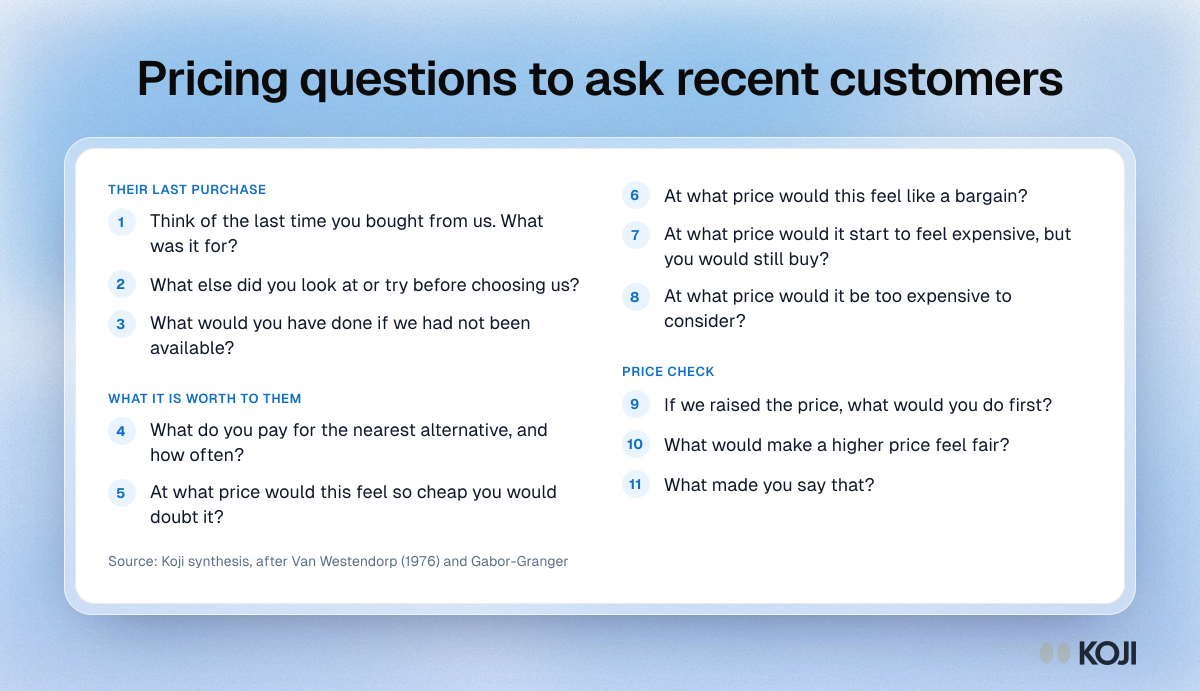
Question bank of eleven pricing questions for recent customers, in three groups: their last purchase, what it is worth to them and a price check.

Question bank

Pricing questions to ask recent customers
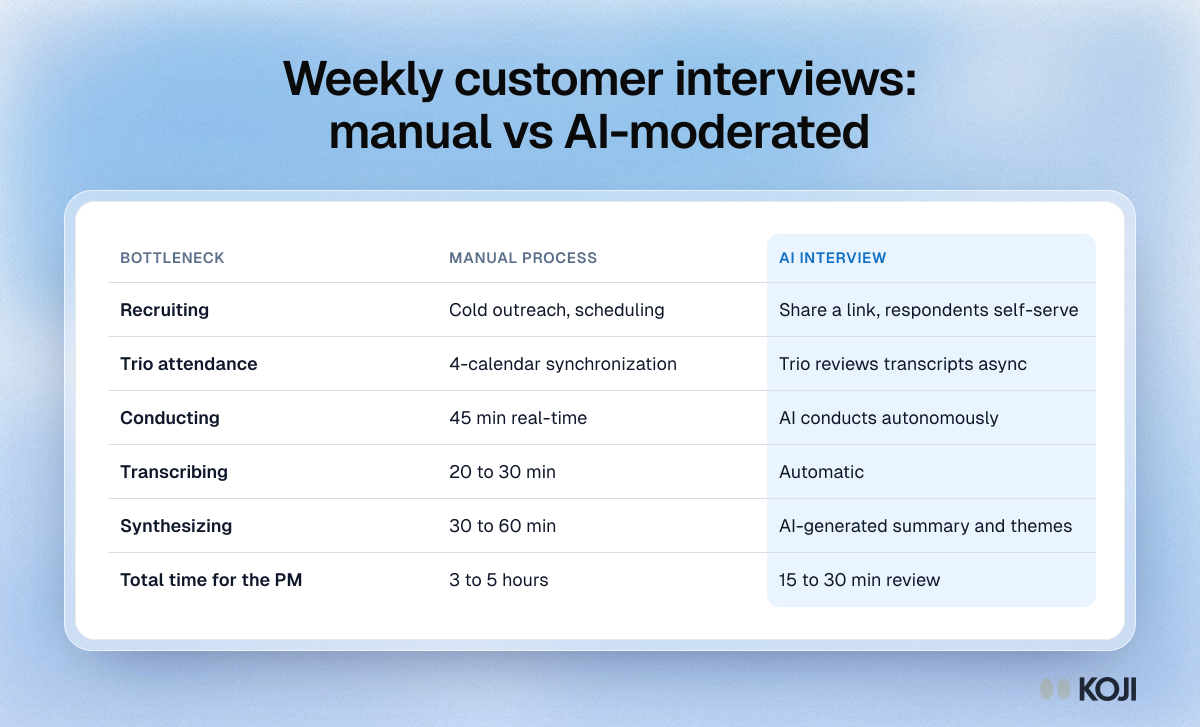
Table comparing manual and AI-moderated weekly interviews from recruiting to synthesis: 3 to 5 hours of PM time against 15 to 30 minutes of review

Reference table

Weekly customer interviews: manual vs AI-moderated
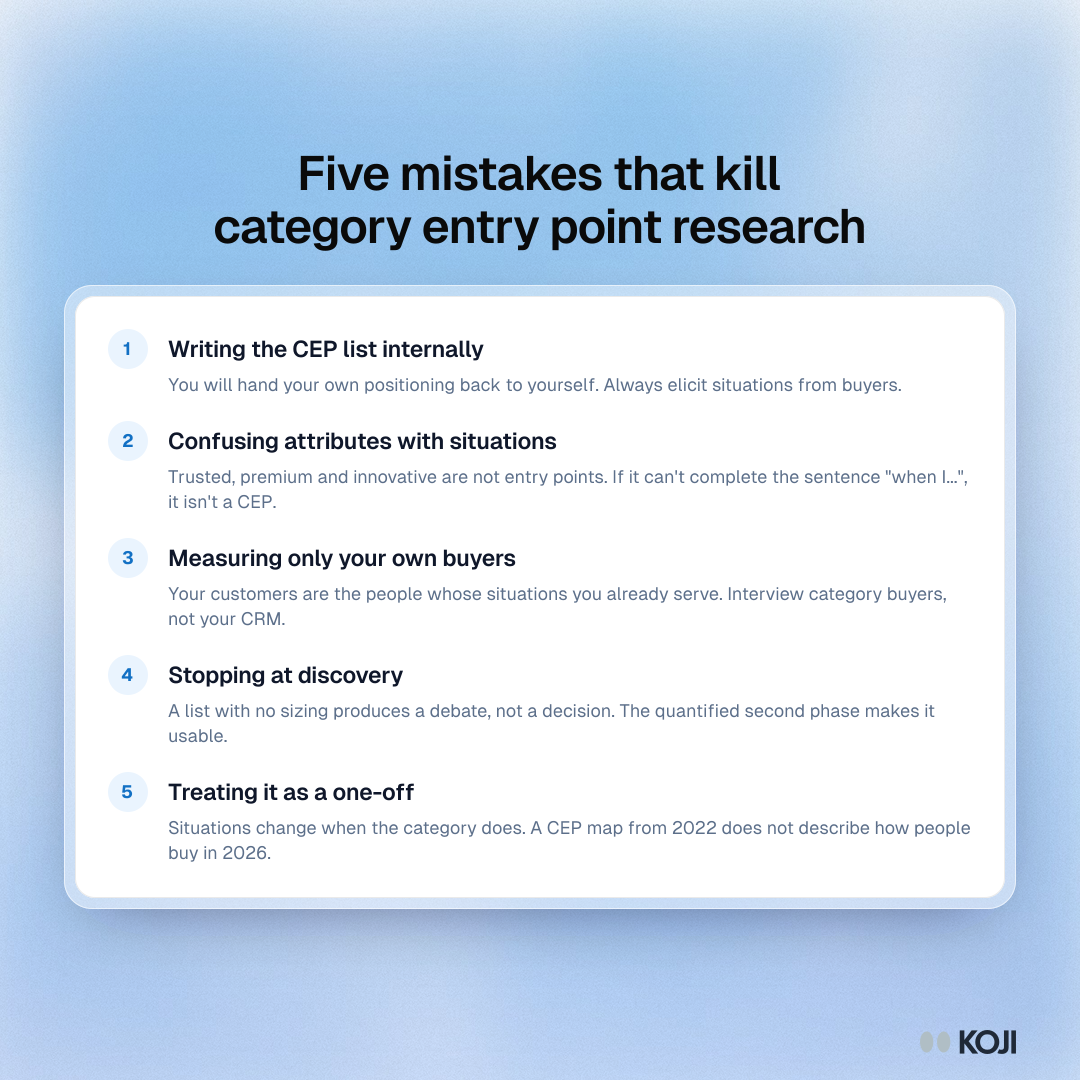
List of five category entry point research mistakes: an internal CEP list, attributes for situations, only own buyers, stopping at discovery, a one-off map

Guide

Five mistakes that kill category entry point research
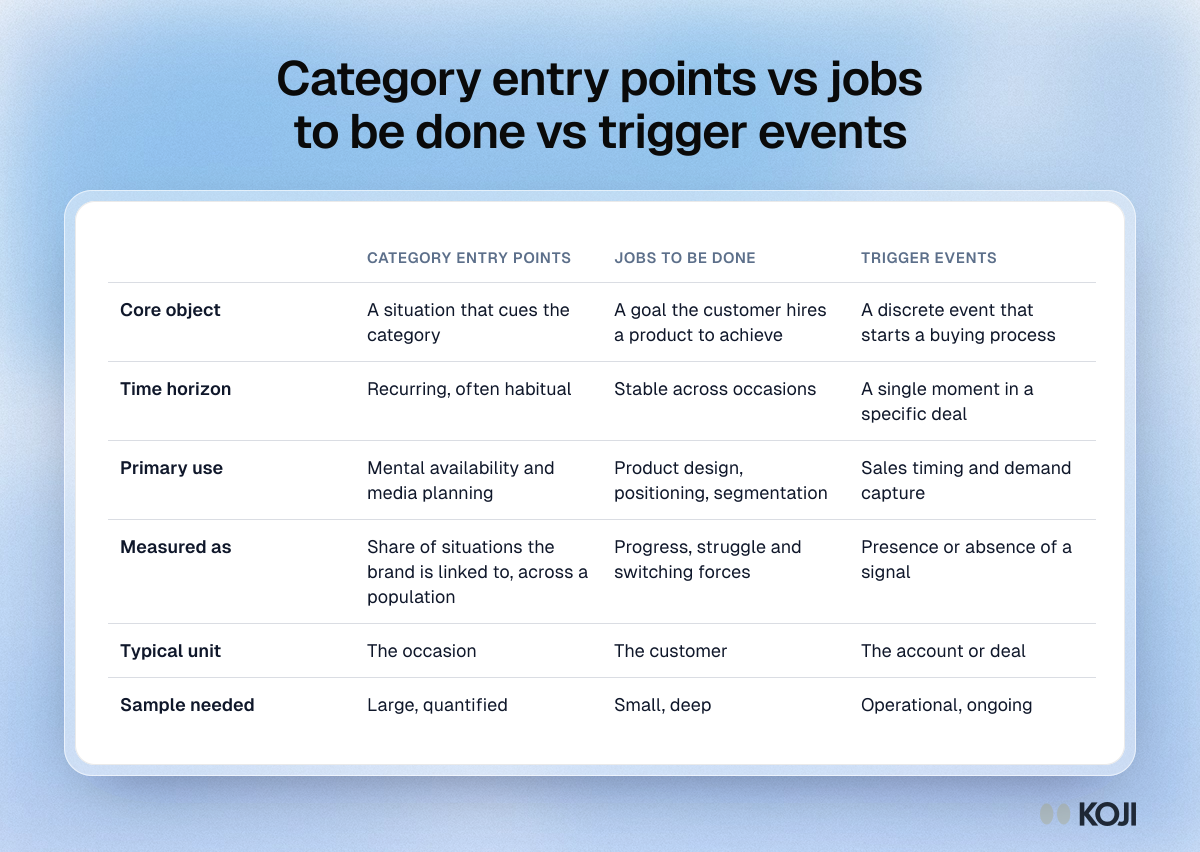
Table comparing category entry points, jobs to be done and trigger events by core object, time horizon, use, measure, unit and sample needed

Reference table

Category entry points vs jobs to be done vs trigger events
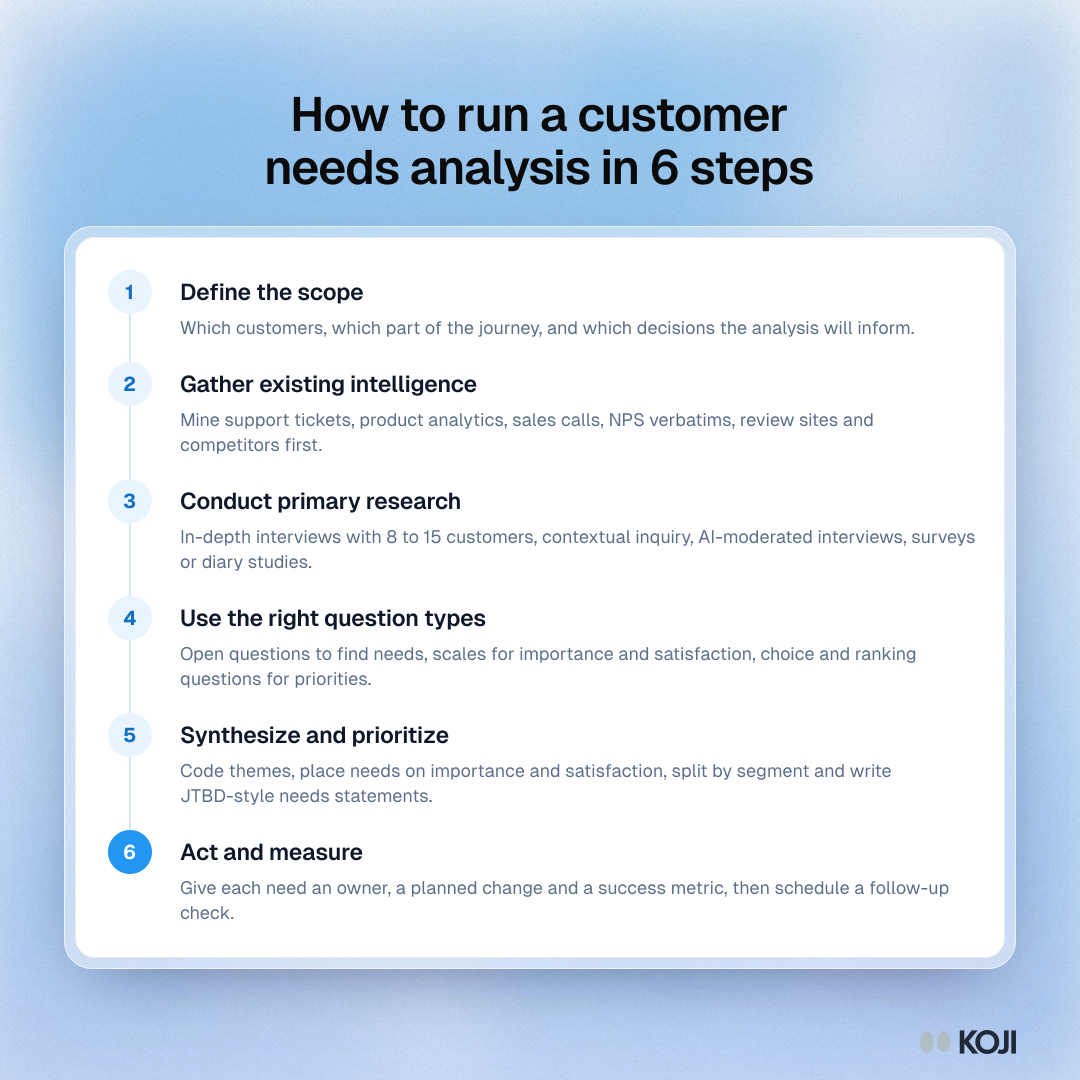
Process showing six steps of customer needs analysis: define scope, gather existing data, run research, pick question types, synthesize, act and measure

Process

How to run a customer needs analysis in 6 steps
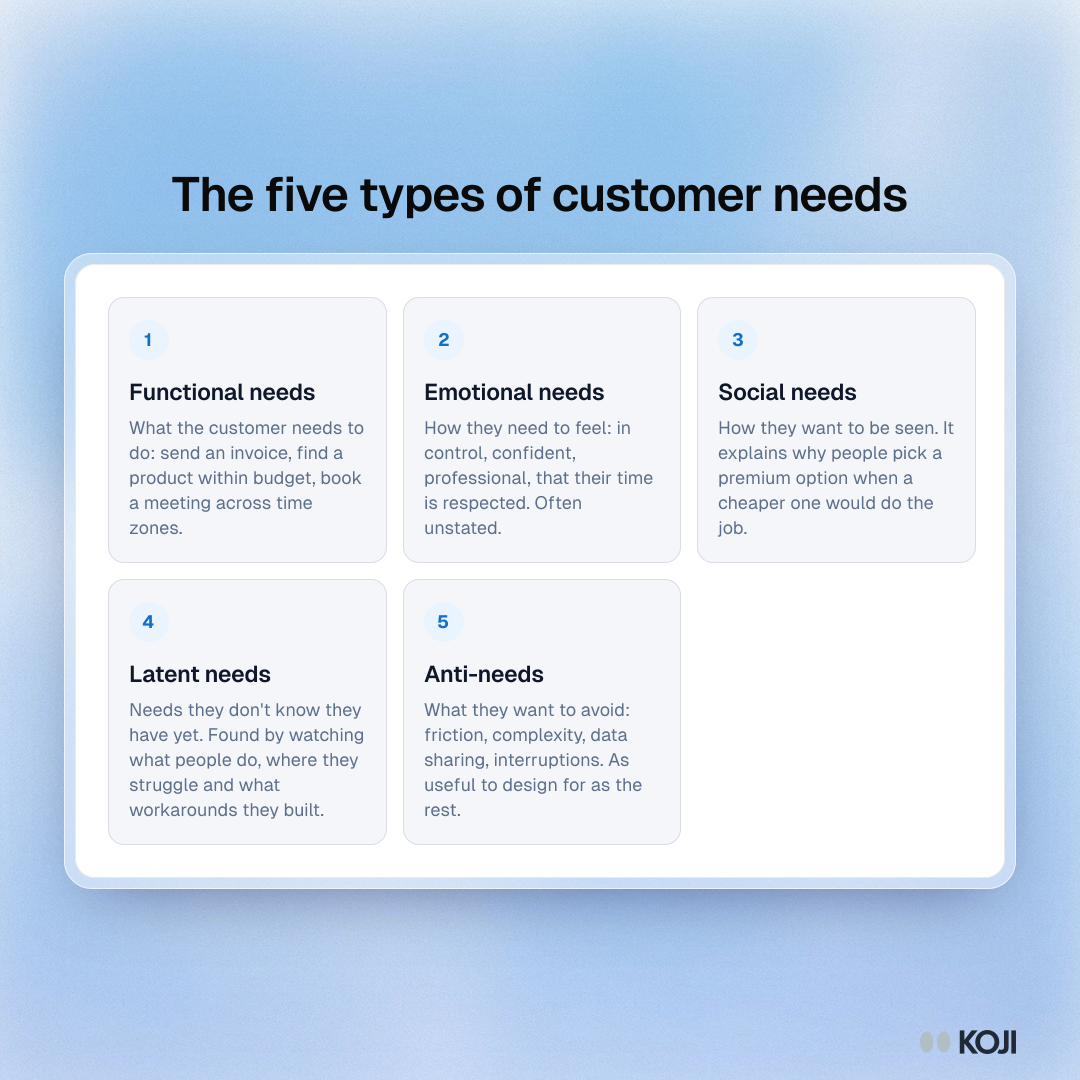
Framework of five types of customer needs: functional, emotional, social, latent and anti-needs, each with a short example of what it covers

Framework

The five types of customer needs
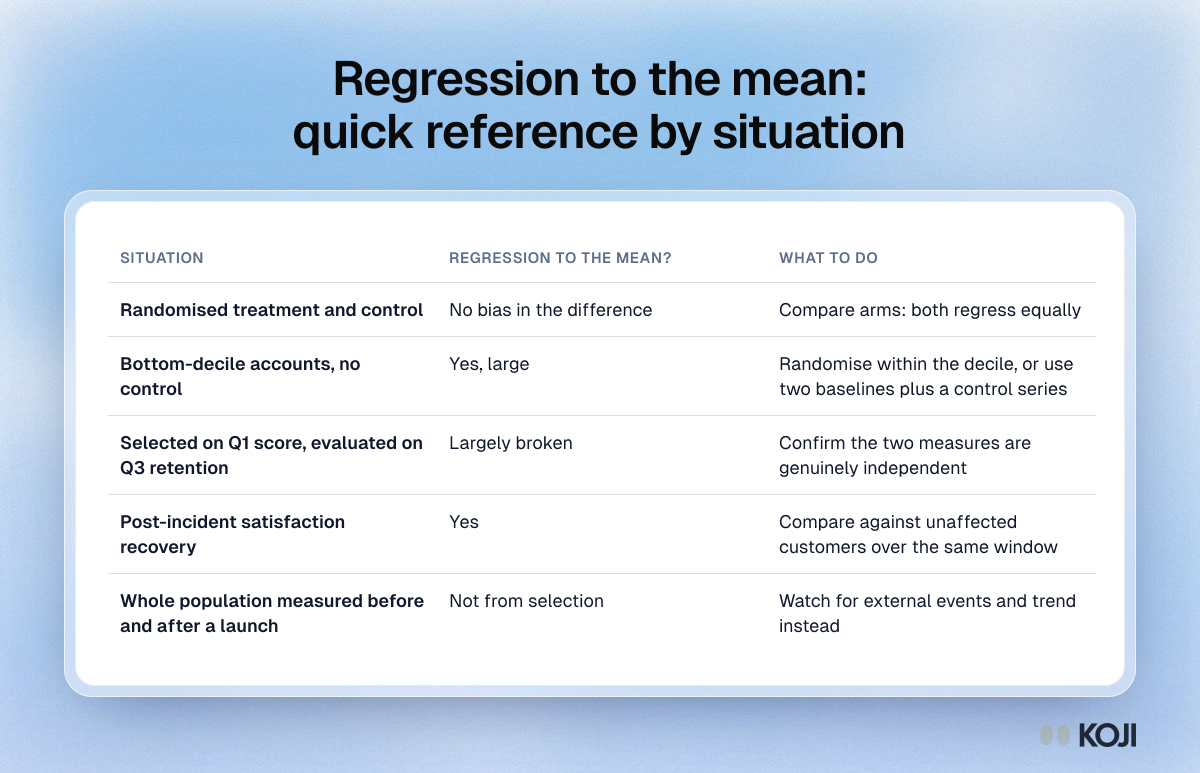
Table of five research situations, whether regression to the mean is present in each, and what to do, from randomised tests to bottom-decile rescues

Reference table

Regression to the mean: quick reference by situation
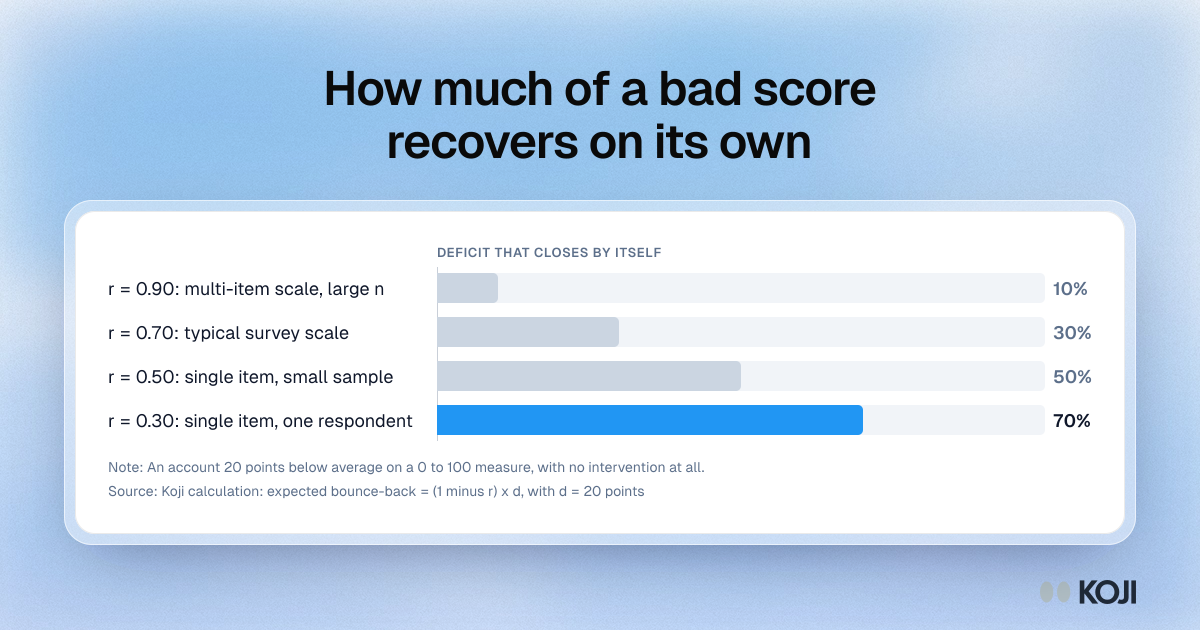
Bar chart of how much of a 20-point deficit closes with no intervention: 10% at reliability 0.90, 30% at 0.70, 50% at 0.50 and 70% at 0.30

Bar chart

How much of a bad score recovers on its own
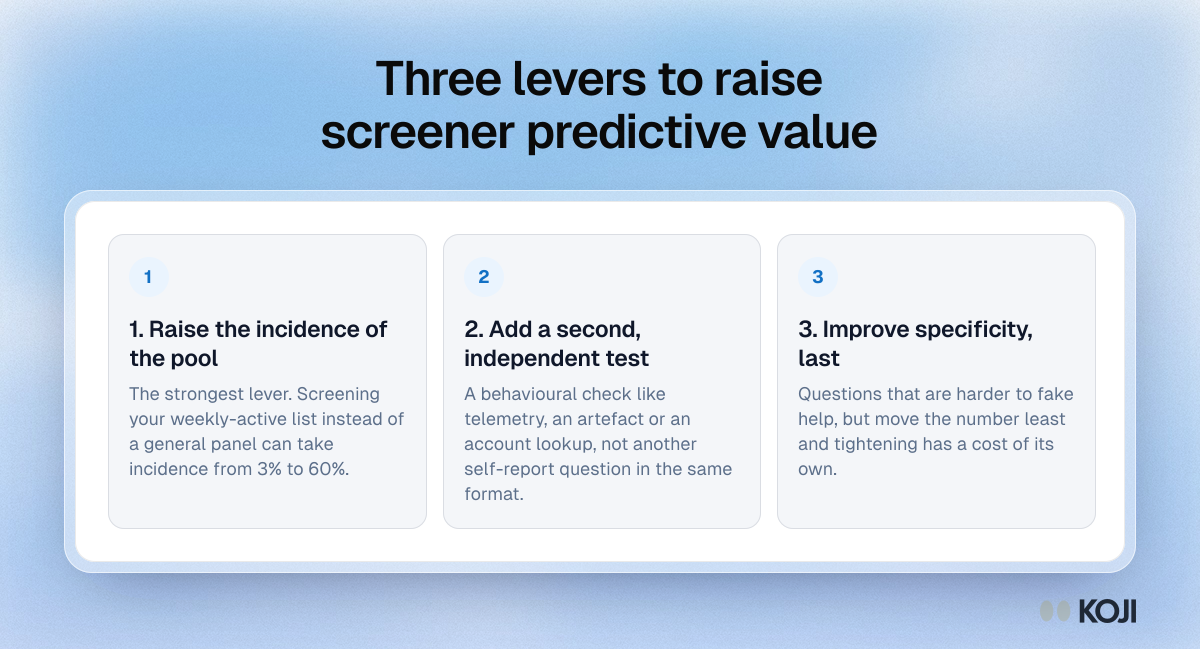
Framework of three levers to raise a screener's predictive value, strongest first: raise pool incidence, add an independent test, then improve specificity

Framework

Three levers to raise screener predictive value
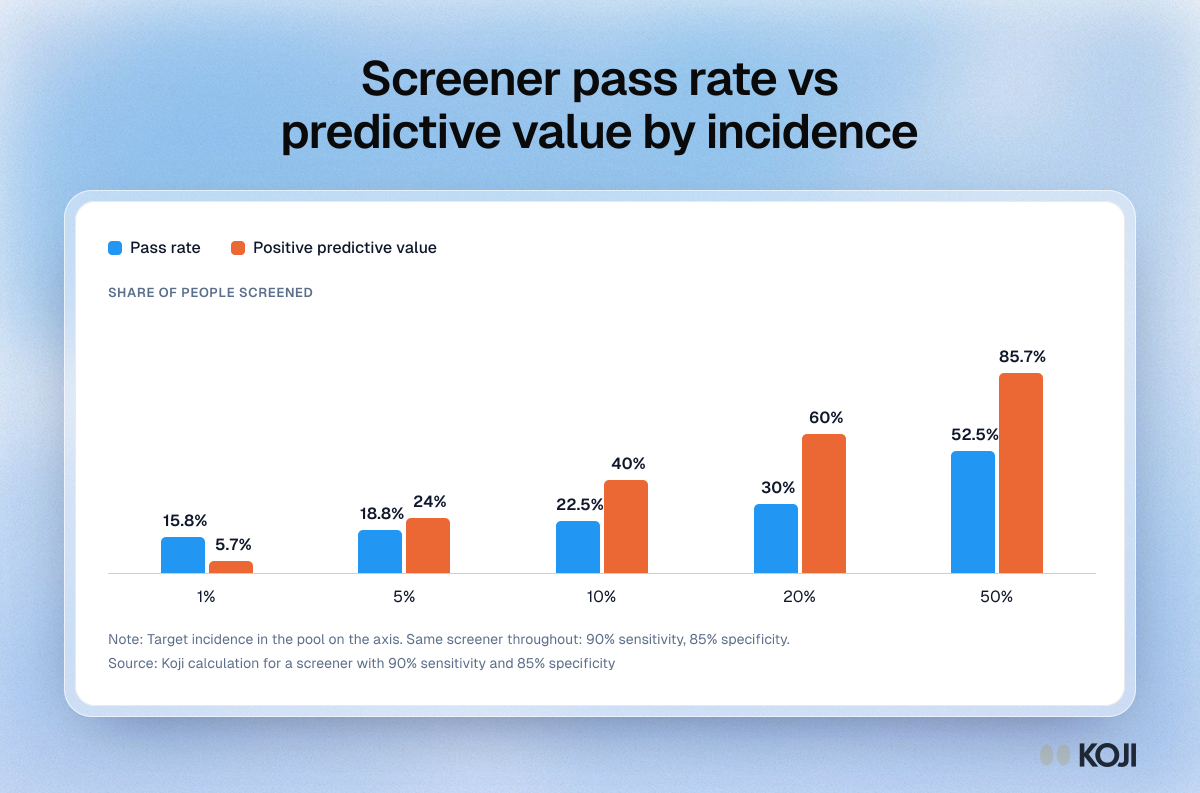
Column chart of a screener at 90% sensitivity and 85% specificity: as target incidence rises from 1% to 50%, predictive value climbs from 5.7% to 85.7%

Column chart

Screener pass rate vs predictive value by incidence
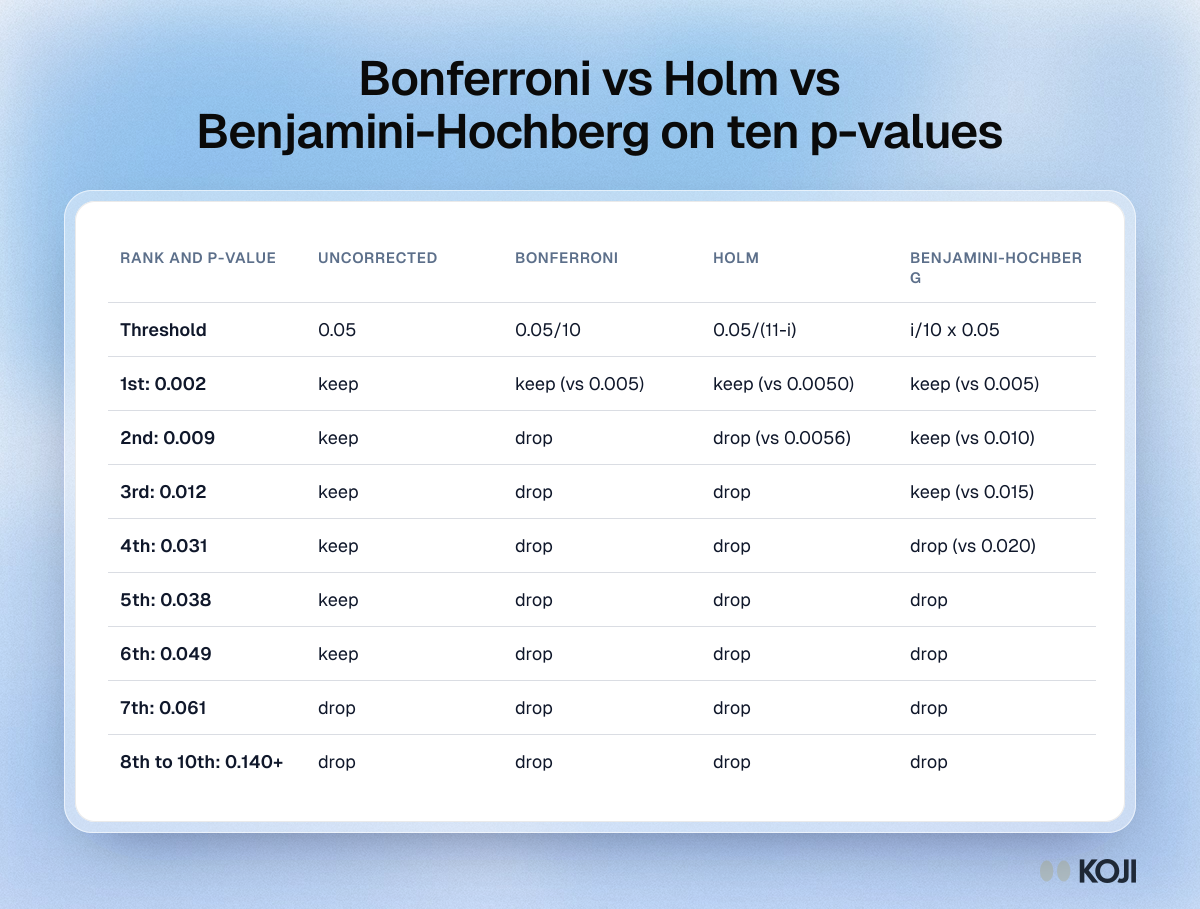
Table applying no correction, Bonferroni, Holm and Benjamini-Hochberg to ten sorted p-values: six kept uncorrected, one by Bonferroni and Holm, three by BH

Reference table

Bonferroni vs Holm vs Benjamini-Hochberg on ten p-values
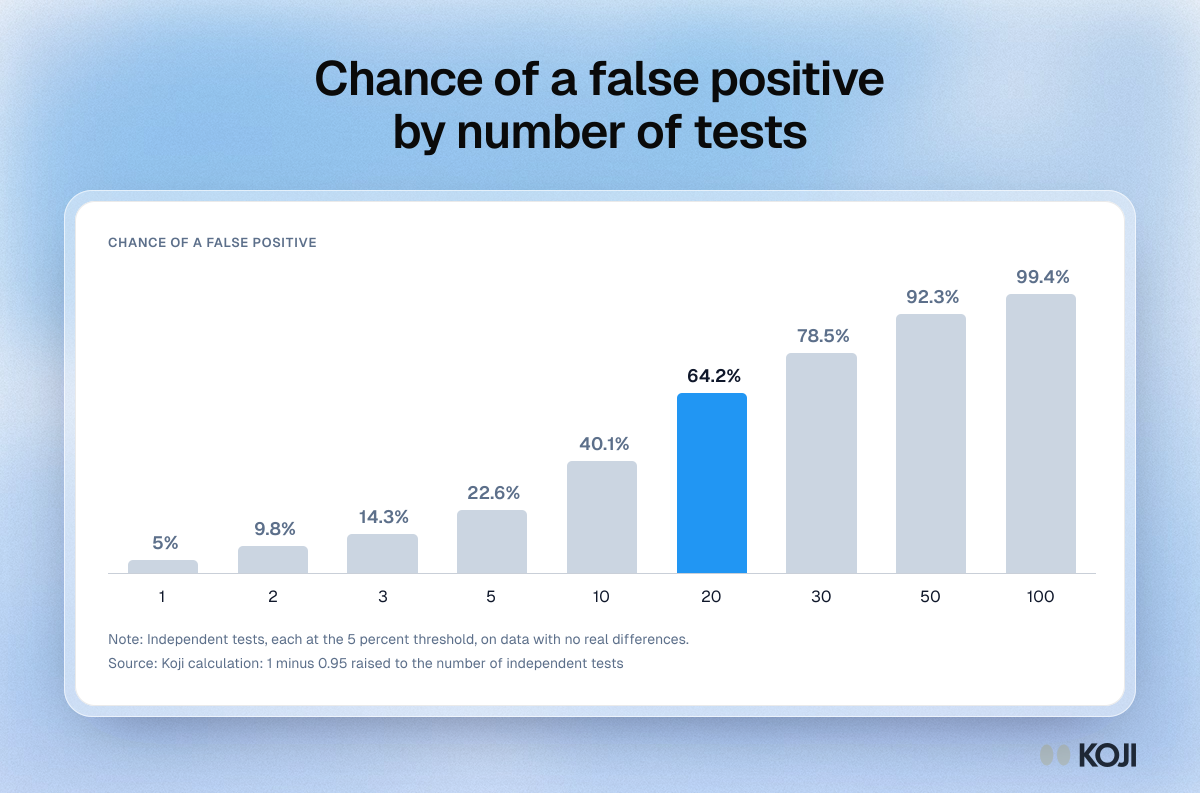
Column chart of the chance of at least one false positive at the 5 percent threshold: 5% for one test, 64.2% for 20 tests and 99.4% for 100 tests

Column chart

Chance of a false positive by number of tests
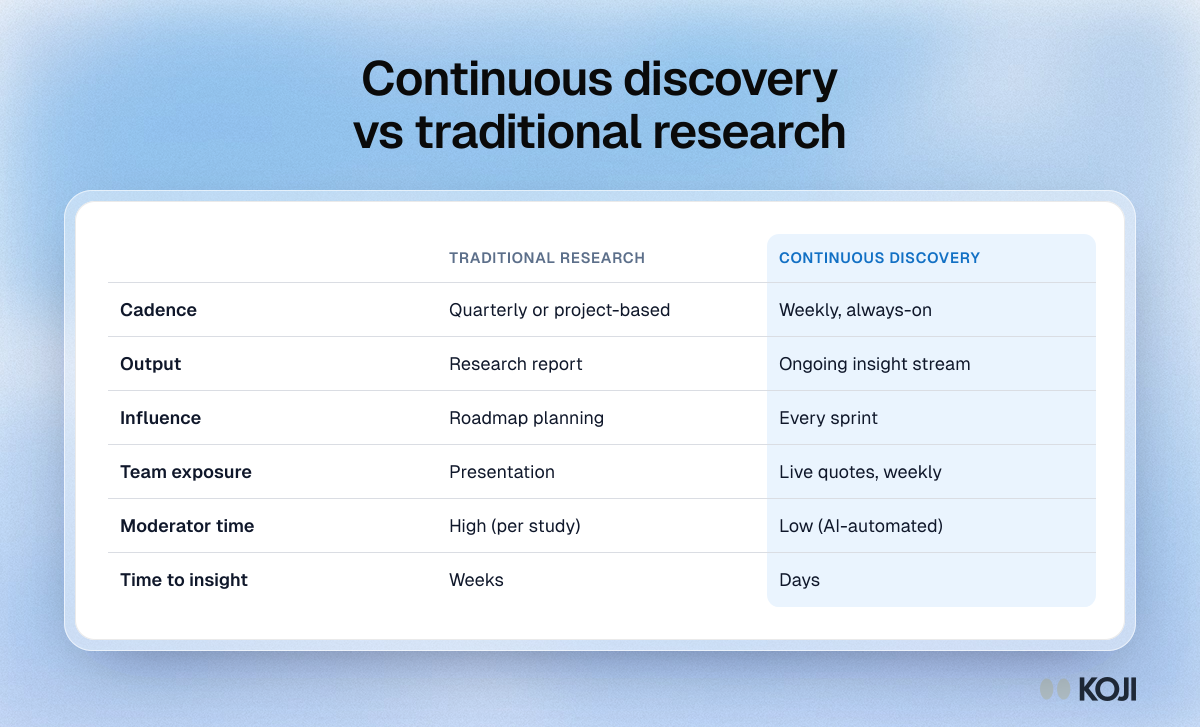
Table comparing traditional research and continuous discovery on cadence, output, influence, team exposure, moderator time and time to insight

Reference table

Continuous discovery vs traditional research