Free to save and share

Frameworks and cheat sheets for customer research

Every framework, checklist and comparison from our guides, as an image you can download, drop into a deck or share with your team.
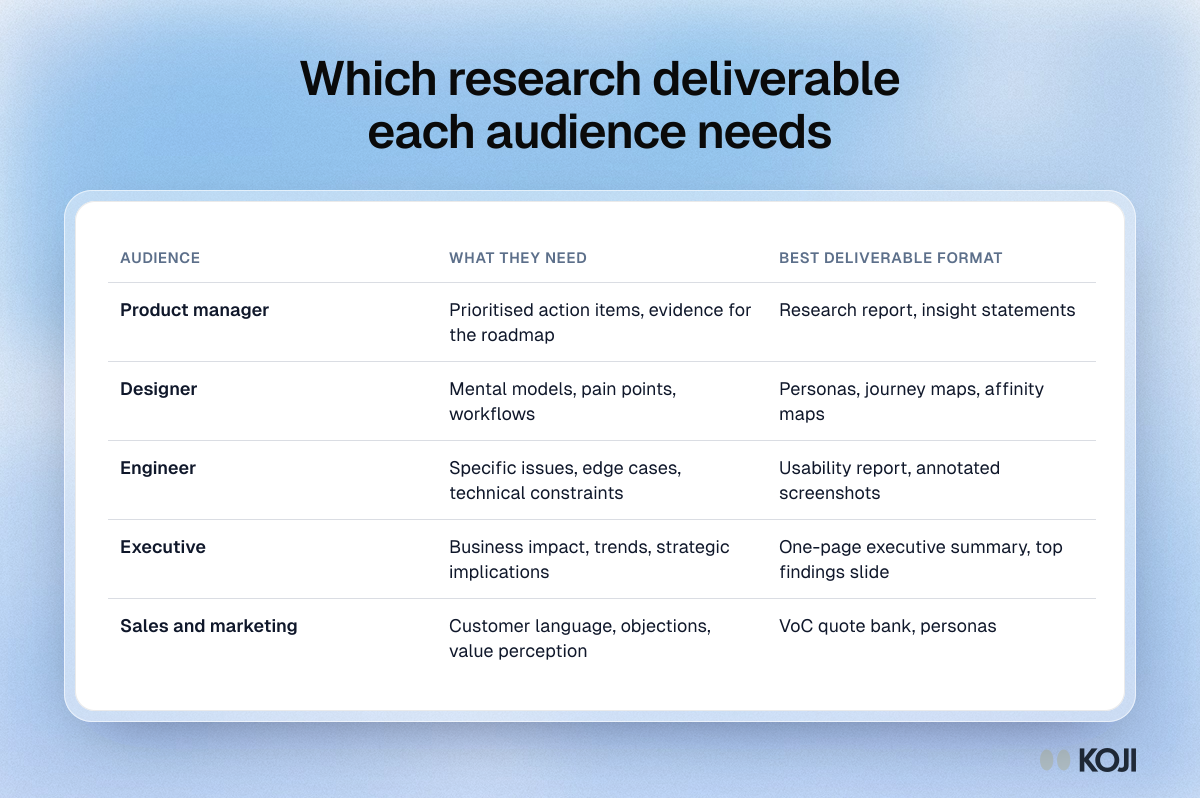
Table matching five audiences, from product managers to executives and sales, with what they need and the best research deliverable.

Reference table

Which research deliverable each audience needs
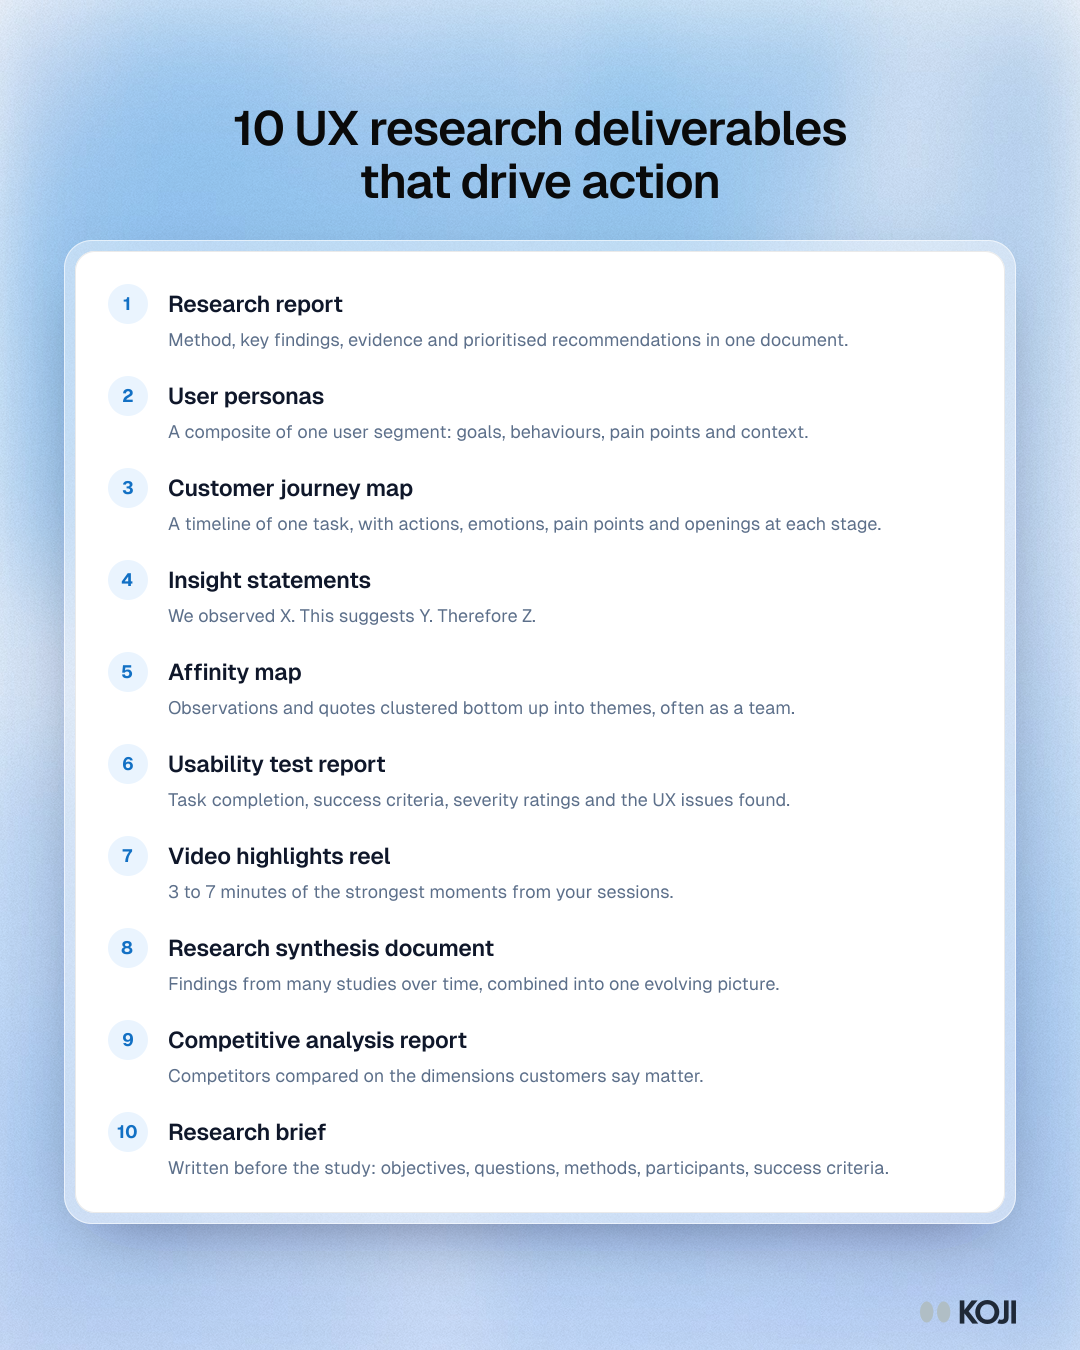
List of 10 UX research deliverables, from the research report, personas and journey map to the highlights reel and research brief.

Guide

10 UX research deliverables that drive action
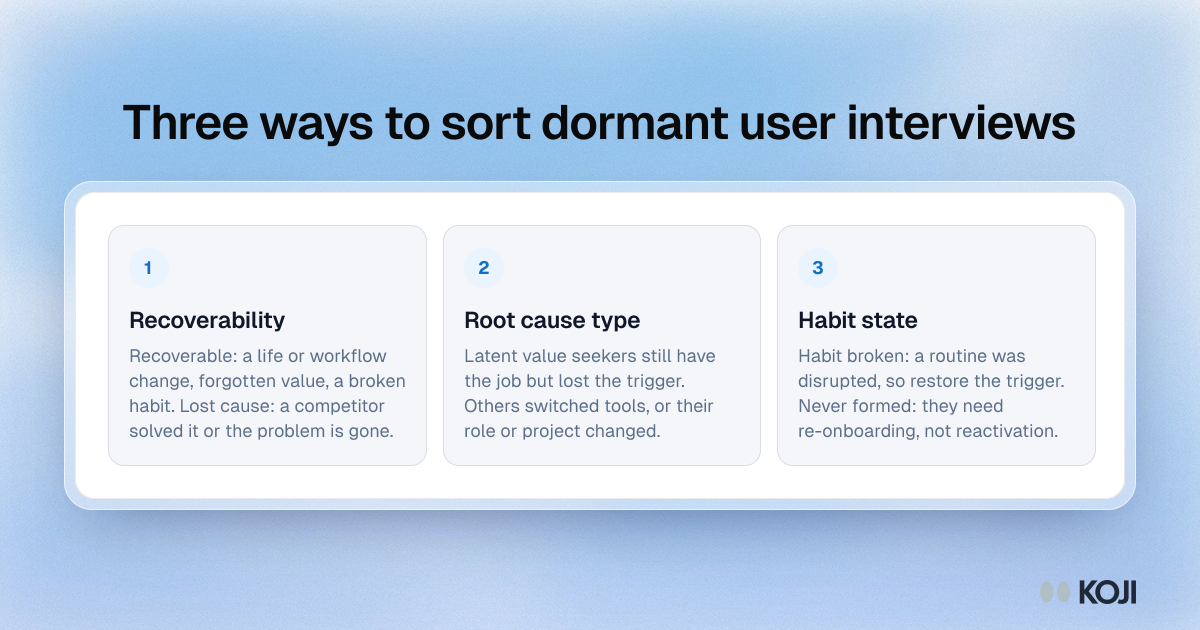
Framework for sorting dormant user interviews on three axes: recoverability, root cause type and habit state.

Framework

Three ways to sort dormant user interviews
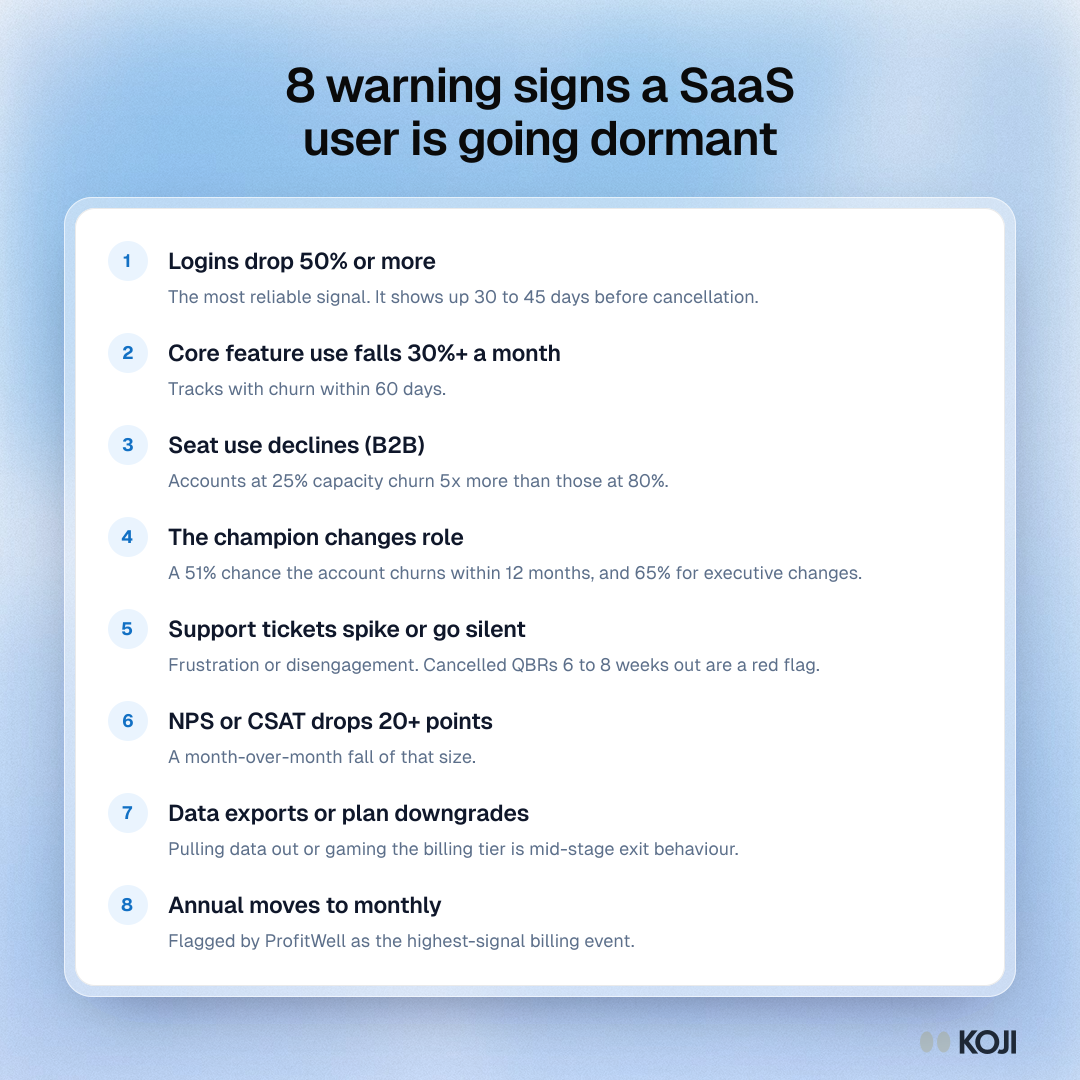
Listicle of eight signs a SaaS user is going dormant, from a 50% drop in logins to switching from annual to monthly billing.

Guide

8 warning signs a SaaS user is going dormant
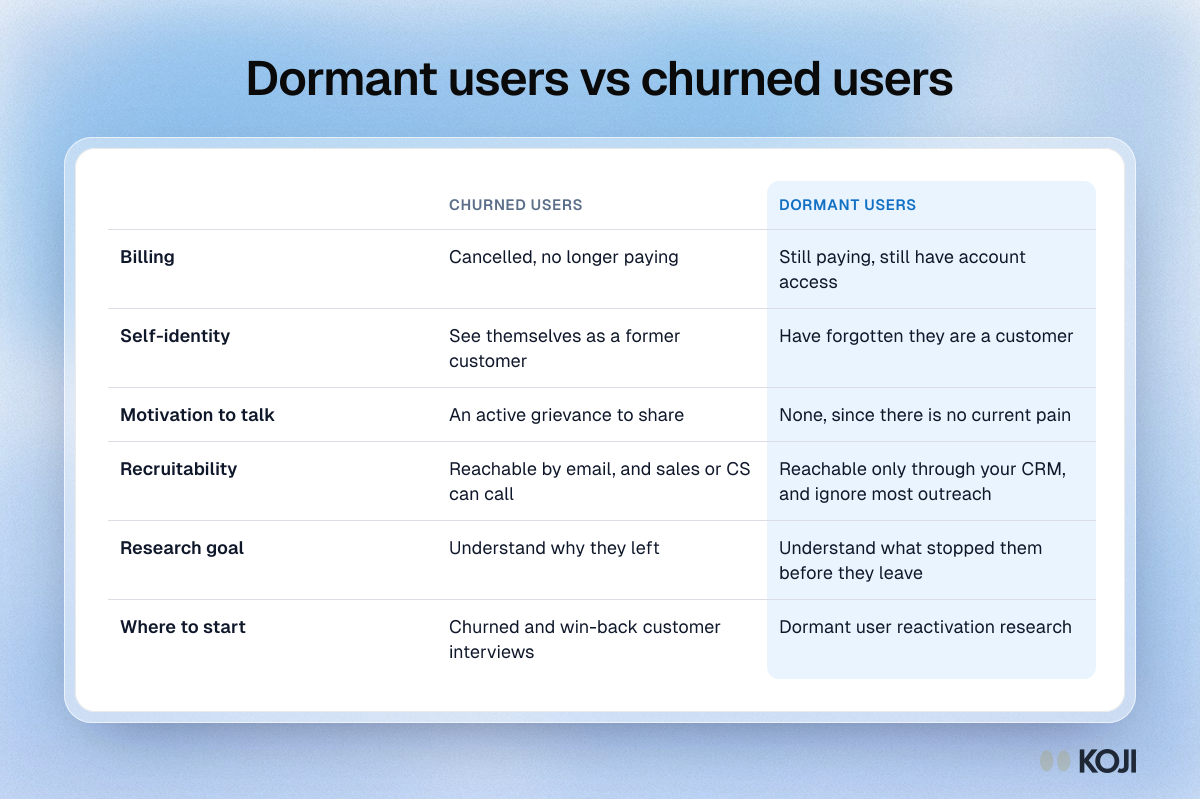
Table comparing churned and dormant users by billing, self-identity, motivation to talk, recruitability and research goal.

Reference table

Dormant users vs churned users
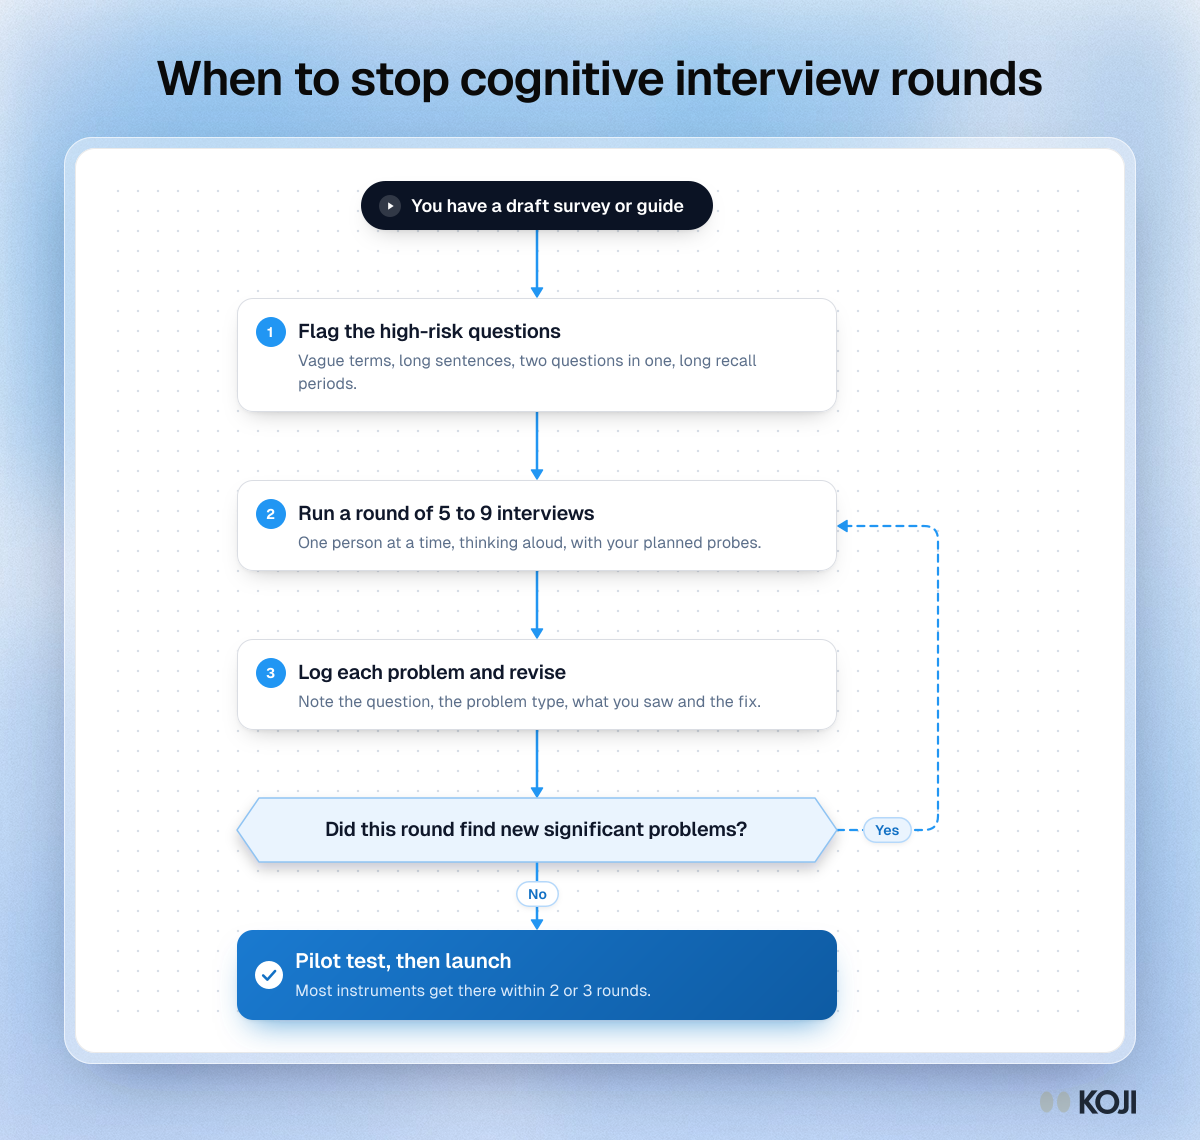
Flowchart for cognitive interview rounds: flag risky questions, run 5 to 9 interviews, revise, and repeat until a round finds nothing new.

Flowchart

When to stop cognitive interview rounds
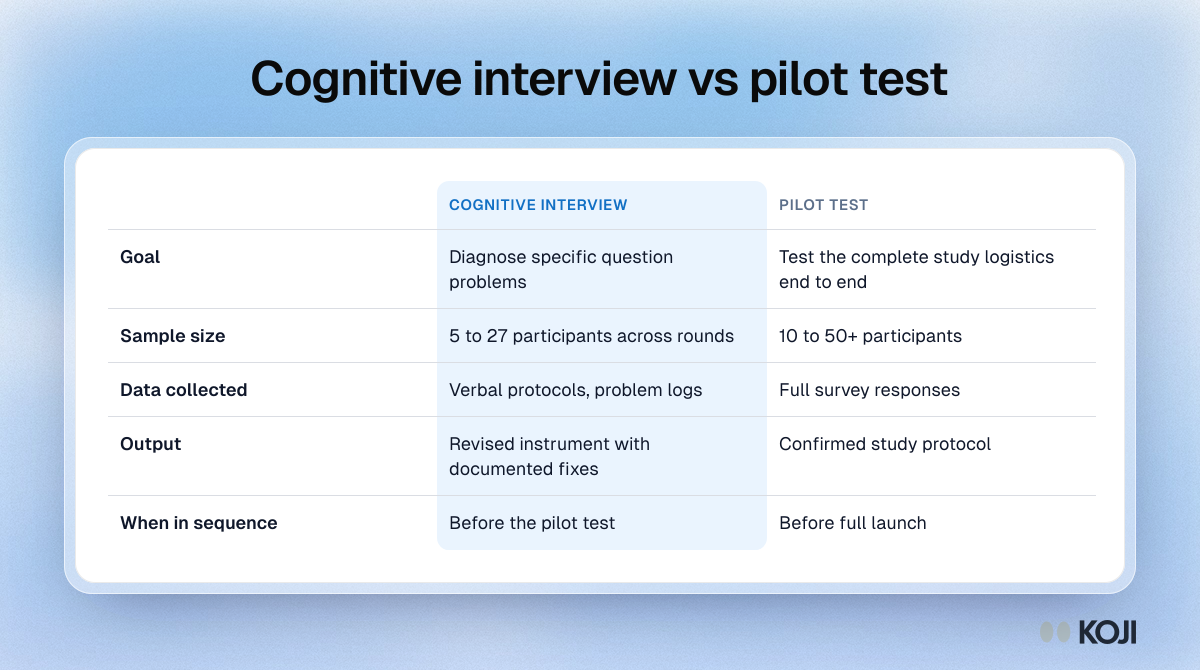
Table comparing cognitive interviews and pilot tests by goal, sample size, data collected, output and when each one runs.

Reference table

Cognitive interview vs pilot test
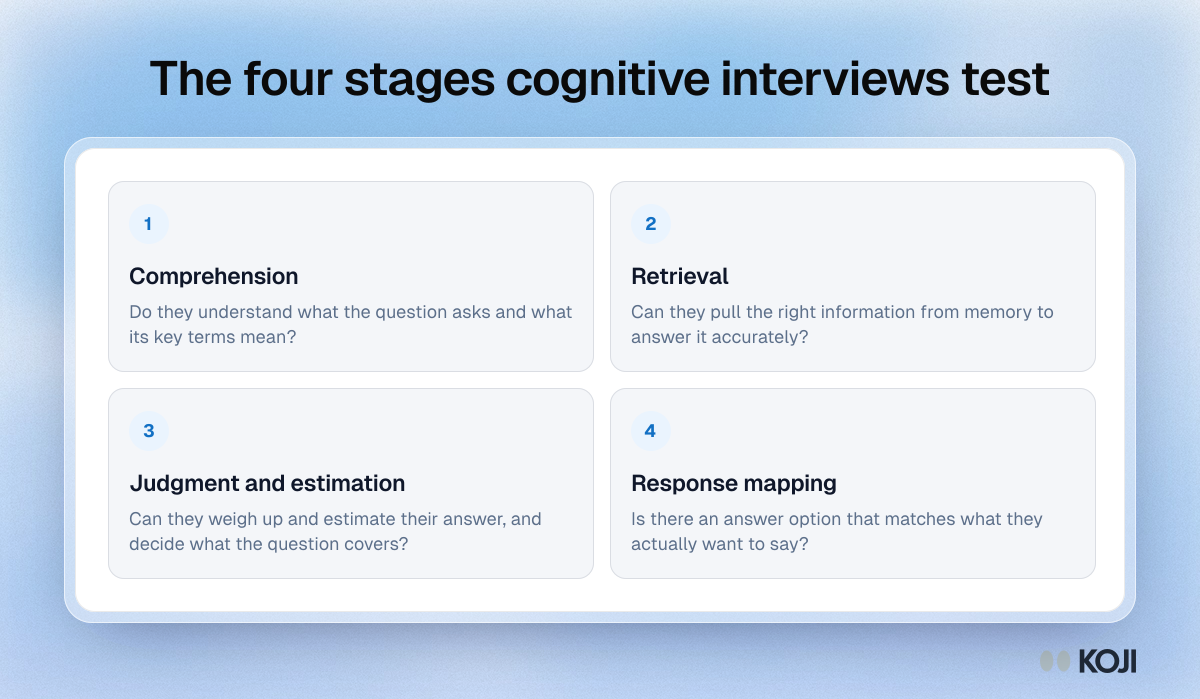
Framework of the four stages cognitive interviews test: comprehension, retrieval, judgment and estimation, and response mapping.

Framework

The four stages cognitive interviews test
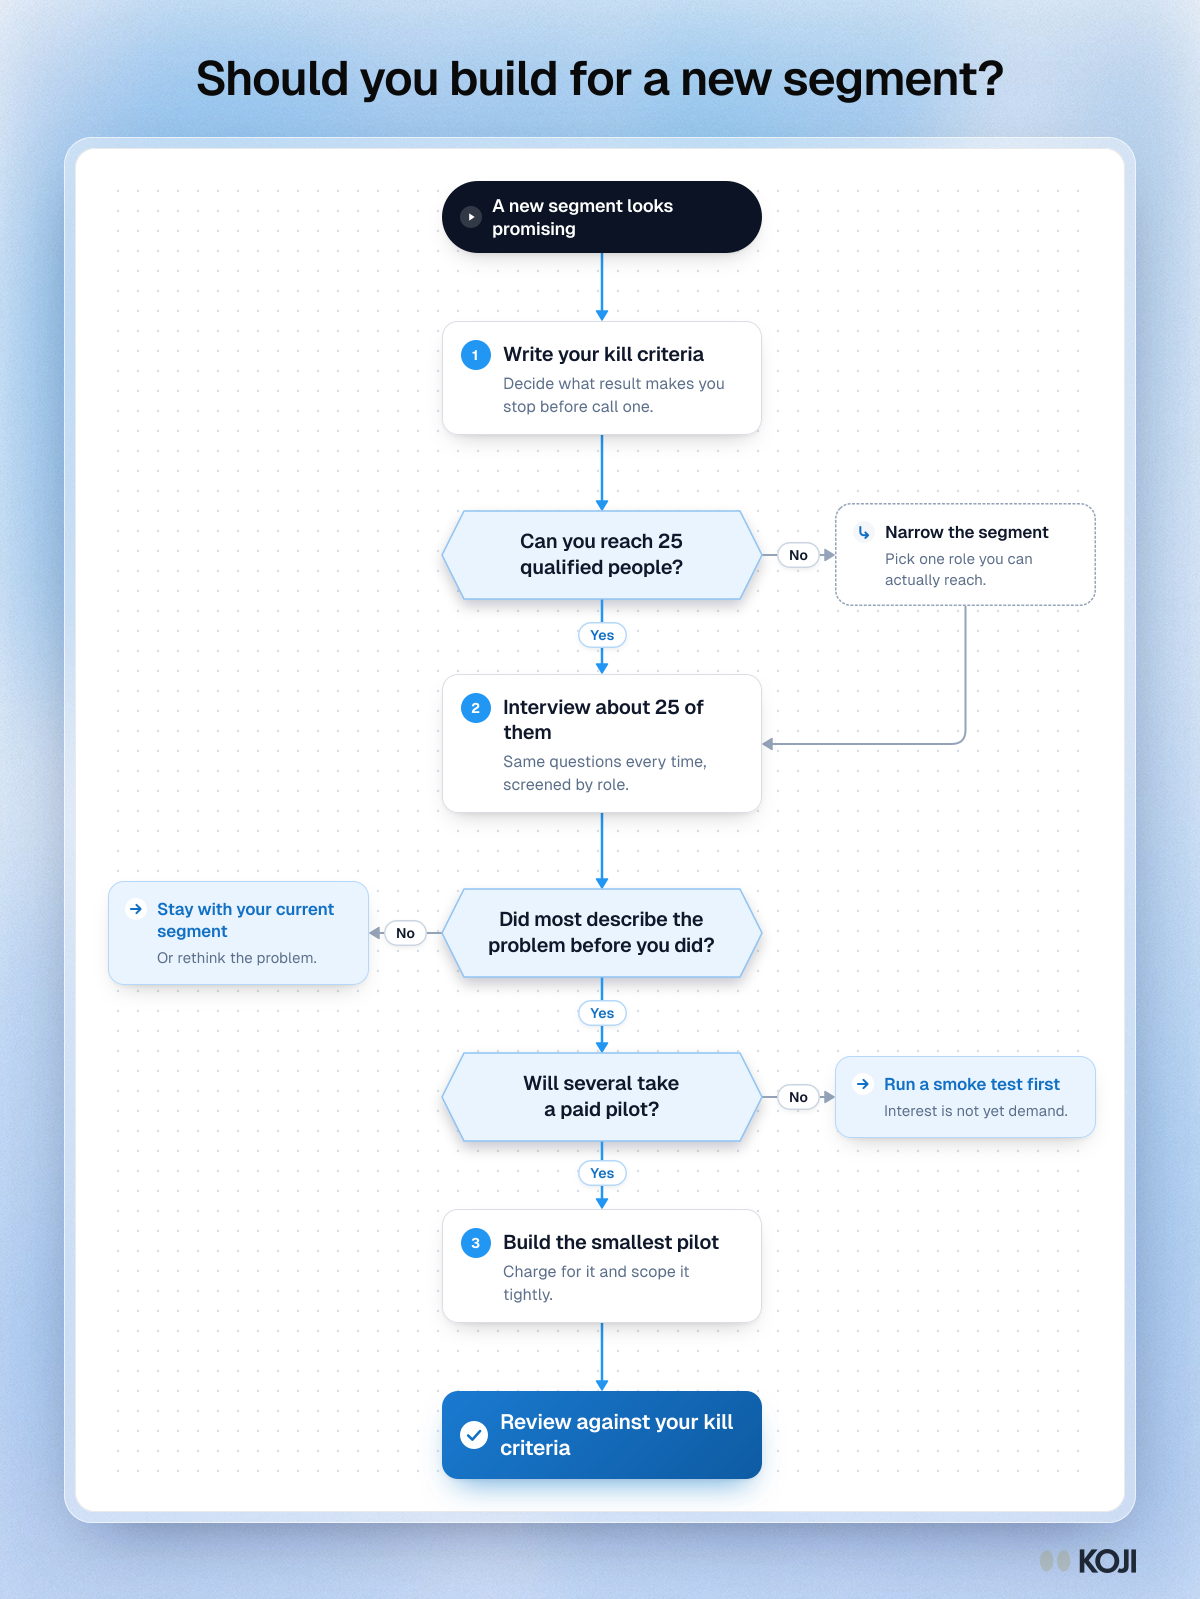
Flowchart for deciding whether to build for a new segment: three questions on reach, the problem and a paid pilot, ending in a review of your kill criteria.

Flowchart

Should you build for a new segment?
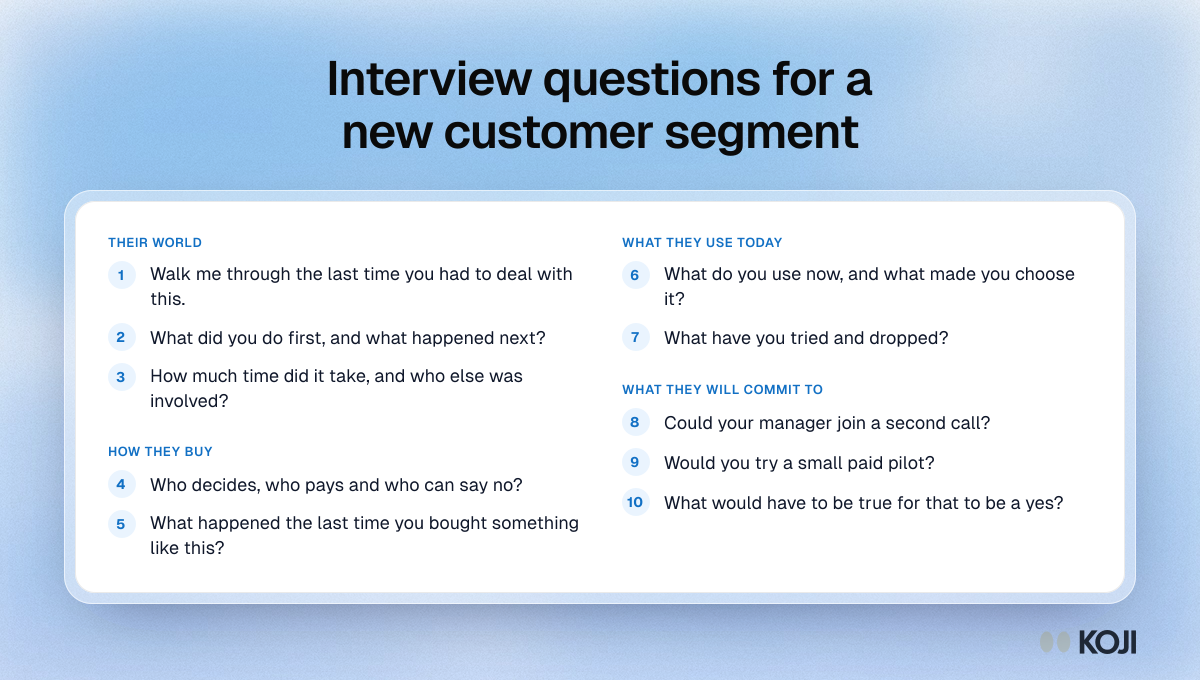
Question bank for interviewing a new customer segment, in four groups: their world, how they buy, what they use today and what they will commit to.

Question bank

Interview questions for a new customer segment
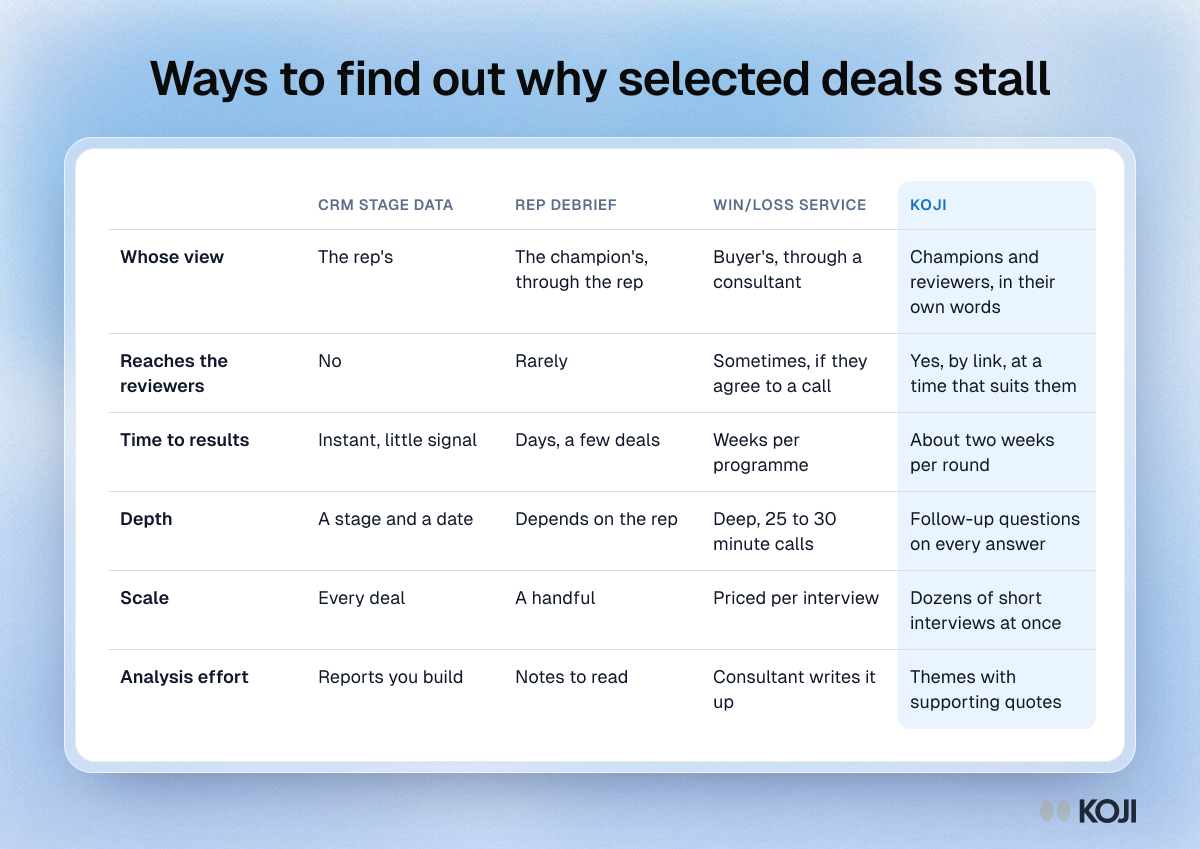
Table comparing CRM stage data, rep debriefs, win/loss interview services and Koji for finding out why selected deals stall in review.

Reference table

Ways to find out why selected deals stall
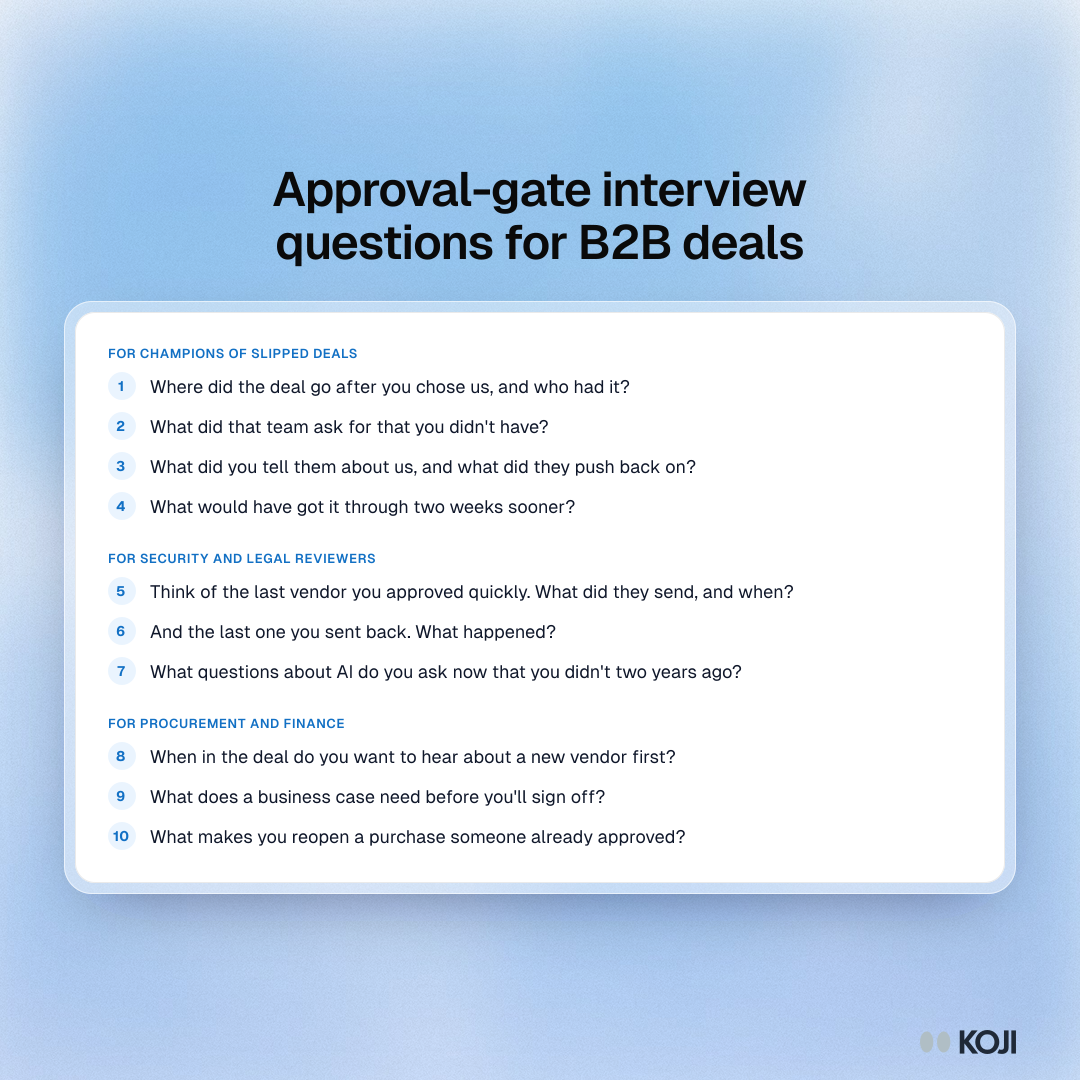
Question bank for approval-gate interviews with questions for champions of slipped deals and for security, legal, procurement and finance reviewers.

Question bank

Approval-gate interview questions for B2B deals
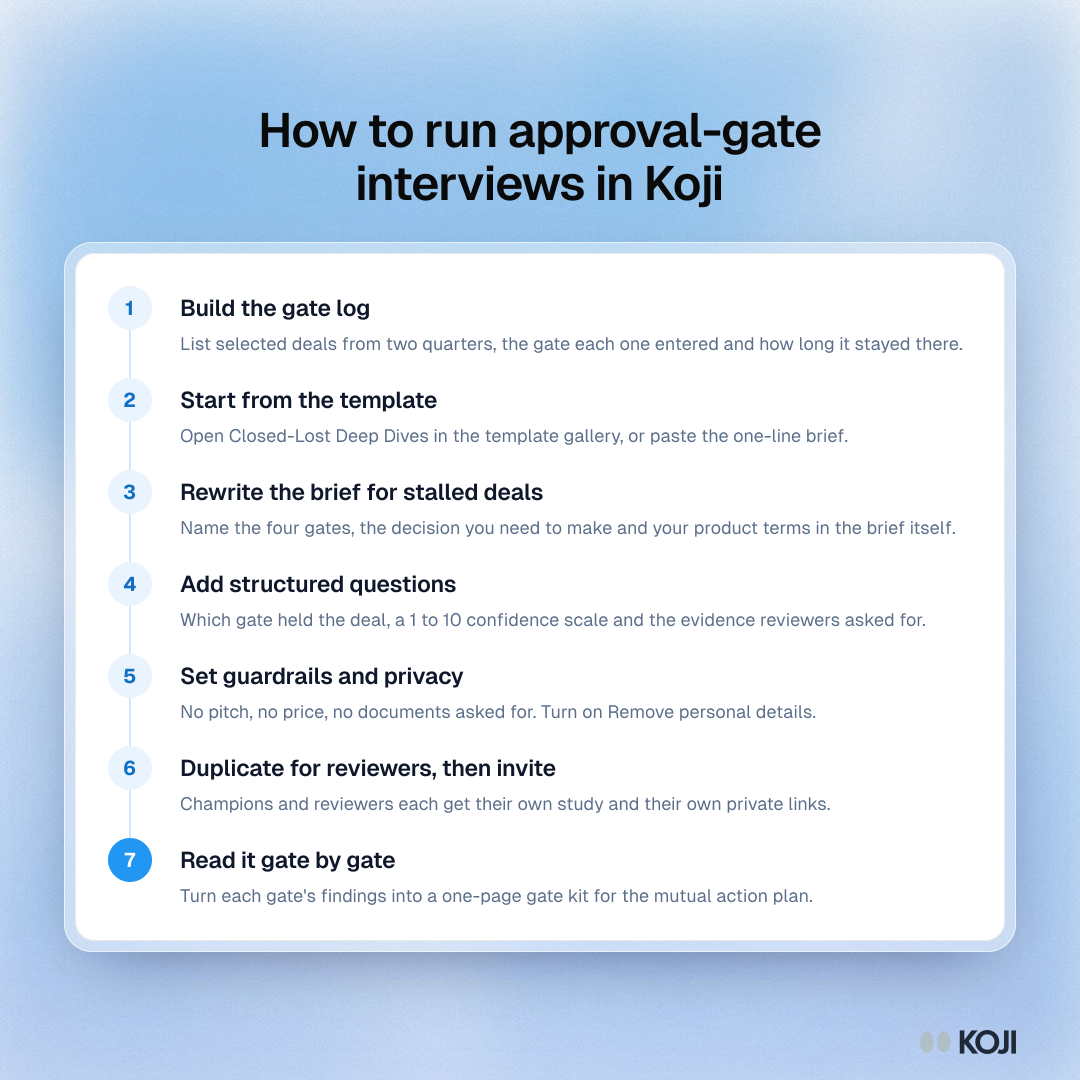
Process with seven steps to run approval-gate interviews in Koji, from the gate log to the gate kit.

Process

How to run approval-gate interviews in Koji
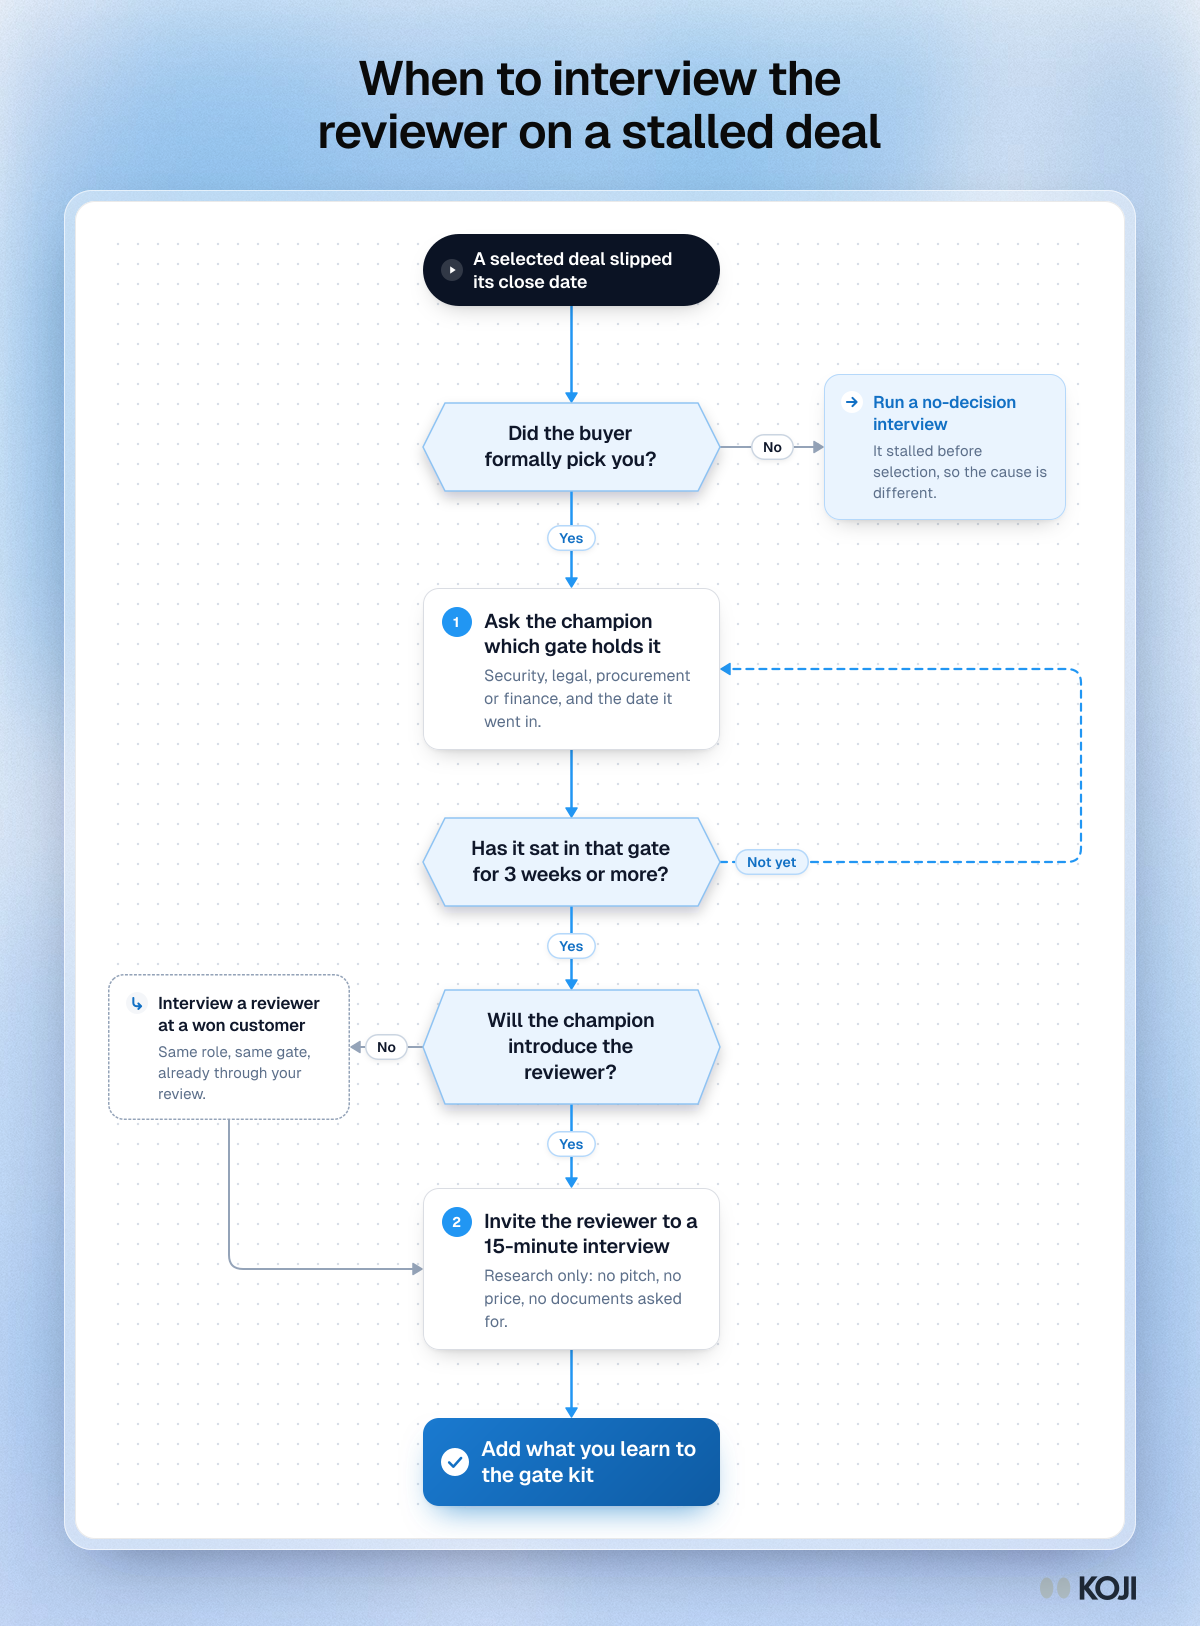
Flowchart for a slipped deal: confirm the buyer picked you, find the gate, wait three weeks, then interview the reviewer or one at a won customer.

Flowchart

When to interview the reviewer on a stalled deal
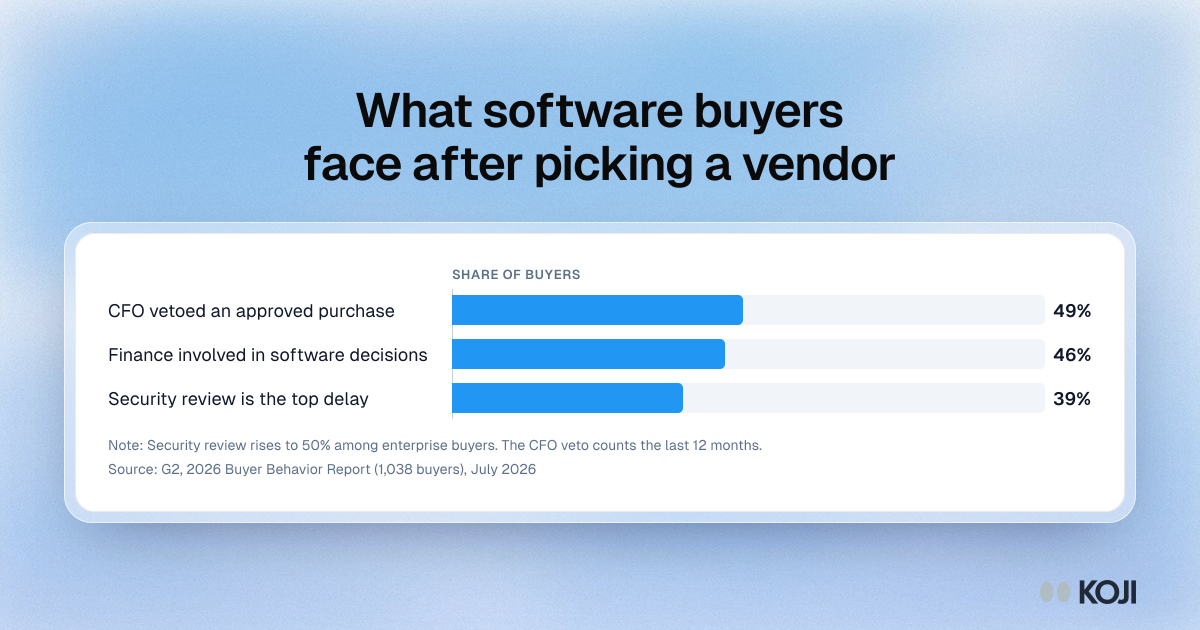
Bar chart of G2 2026 buyer survey results: 49% saw a CFO veto an approved purchase, 46% have finance involved, 39% name security review as the top delay.

Bar chart

What software buyers face after picking a vendor
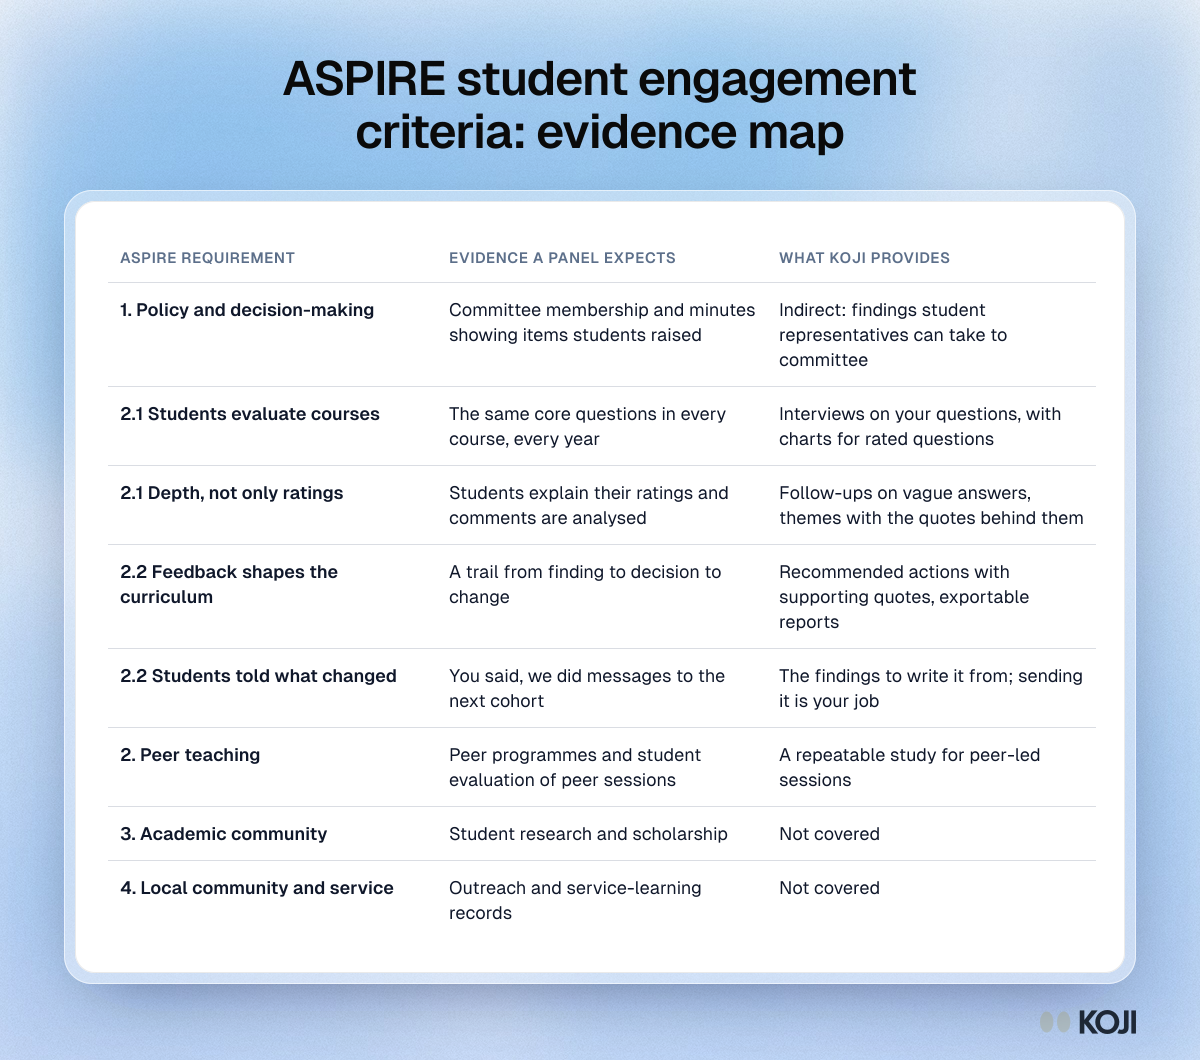
Table mapping the ASPIRE student engagement criteria to the evidence a panel expects and the course evaluation outputs that support each one.

Reference table

ASPIRE student engagement criteria: evidence map
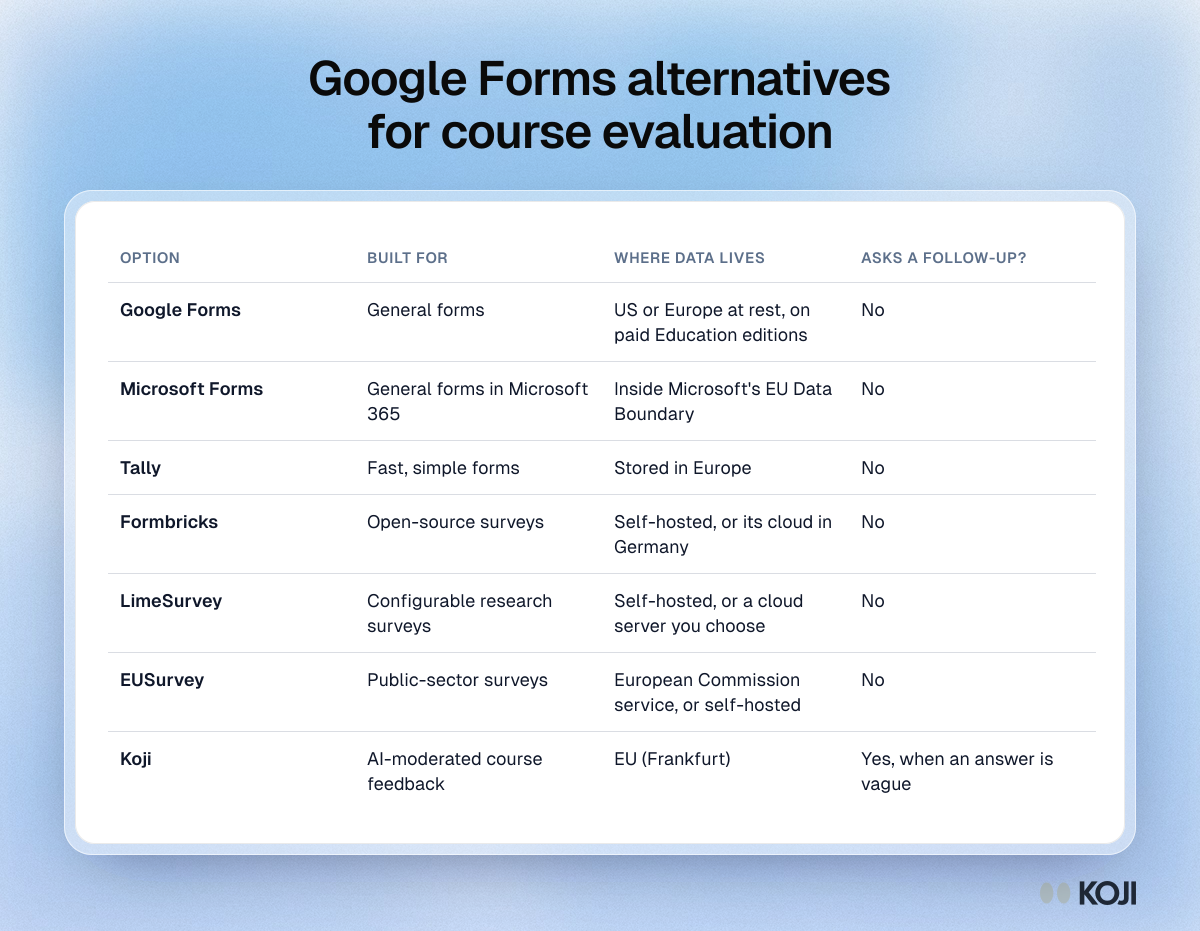
Table comparing six Google Forms alternatives for course evaluation, from Microsoft Forms and LimeSurvey to Koji, by purpose, data location and follow-ups.

Reference table

Google Forms alternatives for course evaluation
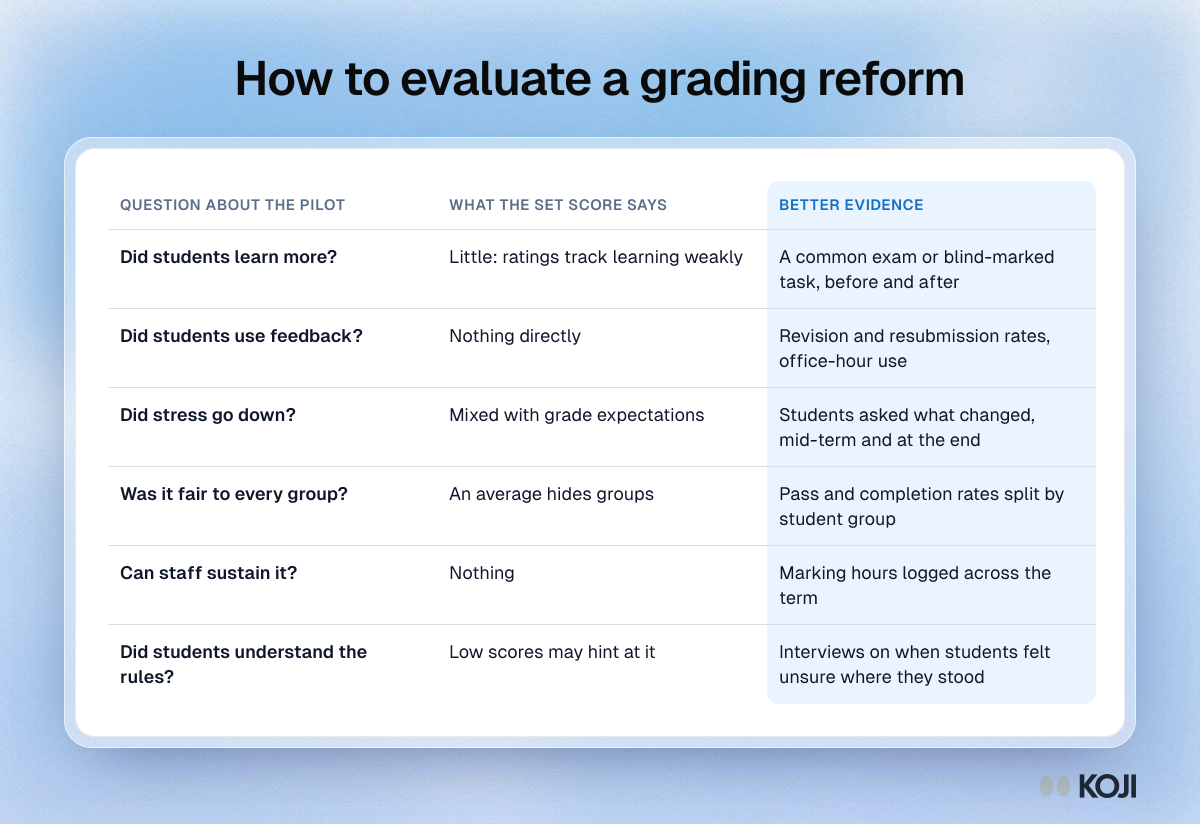
Table setting what a course evaluation score says about a grading reform against better evidence on learning, feedback use, stress, fairness and staff time.

Reference table

How to evaluate a grading reform
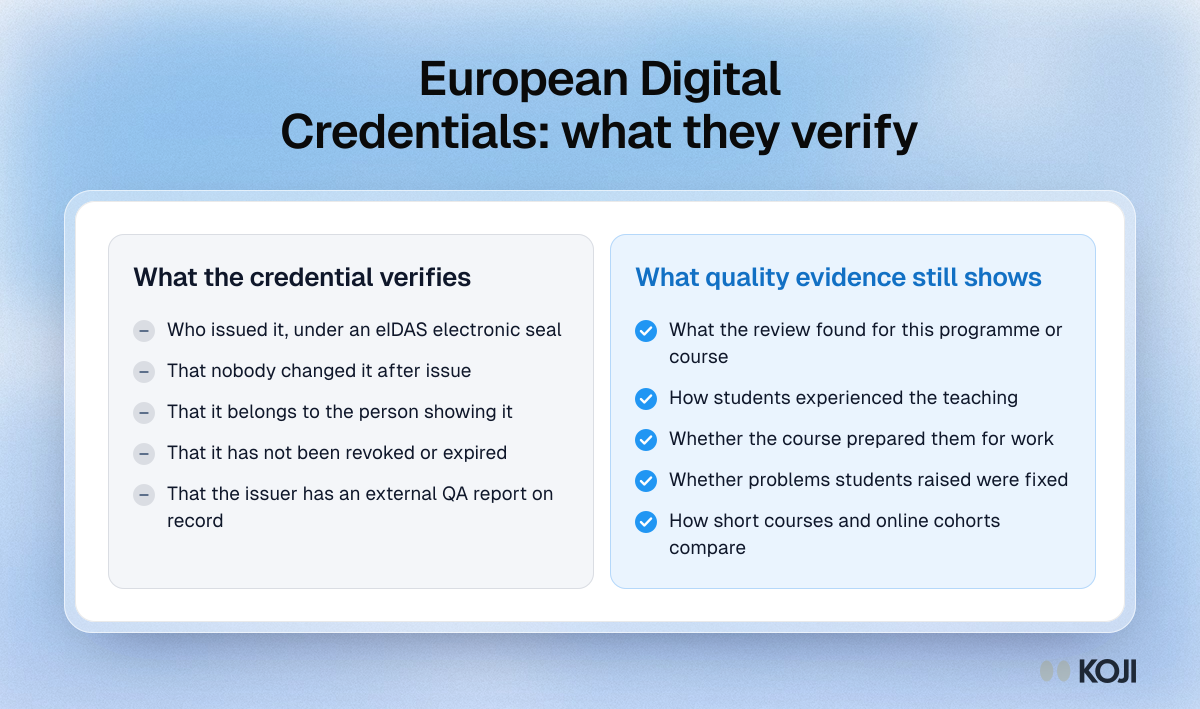
Comparison of what a European Digital Credential verifies, from issuer and integrity to accreditation record, against what quality evidence still has to show.

Comparison

European Digital Credentials: what they verify
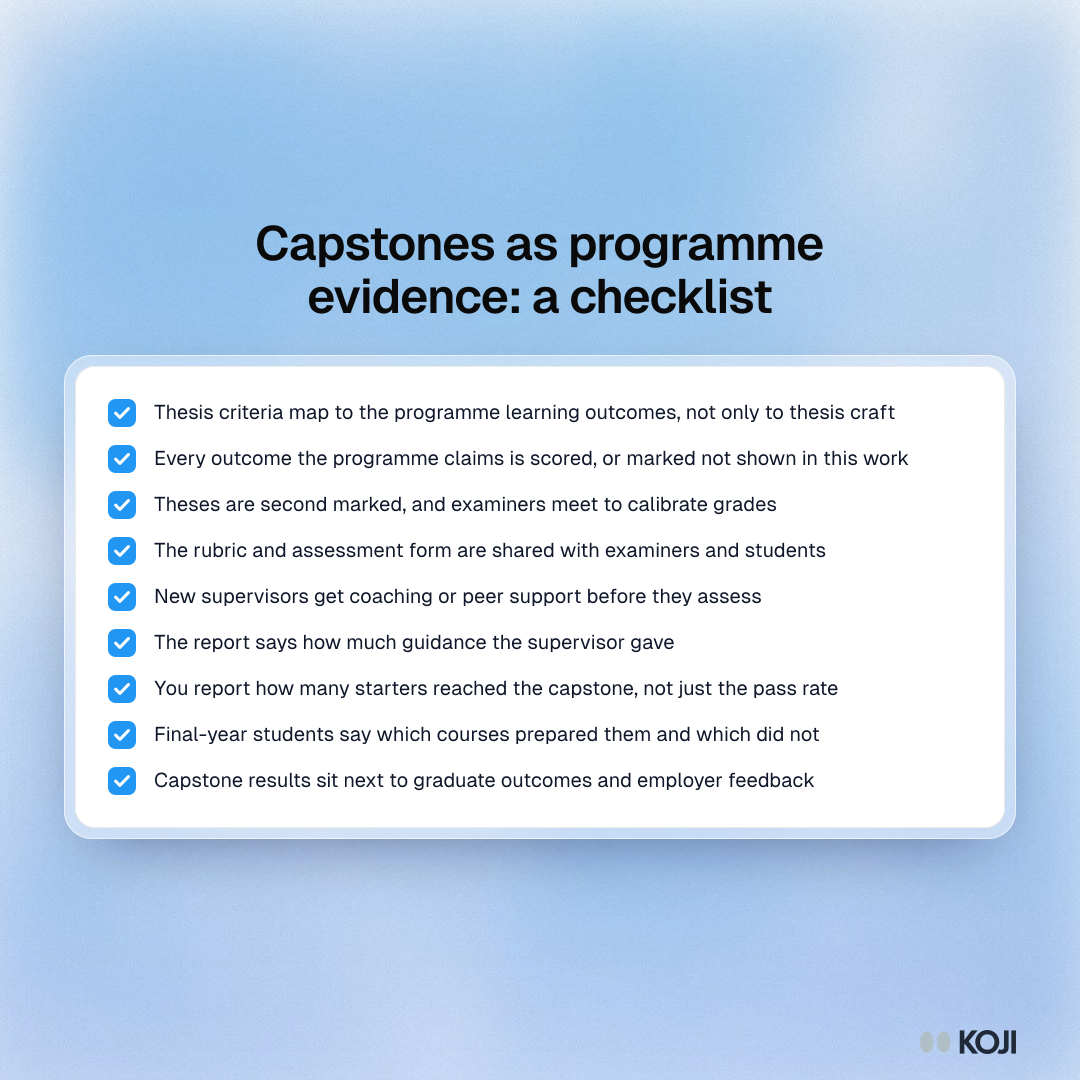
Checklist for using capstones and final theses as programme evidence: mapping criteria to outcomes, second marking, counting non-completers, asking students.

Checklist

Capstones as programme evidence: a checklist
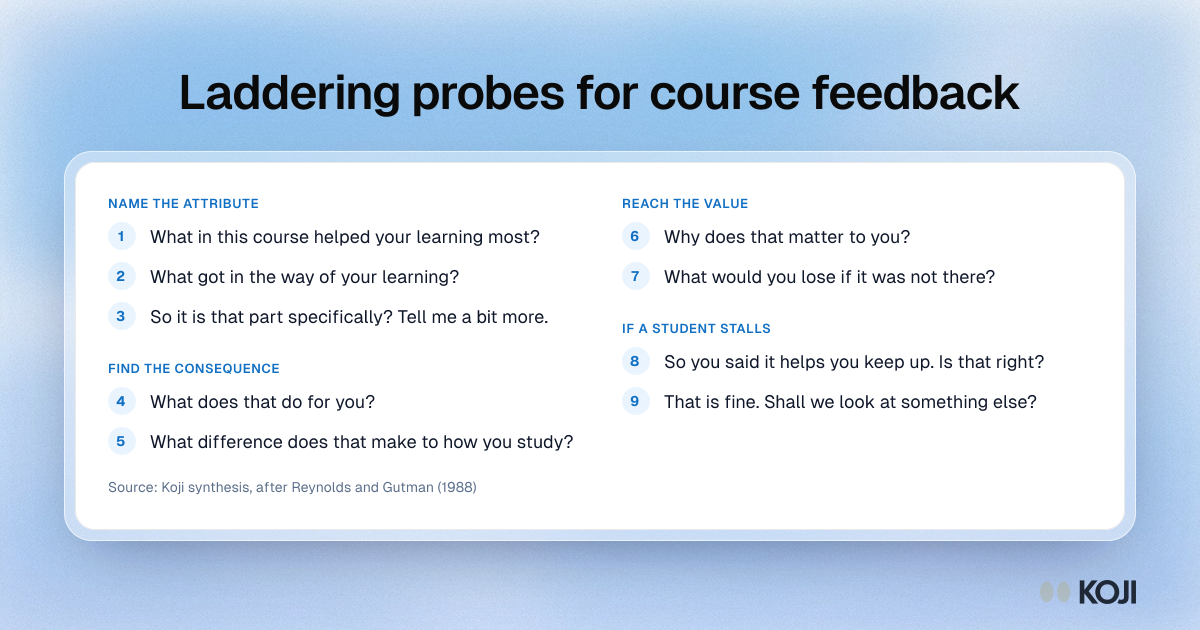
Question bank of laddering probes for course feedback: name the attribute, find the consequence, reach the value, and what to ask if a student stalls.

Question bank

Laddering probes for course feedback
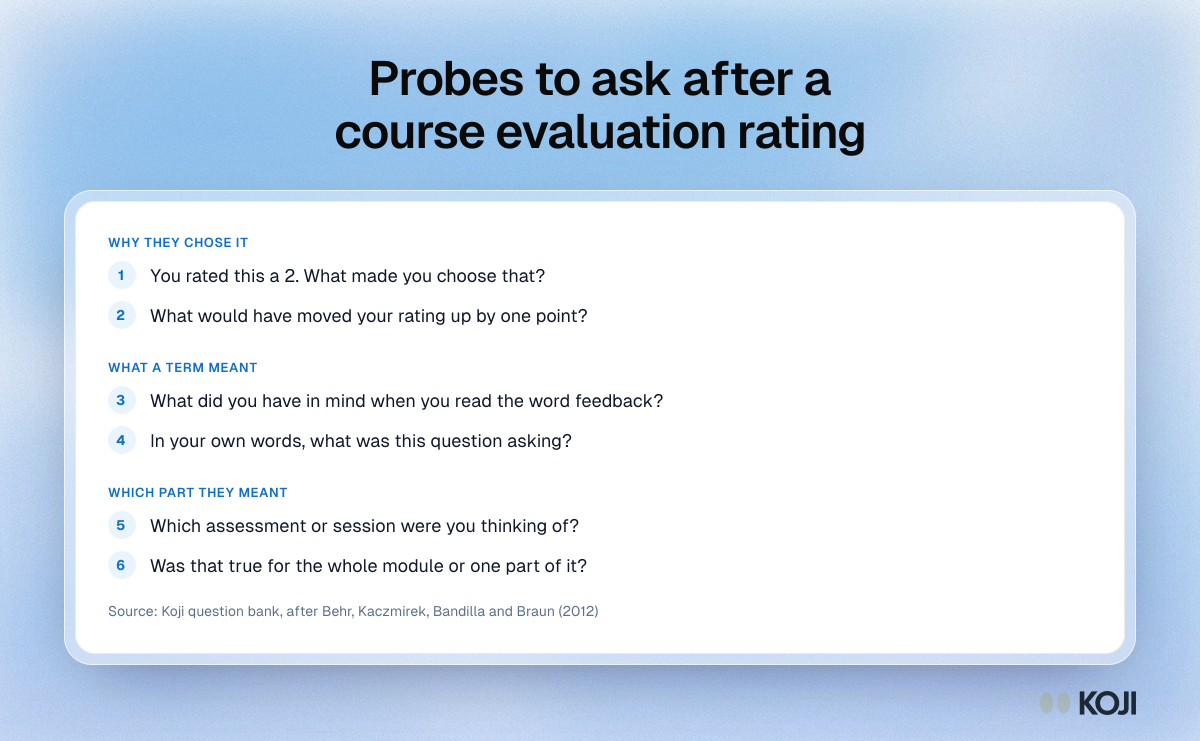
Question bank of six follow-up probes for course evaluation ratings, grouped into why the student chose it, what a term meant and which part they meant.

Question bank

Probes to ask after a course evaluation rating
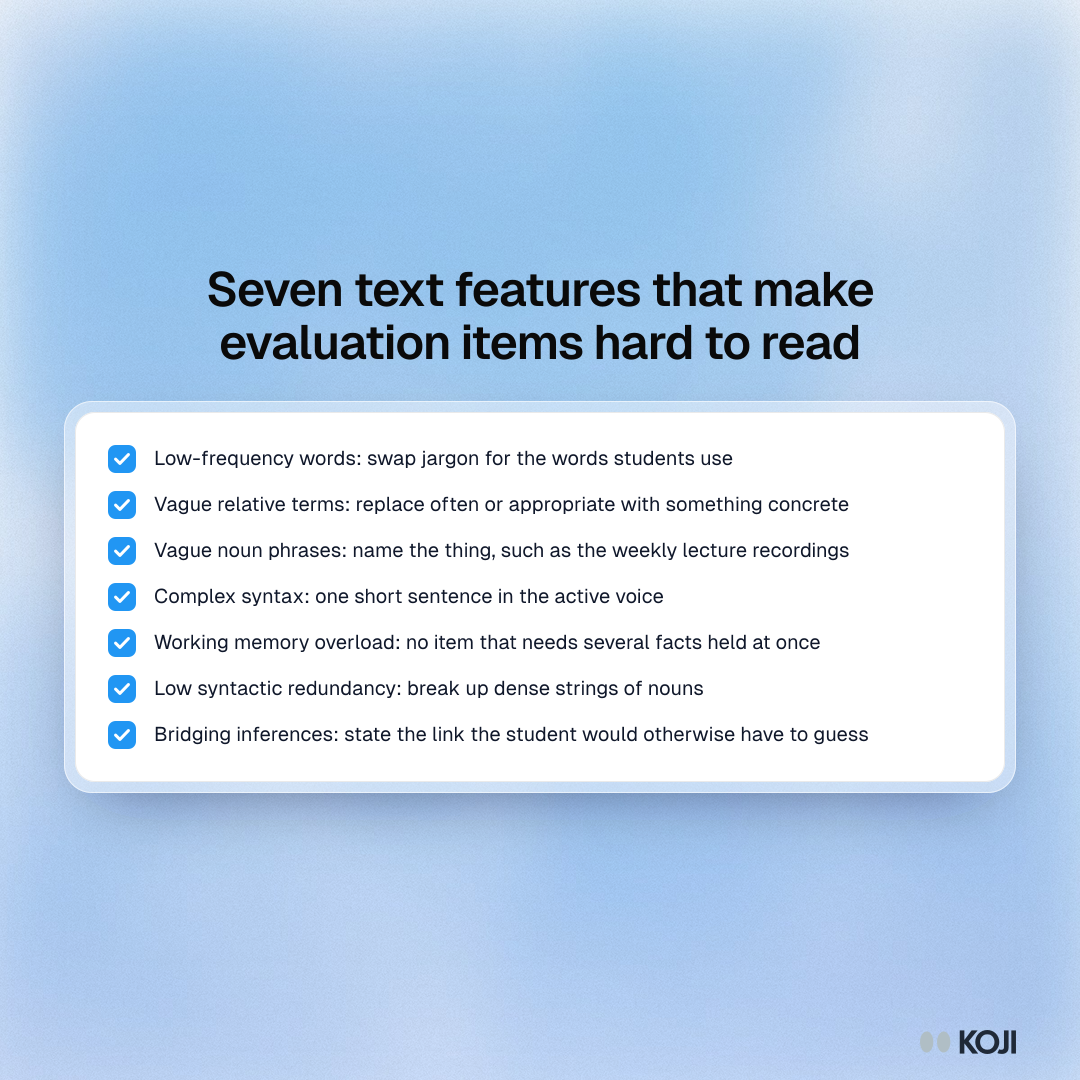
Checklist of seven text features that make course evaluation items hard to understand, from low-frequency words to bridging inferences, each with a fix.

Checklist

Seven text features that make evaluation items hard to read
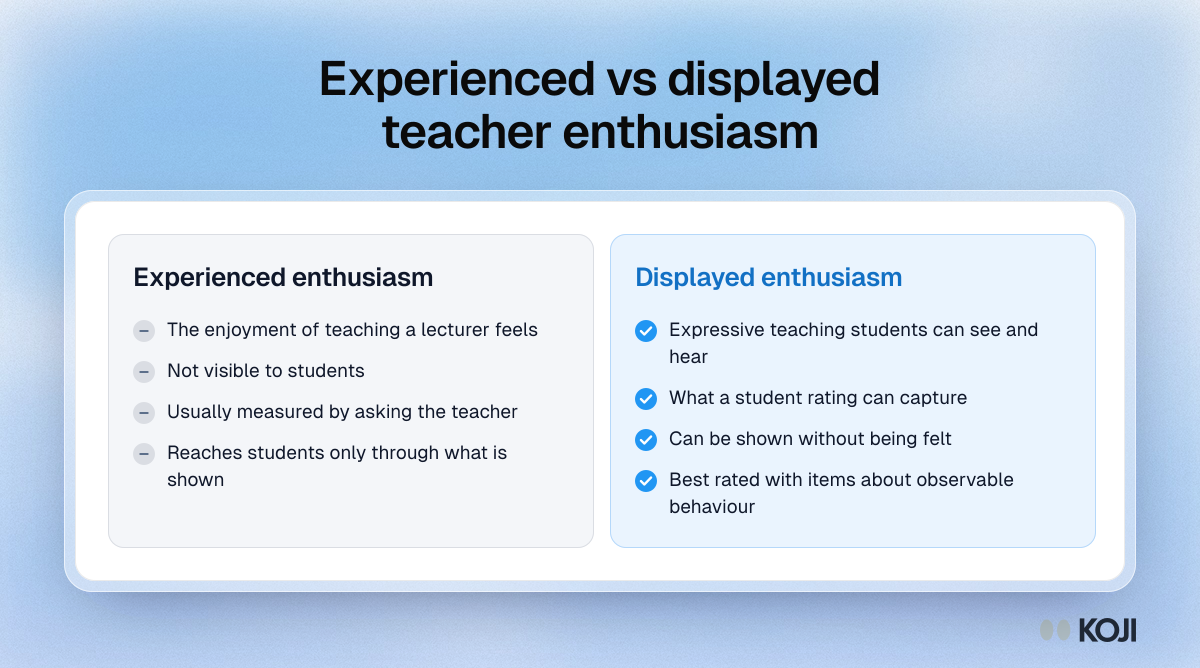
Comparison of experienced and displayed teacher enthusiasm: what each one is, who can observe it, and what a student rating can say about it.

Comparison

Experienced vs displayed teacher enthusiasm
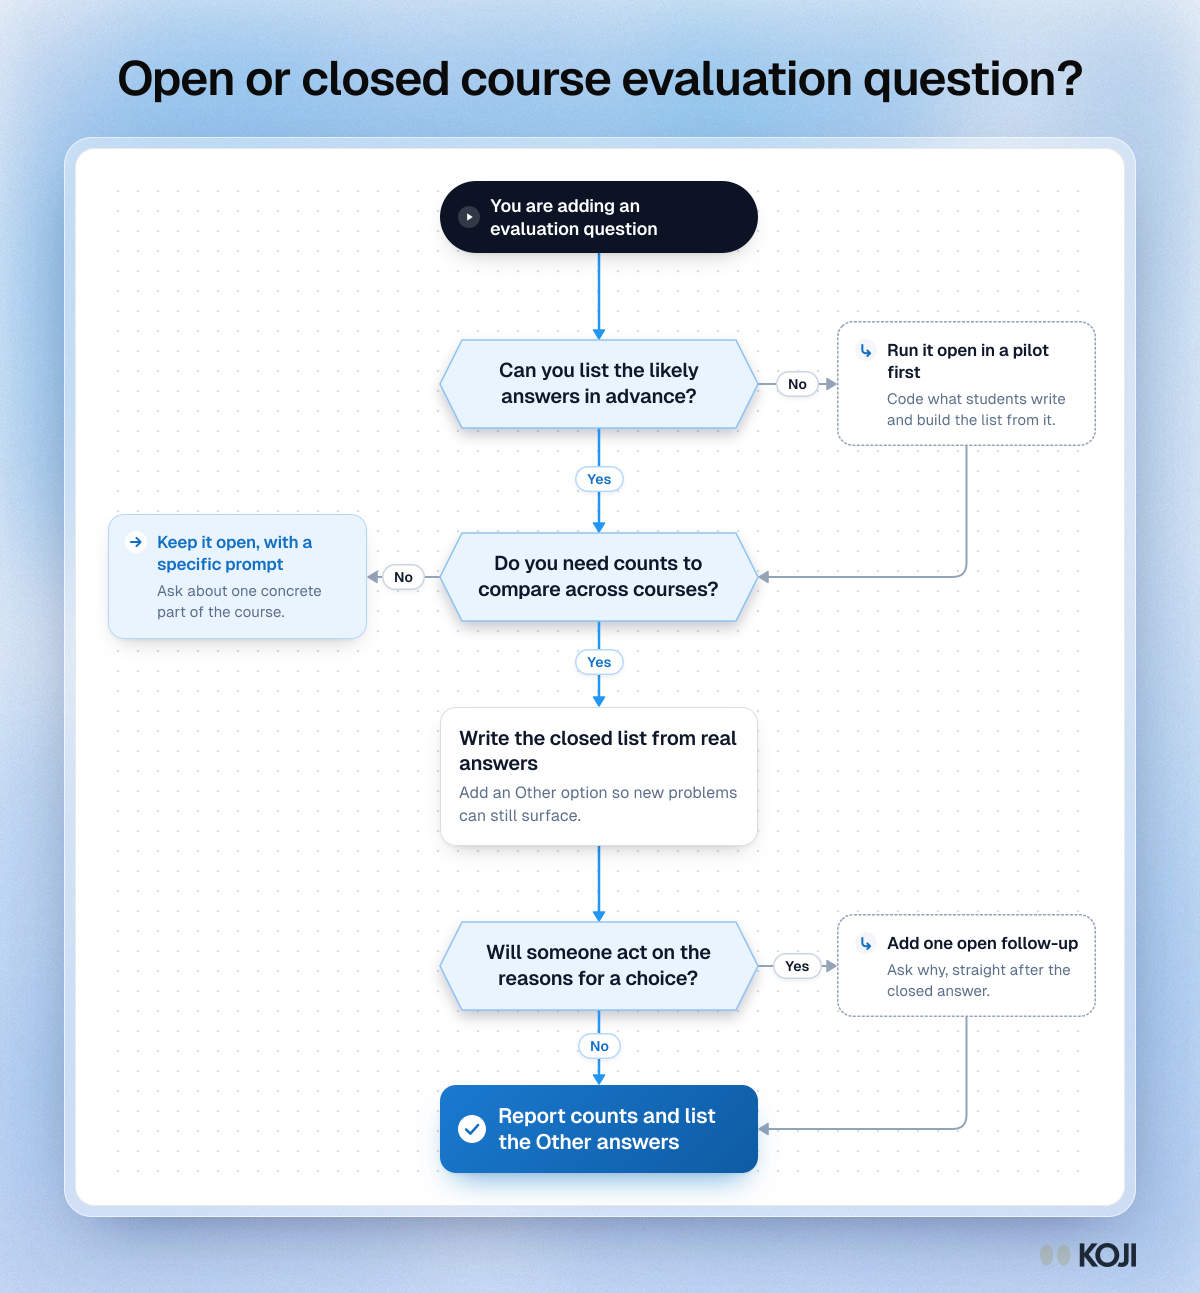
Flowchart for choosing between an open and a closed course evaluation question: three questions, two side steps and one exit, ending in reported counts.

Flowchart

Open or closed course evaluation question?
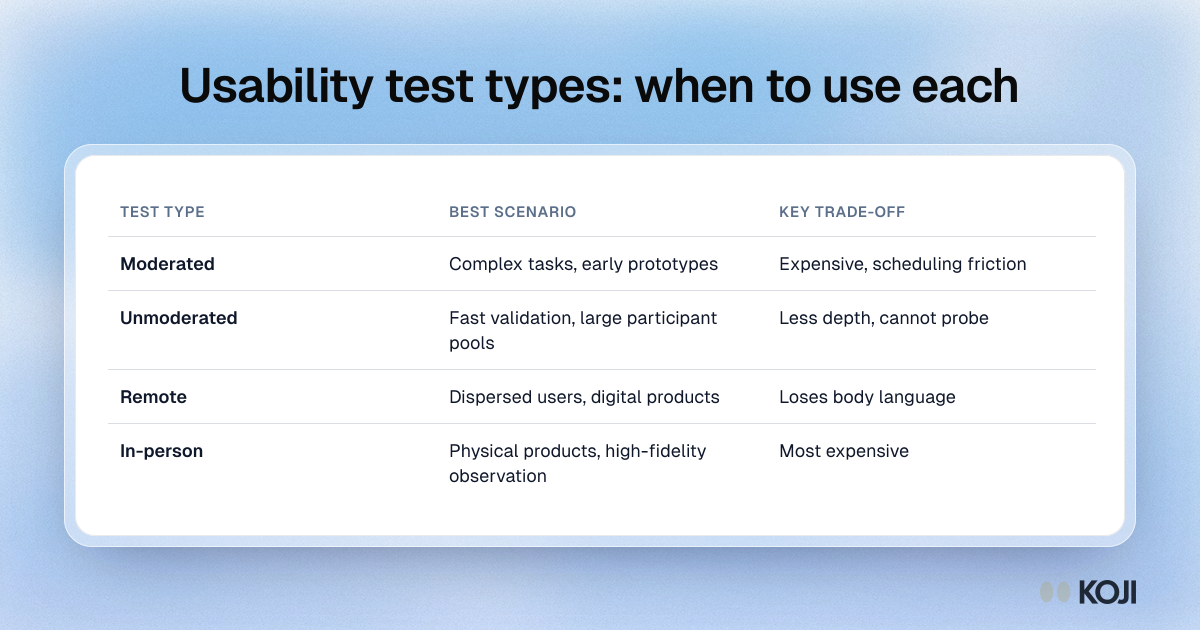
Table of four usability test types, moderated, unmoderated, remote and in-person, with the best scenario and main trade-off for each.

Reference table

Usability test types: when to use each
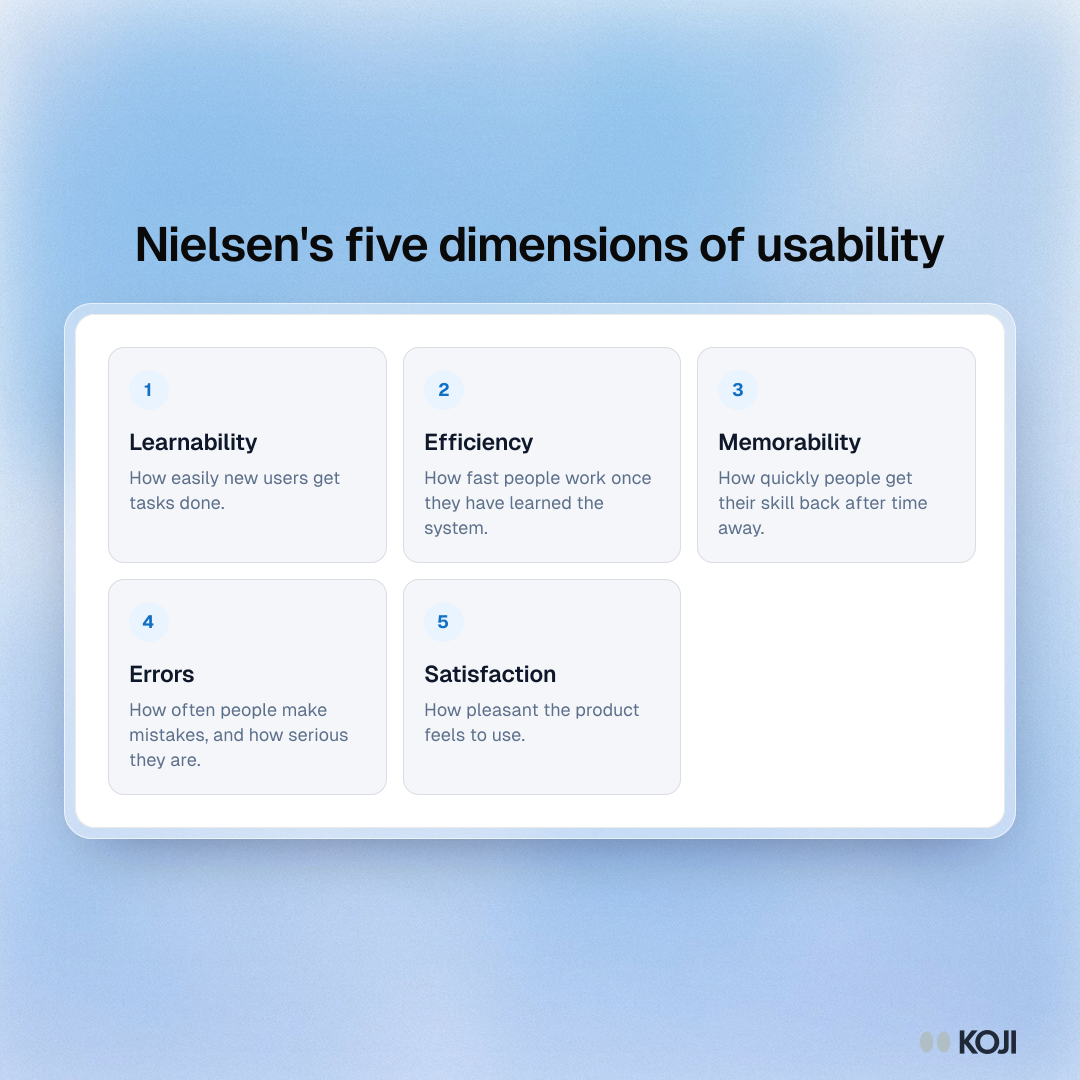
Framework of the five dimensions of usability defined by Jakob Nielsen: learnability, efficiency, memorability, errors and satisfaction.

Framework

Nielsen's five dimensions of usability
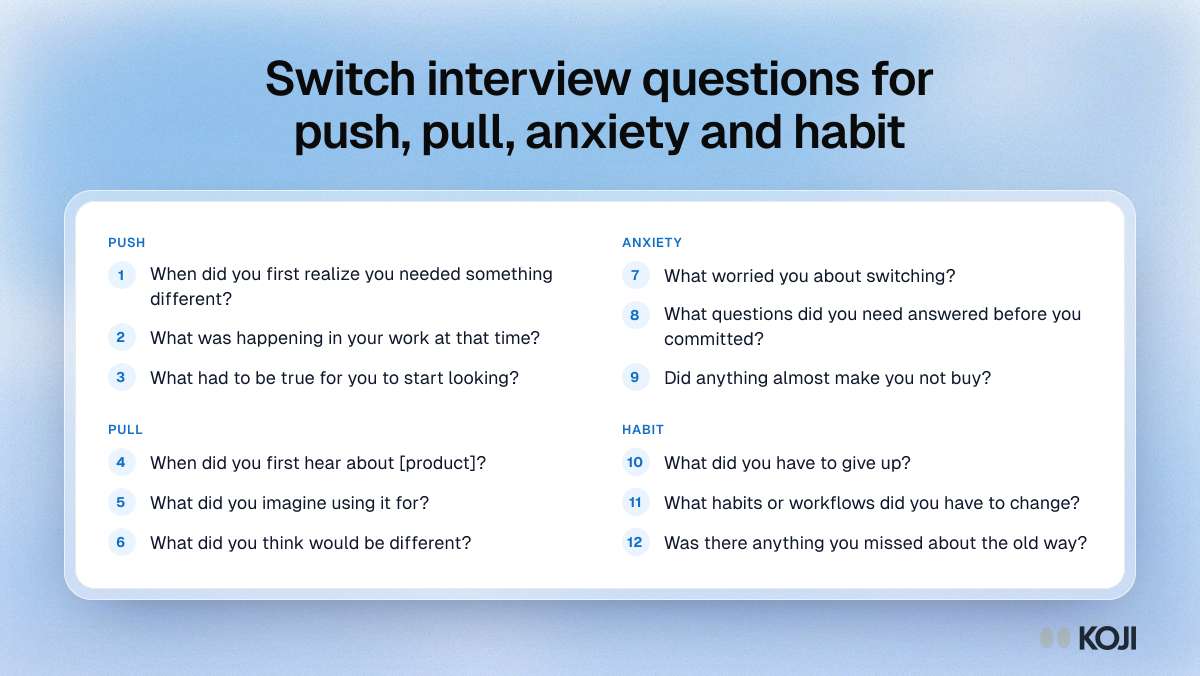
Question bank of twelve switch interview questions, three for each force of progress: push, pull, anxiety and habit.

Question bank

Switch interview questions for push, pull, anxiety and habit
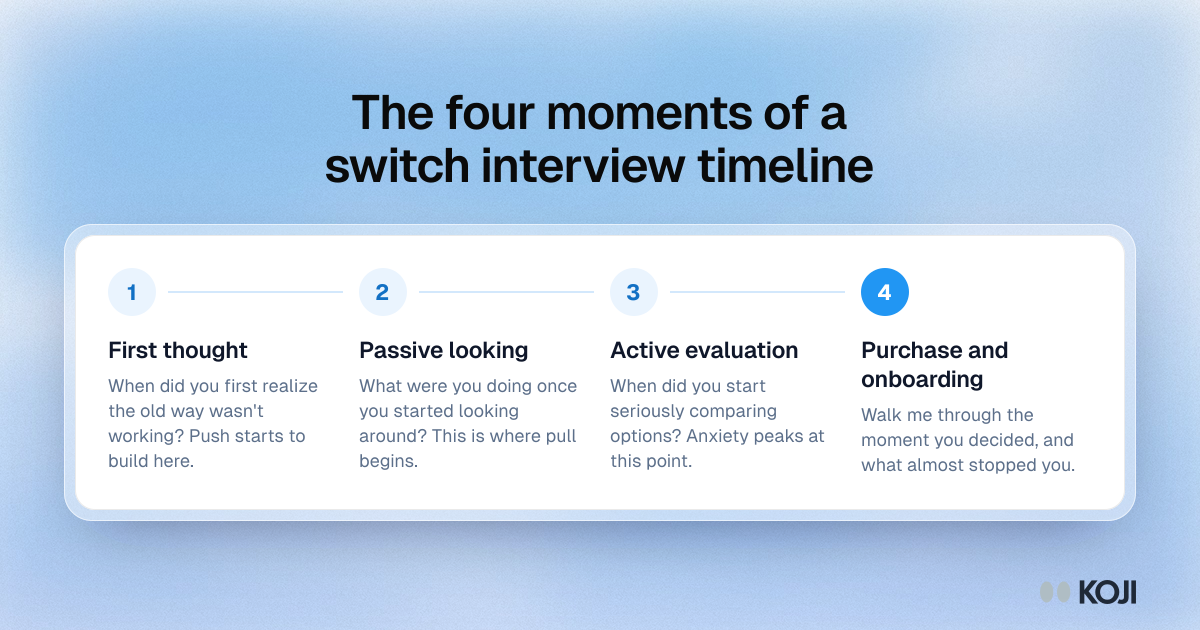
Process showing the four moments a switch interview rebuilds: first thought, passive looking, active evaluation, and purchase and onboarding.

Process

The four moments of a switch interview timeline
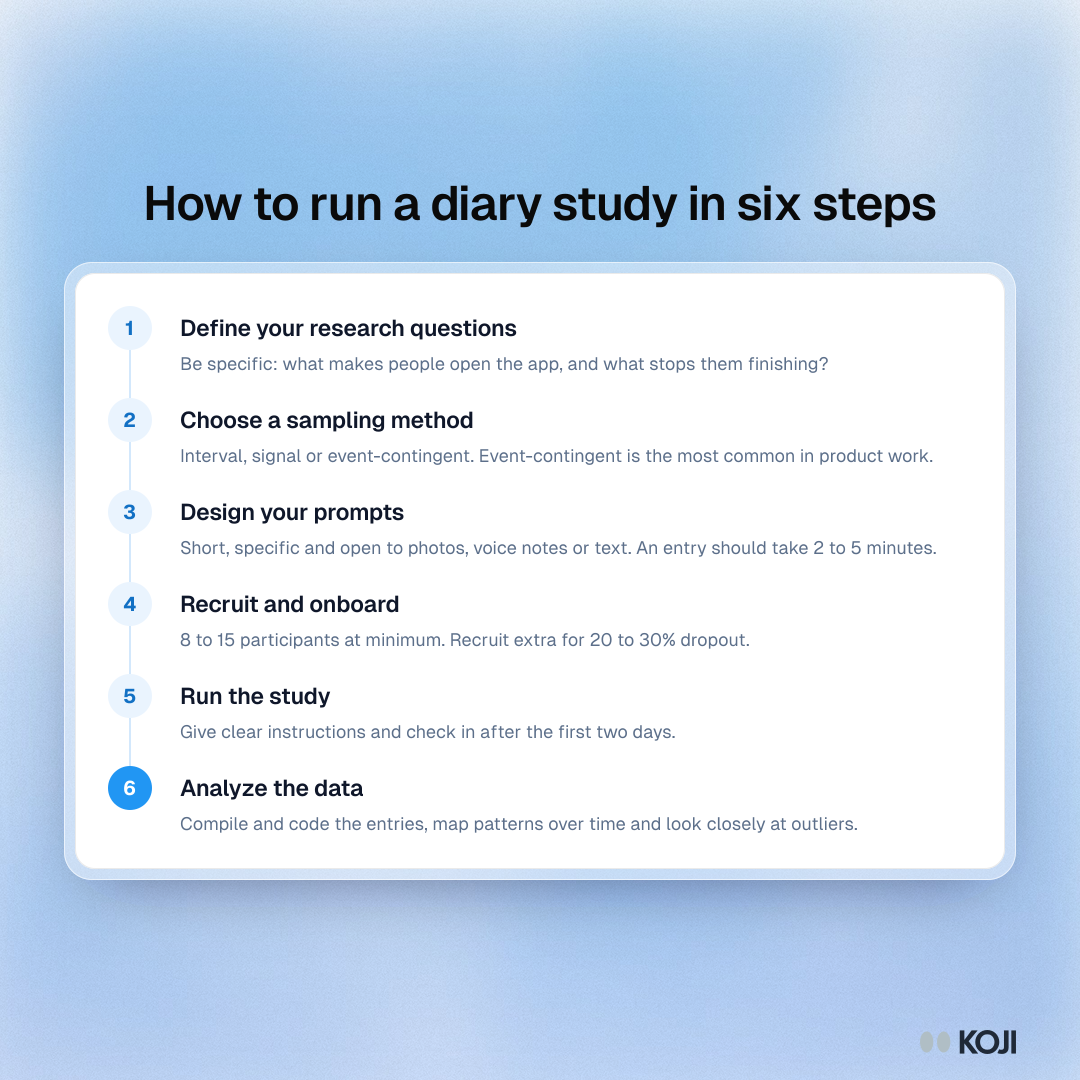
Process showing six steps of a diary study: research questions, sampling method, prompts, recruiting with dropout in mind, running it and analysis.

Process

How to run a diary study in six steps
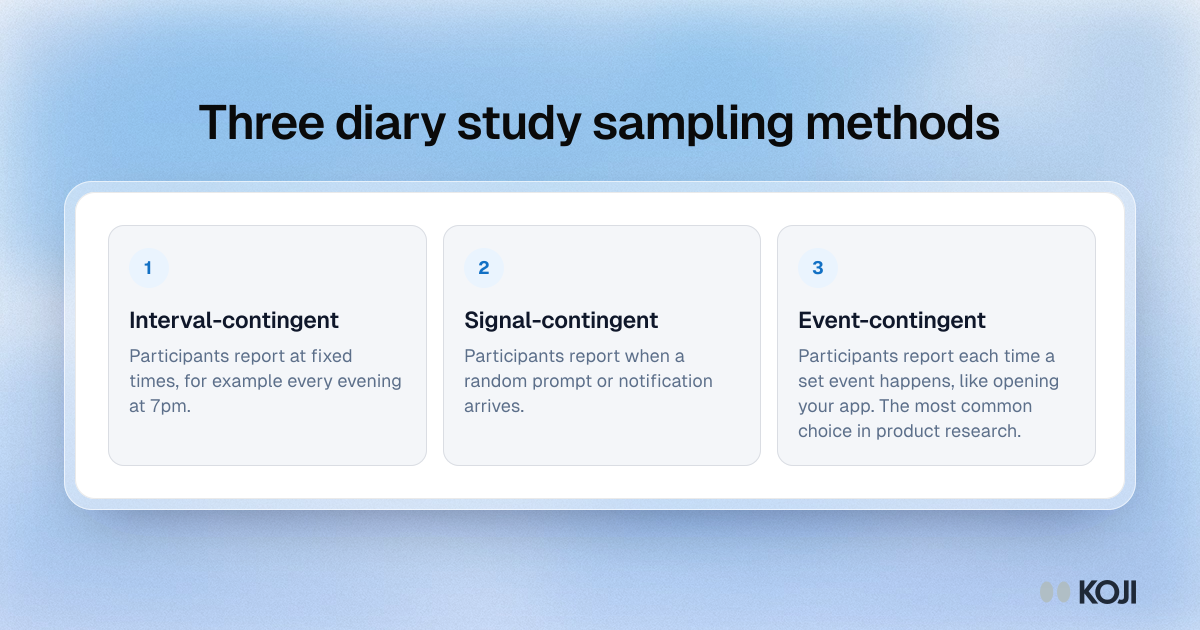
Framework of three diary study sampling methods: interval-contingent at fixed times, signal-contingent on a random prompt and event-contingent after an event.

Framework

Three diary study sampling methods
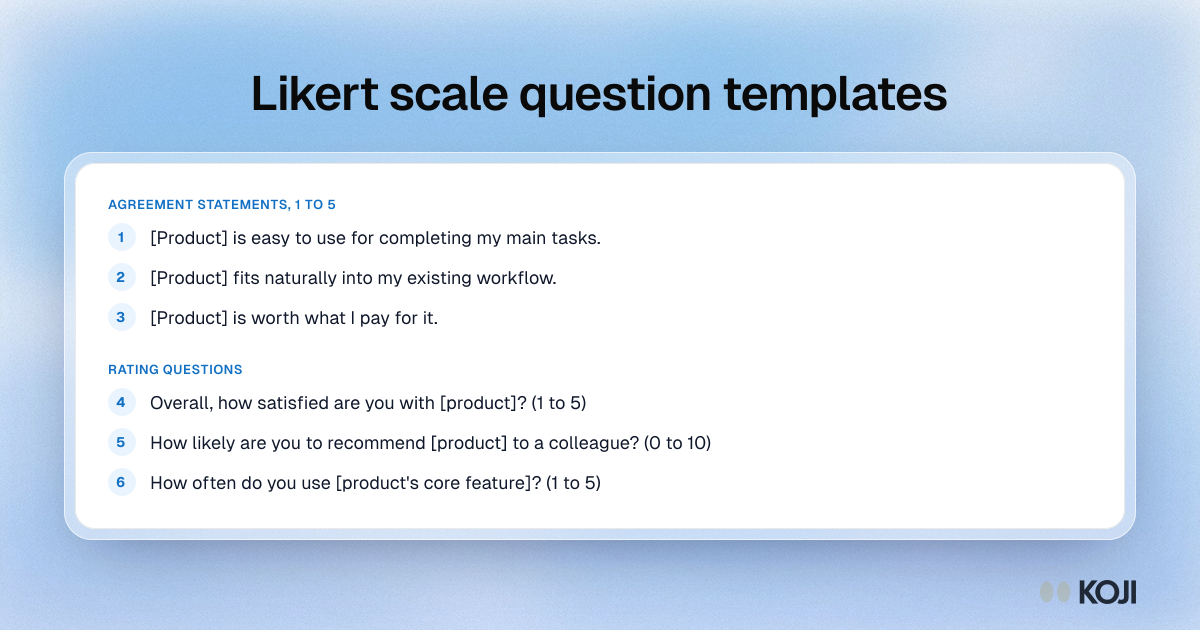
Question bank of six Likert scale templates: three agree or disagree statements and three rating questions on satisfaction, recommendation and frequency.

Question bank

Likert scale question templates
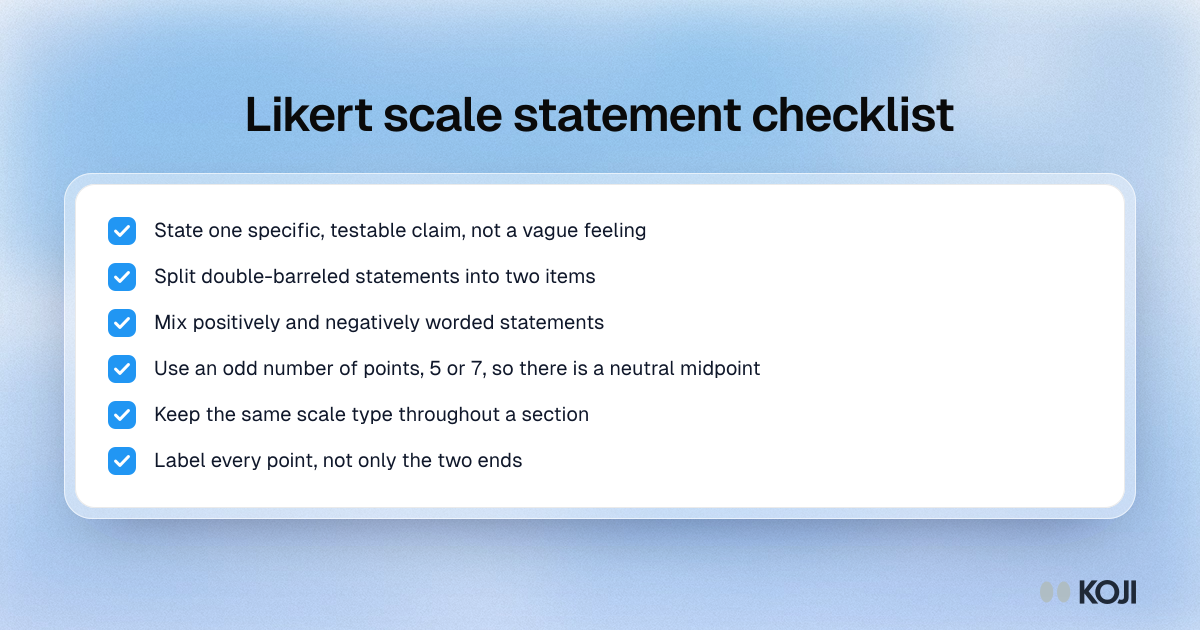
Checklist for writing Likert scale statements: one specific claim, no double-barreled items, mixed wording, an odd number of points and every point labelled.

Checklist

Likert scale statement checklist
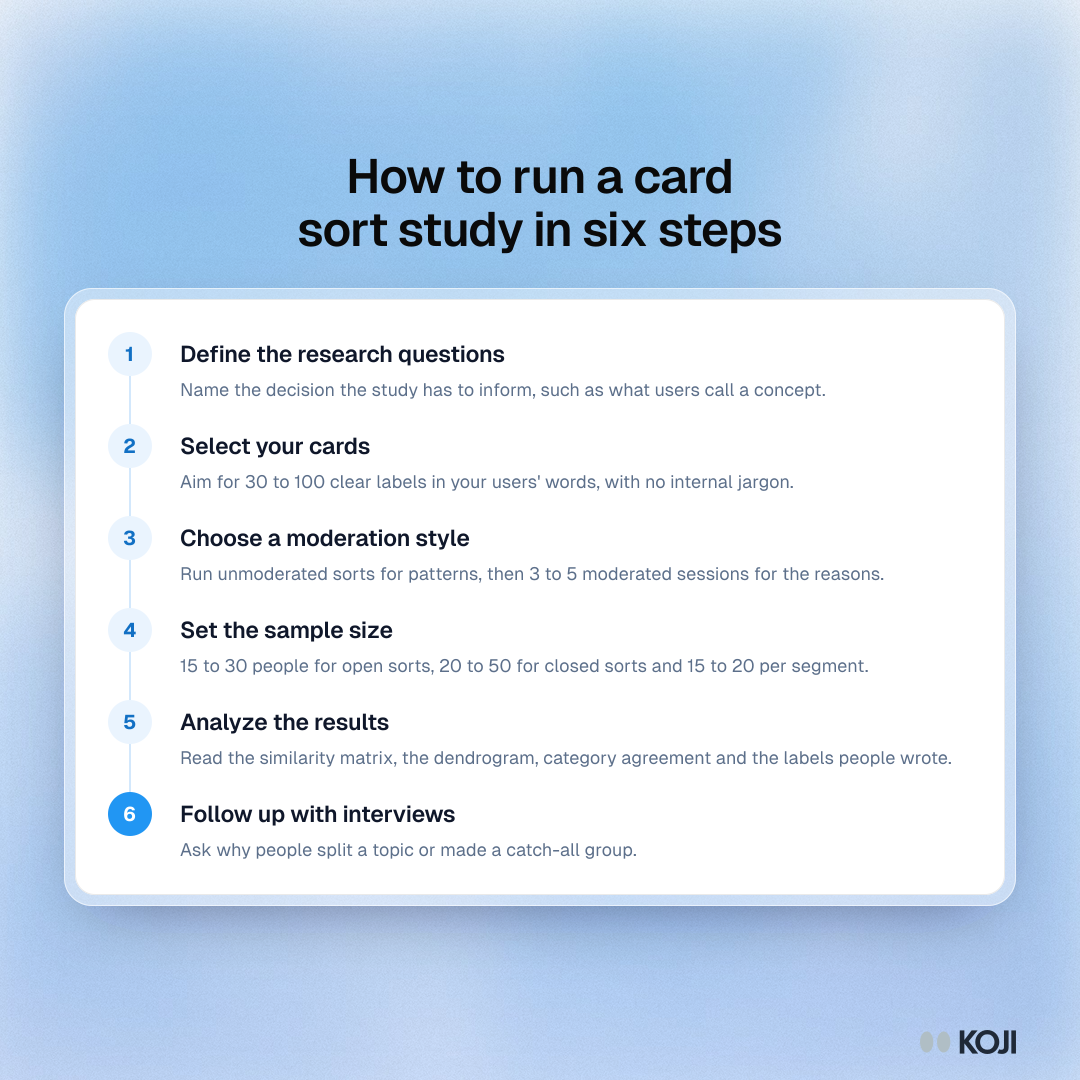
Process showing six steps of a card sort study: research questions, cards, moderation style, sample size, analysis and follow-up interviews.

Process

How to run a card sort study in six steps
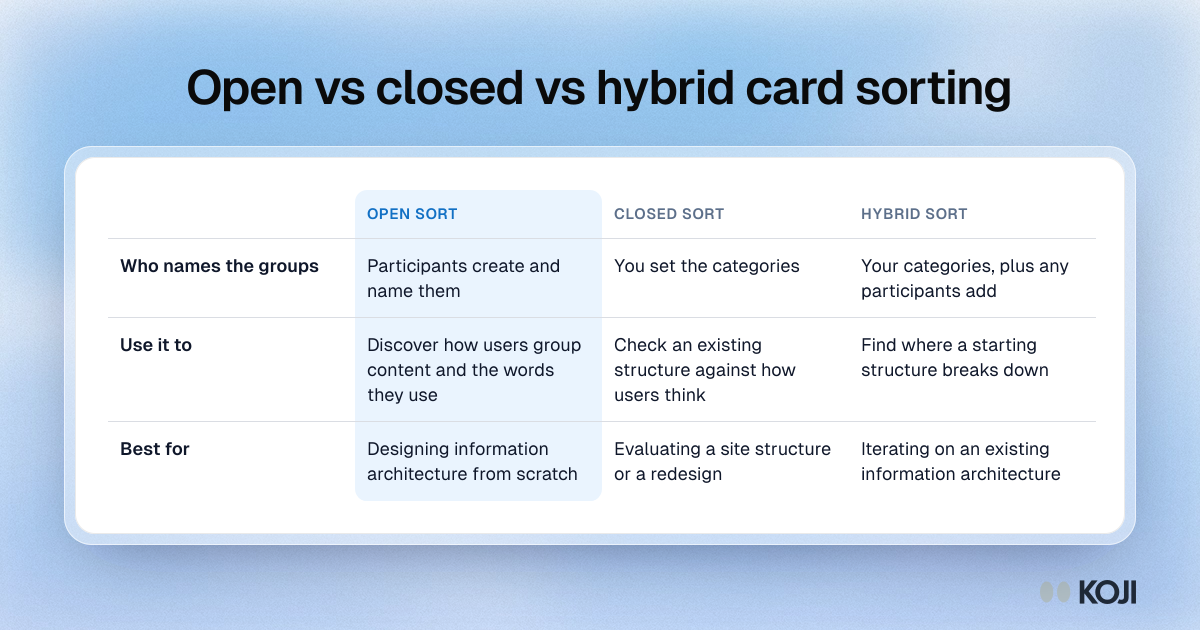
Table comparing open, closed and hybrid card sorting by who names the groups, what each is for and when to use it.

Reference table

Open vs closed vs hybrid card sorting
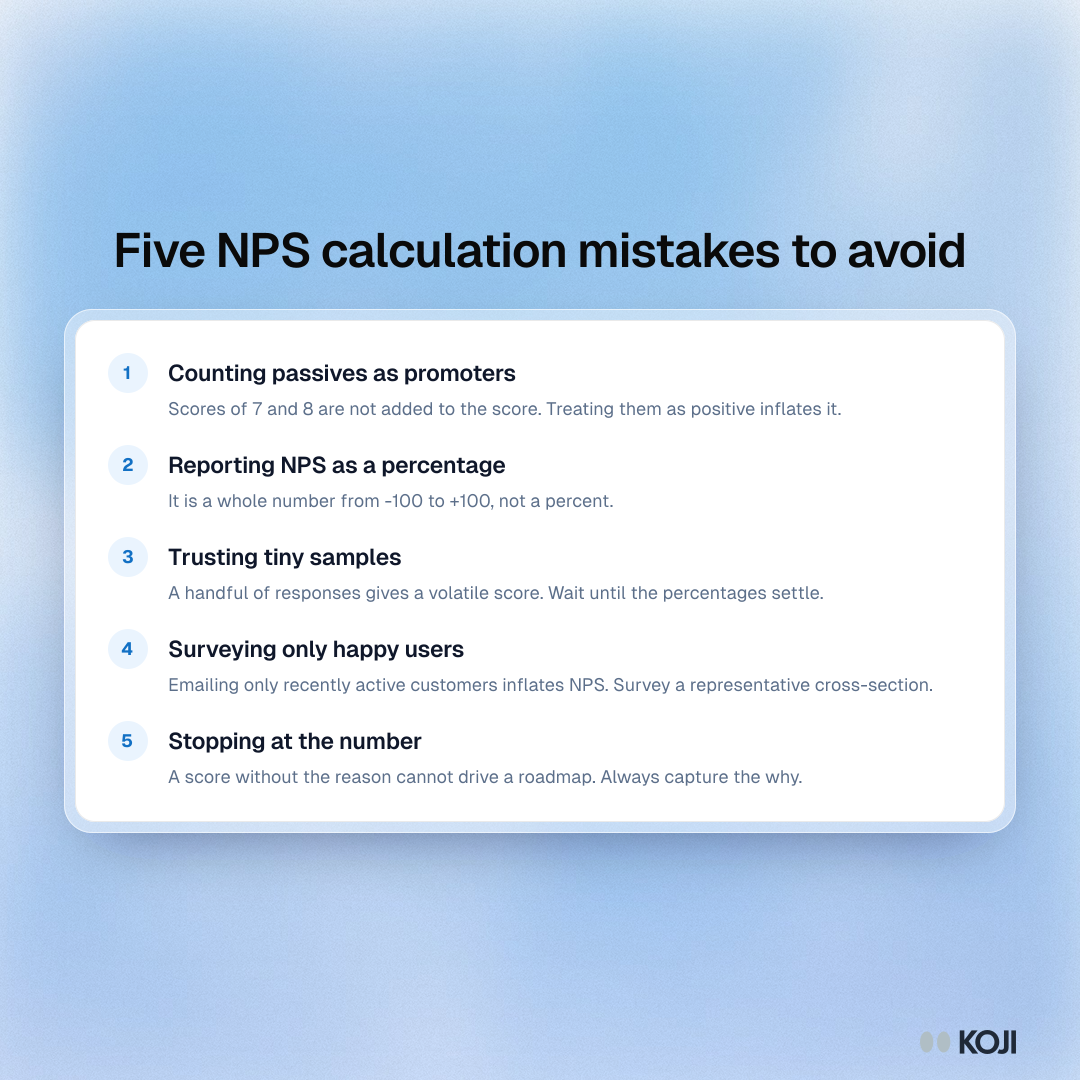
List of five NPS calculation mistakes: counting passives as promoters, reporting a percentage, tiny samples, surveying only happy users, stopping at the score.

Guide

Five NPS calculation mistakes to avoid
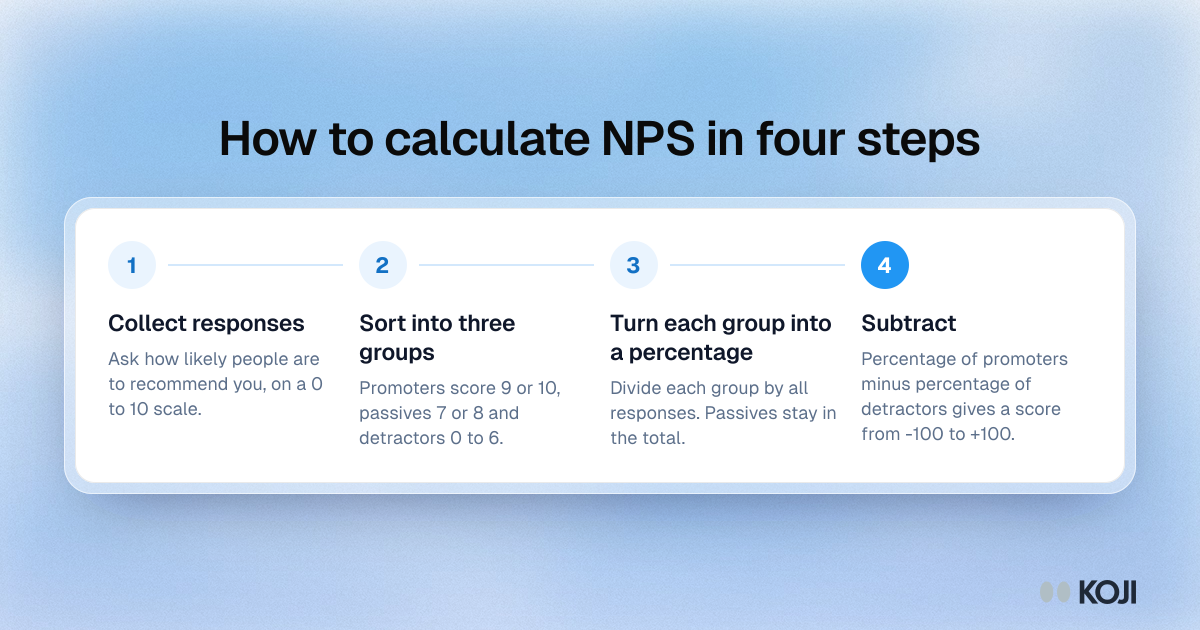
Process showing how to calculate Net Promoter Score: collect 0 to 10 ratings, sort promoters, passives and detractors, convert to percentages, subtract.

Process

How to calculate NPS in four steps
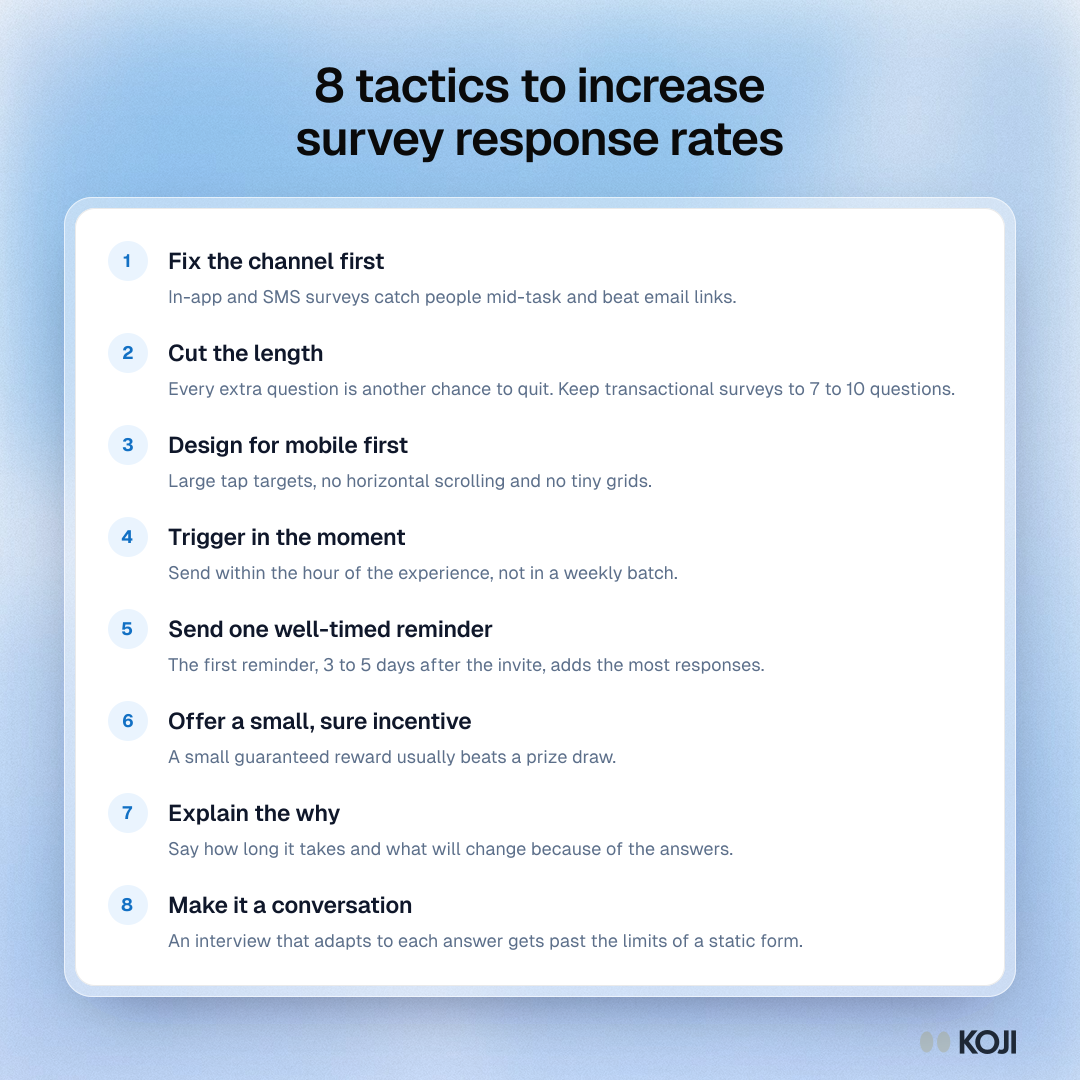
List of eight tactics to raise survey response rates, ranked by impact, from fixing the channel and cutting length to making it a conversation.

Guide

8 tactics to increase survey response rates
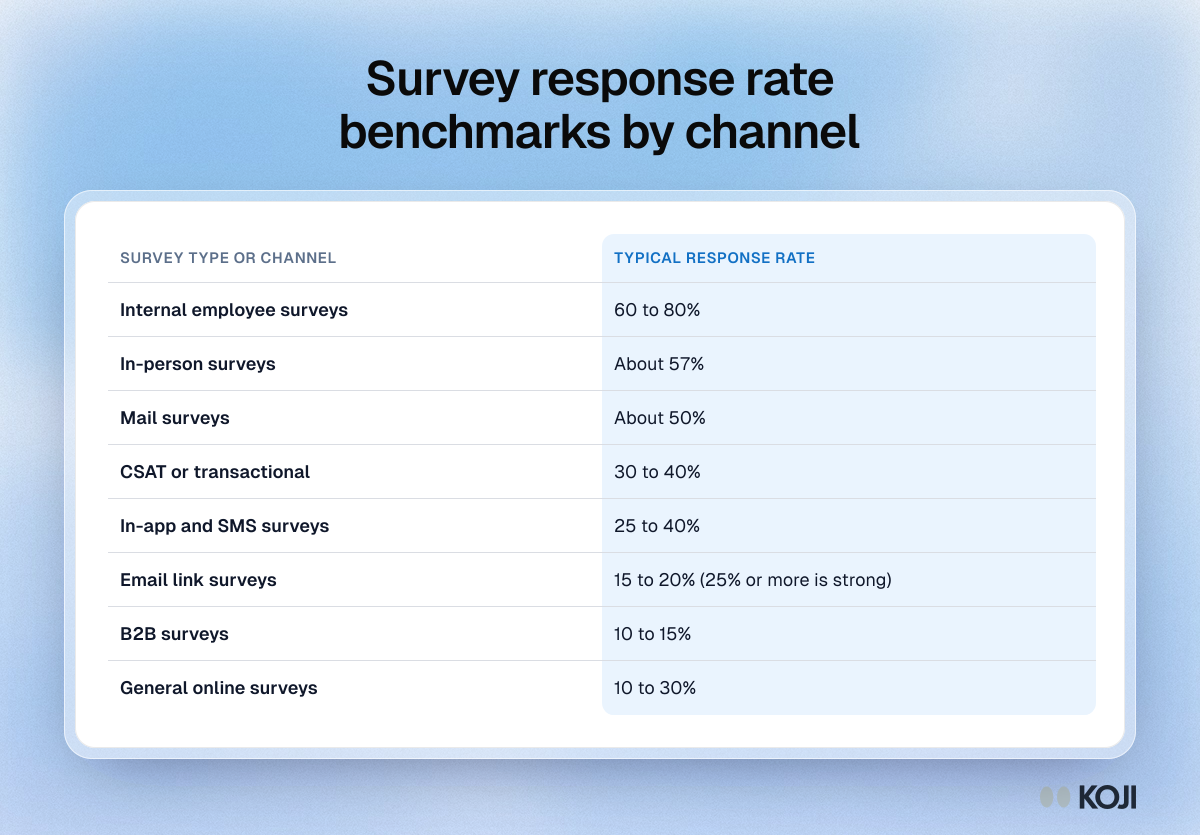
Table of typical survey response rates by channel, from 60 to 80% for employee surveys down to 10 to 15% for B2B surveys.

Reference table

Survey response rate benchmarks by channel
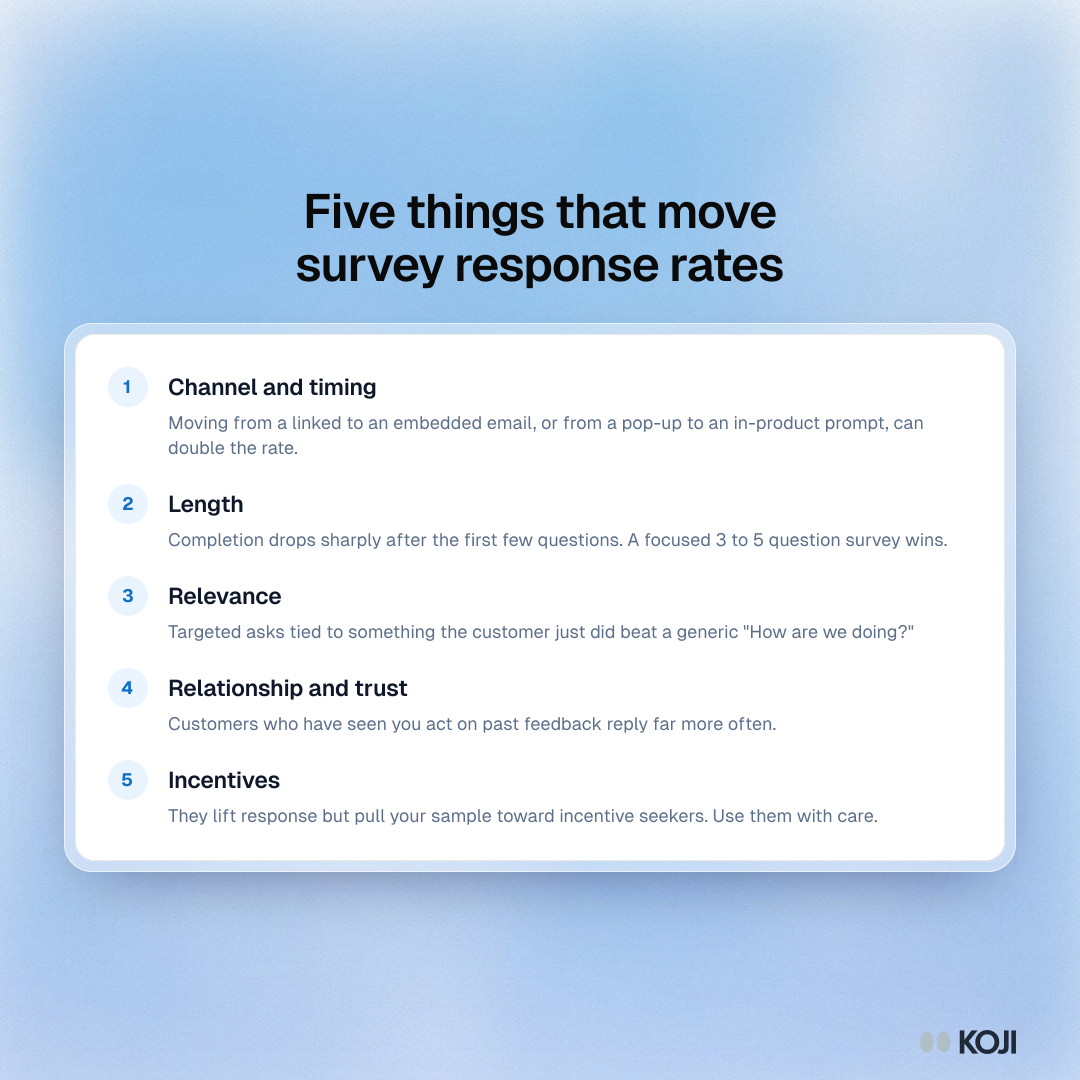
List of five drivers of survey response rates, in rough order of impact: channel and timing, length, relevance, trust and incentives.

Guide

Five things that move survey response rates
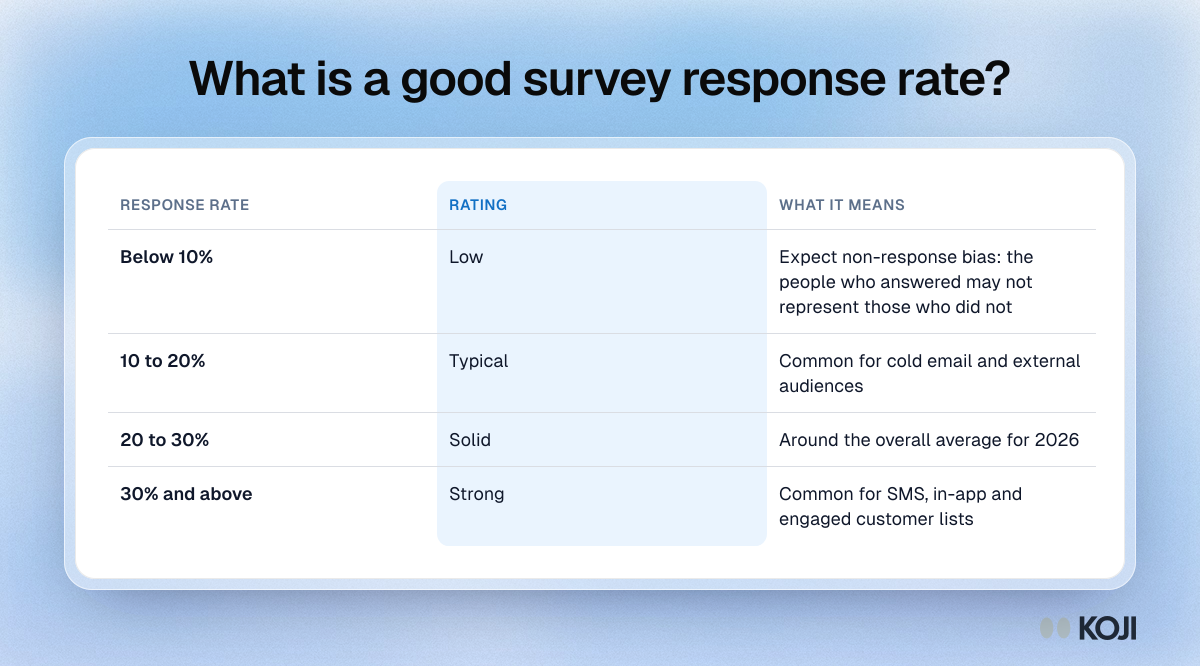
Table rating survey response rates: below 10% is low, 10 to 20% typical, 20 to 30% solid and 30% or more strong, with what each band means.

Reference table

What is a good survey response rate?
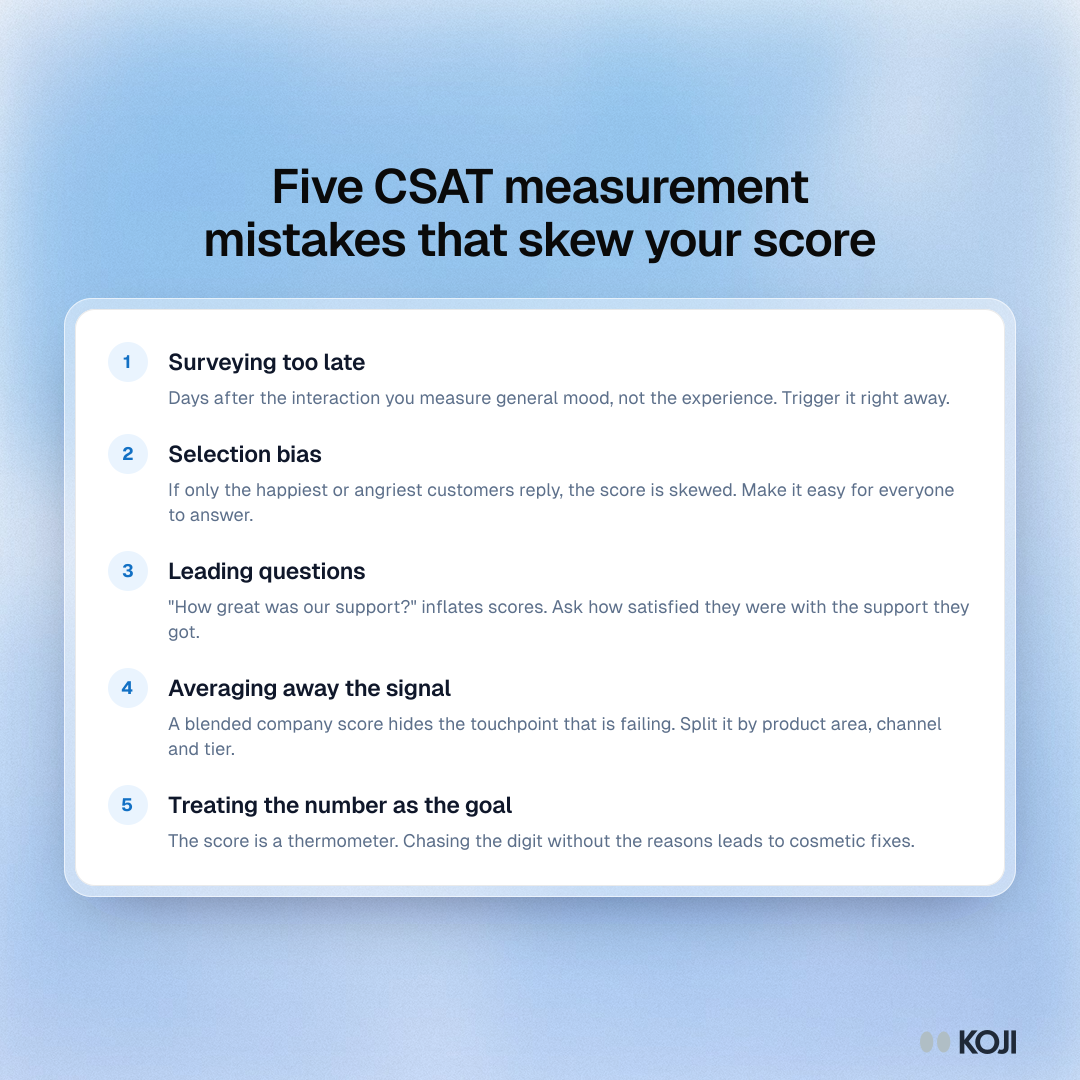
List of five CSAT measurement mistakes: surveying too late, selection bias, leading questions, averaging away the signal and chasing the number.

Guide

Five CSAT measurement mistakes that skew your score
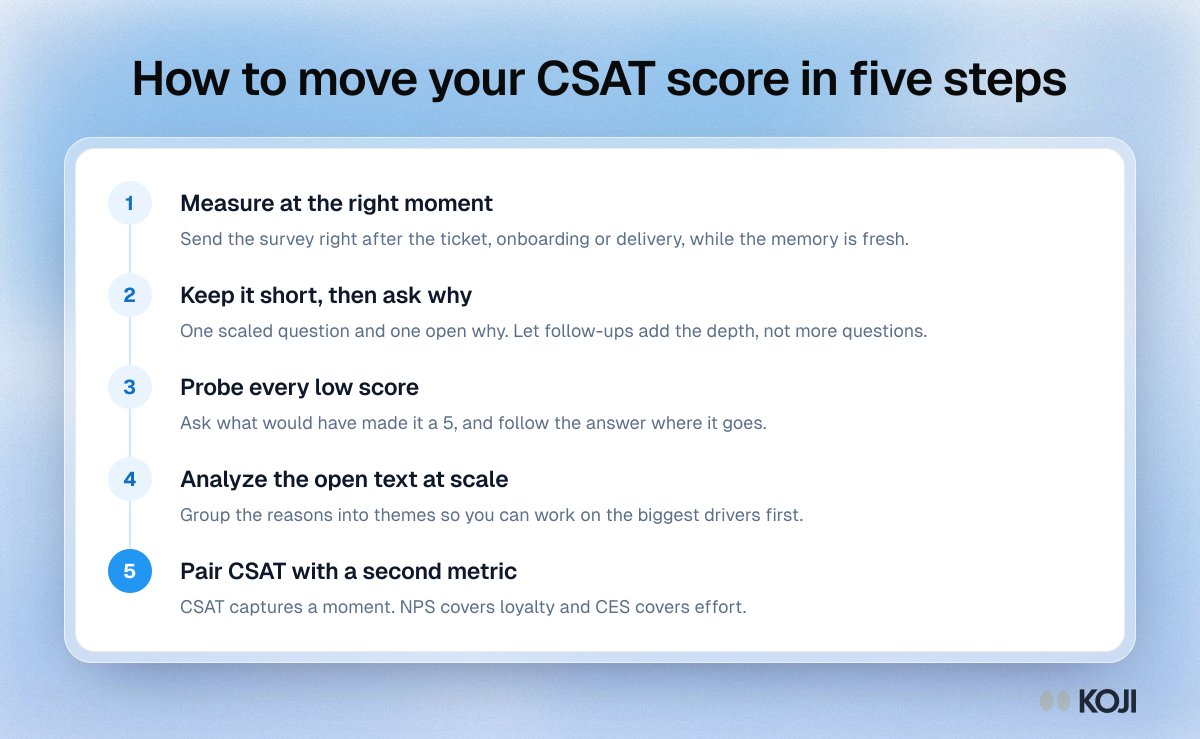
Process showing five steps to raise a CSAT score: time the survey well, keep it short, probe low scores, analyze open text, add NPS or CES.

Process

How to move your CSAT score in five steps
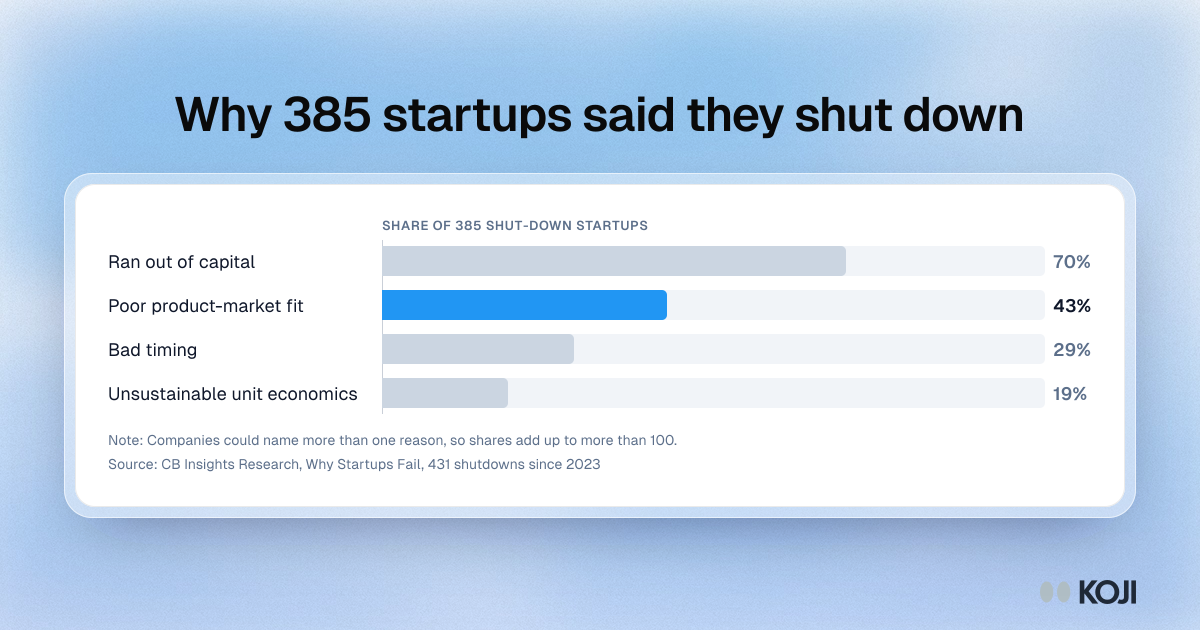
Bar chart of reasons 385 shut-down startups gave: ran out of capital 70 percent, poor product-market fit 43, bad timing 29, weak unit economics 19.

Bar chart

Why 385 startups said they shut down
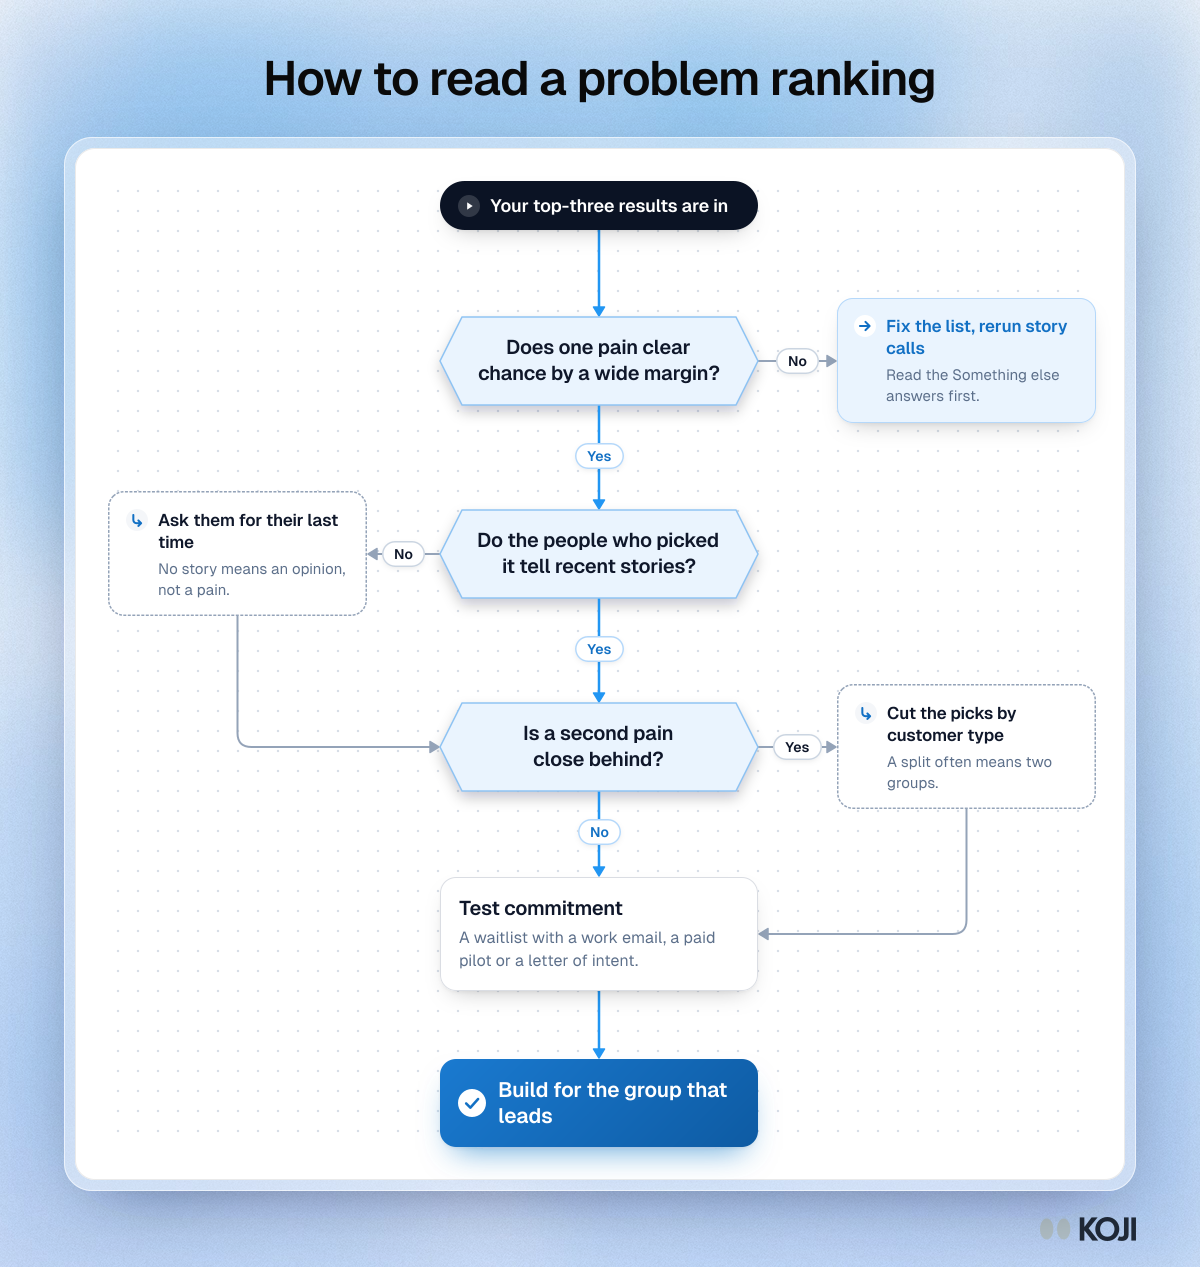
Flowchart for reading a top-three problem ranking: compare with chance, check the stories, split close results by customer type, then test commitment.

Flowchart

How to read a problem ranking
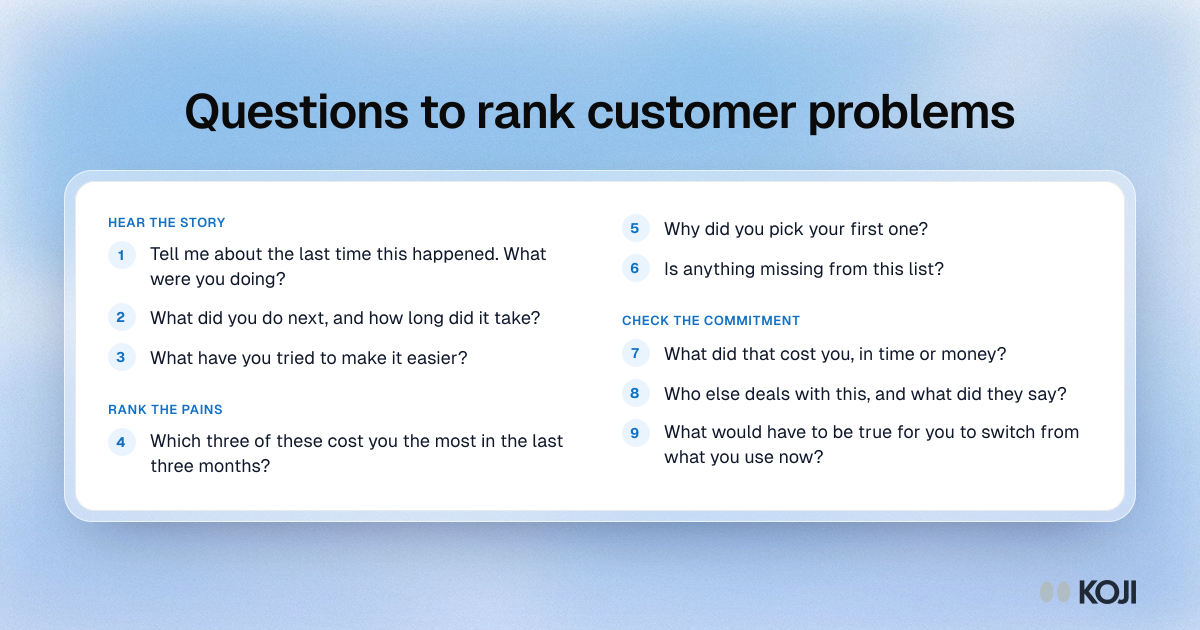
Question bank with nine questions in three parts for ranking customer problems: hear the story, rank the pains, and check the commitment.

Question bank

Questions to rank customer problems
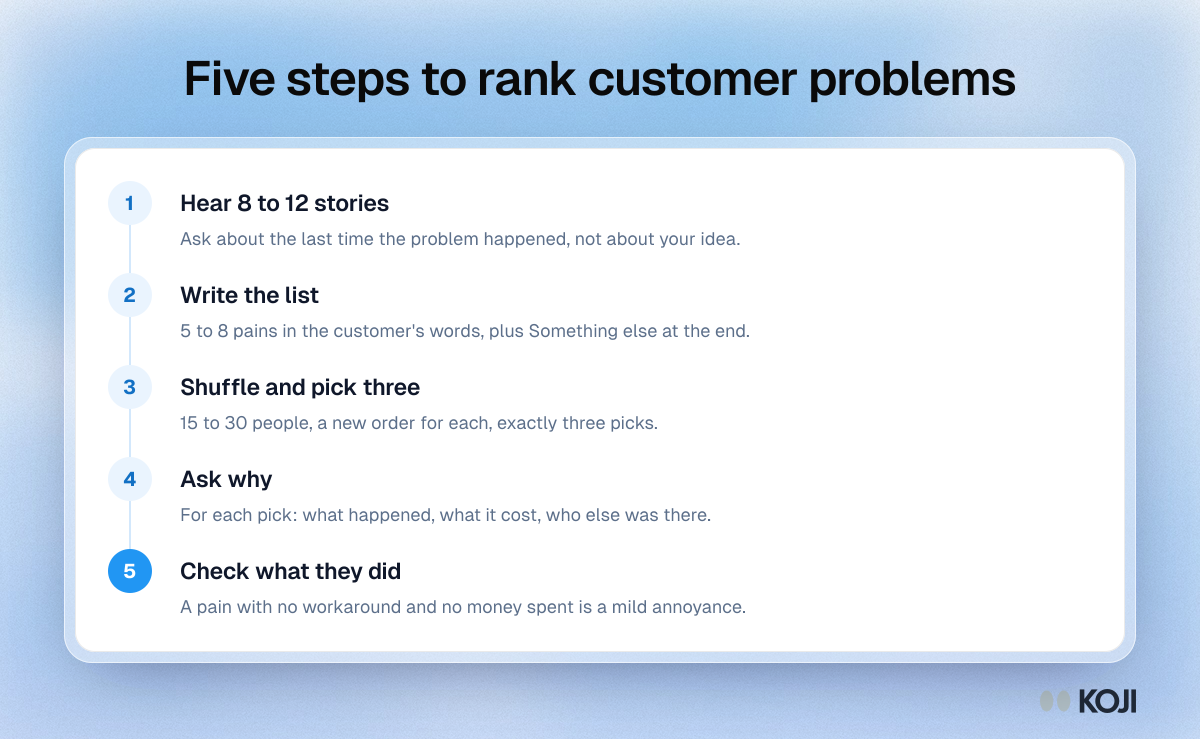
Process of five steps to rank customer problems: hear stories, write the list, shuffle and pick three, ask why, and check what people did about it.

Process

Five steps to rank customer problems
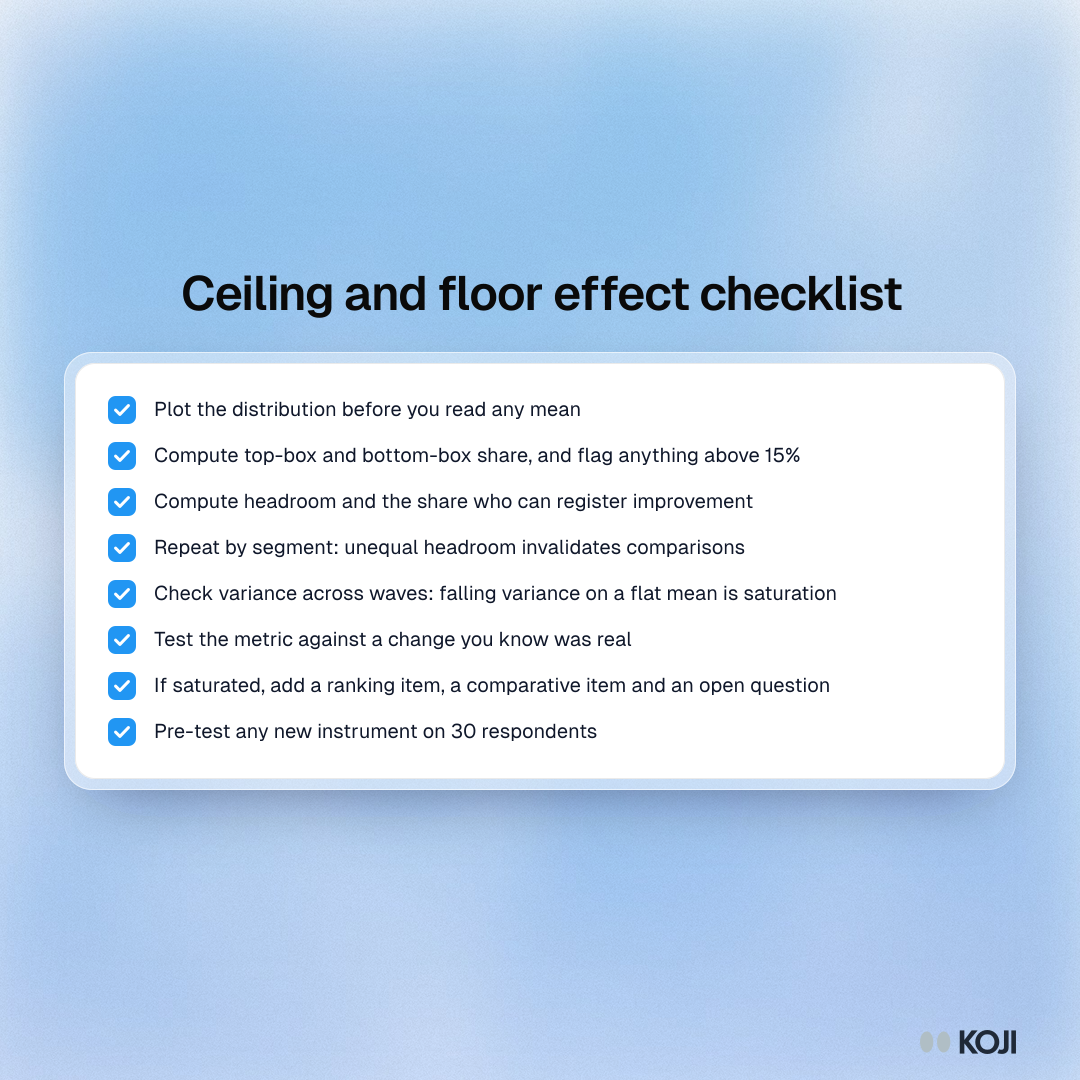
Checklist of eight checks for ceiling and floor effects, from plotting the distribution and top-box share to pre-testing a new instrument.

Checklist

Ceiling and floor effect checklist
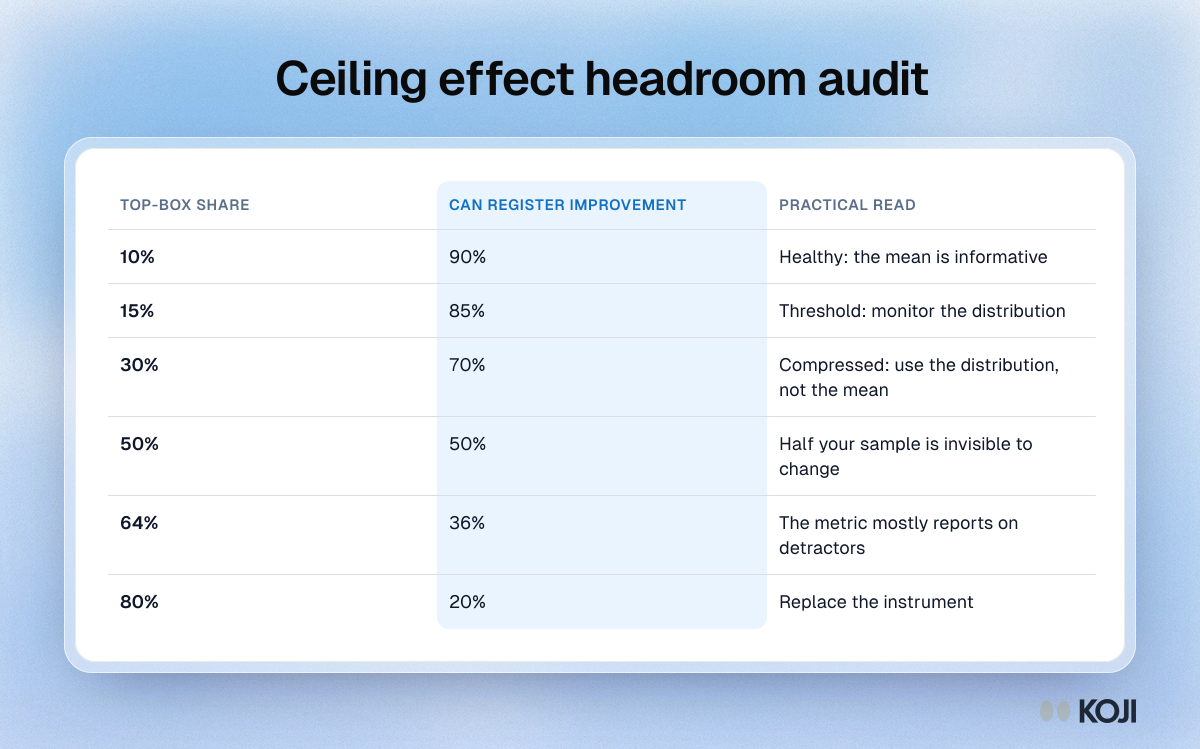
Table of top-box shares from 10% to 80% against the share of respondents who can still register improvement, with what each means.

Reference table

Ceiling effect headroom audit
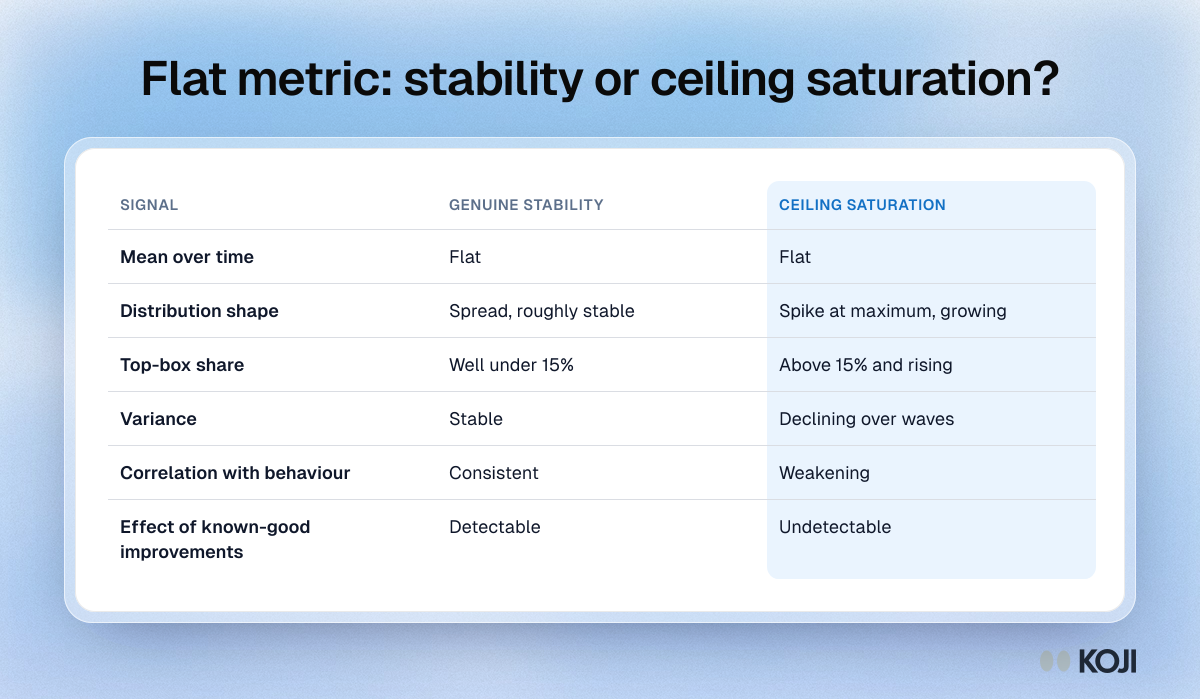
Table comparing six signals of genuine stability against ceiling saturation in a flat survey metric, from distribution shape to variance over waves.

Reference table

Flat metric: stability or ceiling saturation?
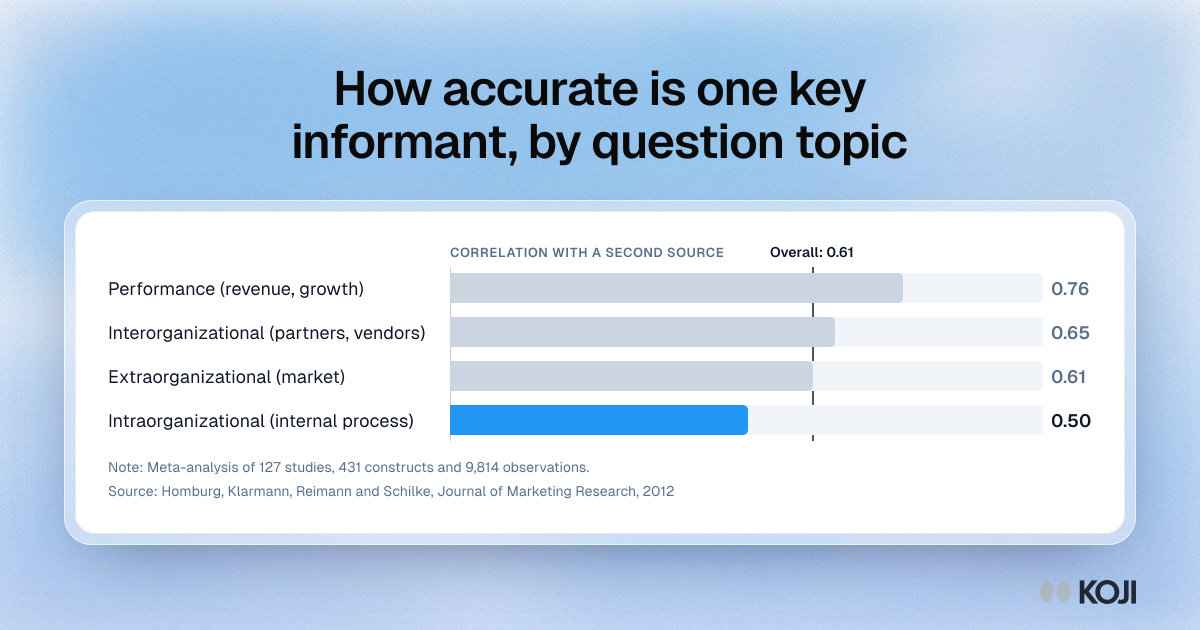
Bar chart of key informant accuracy: correlation with a second source is .764 for performance questions but only .502 for internal process questions.

Bar chart

How accurate is one key informant, by question topic
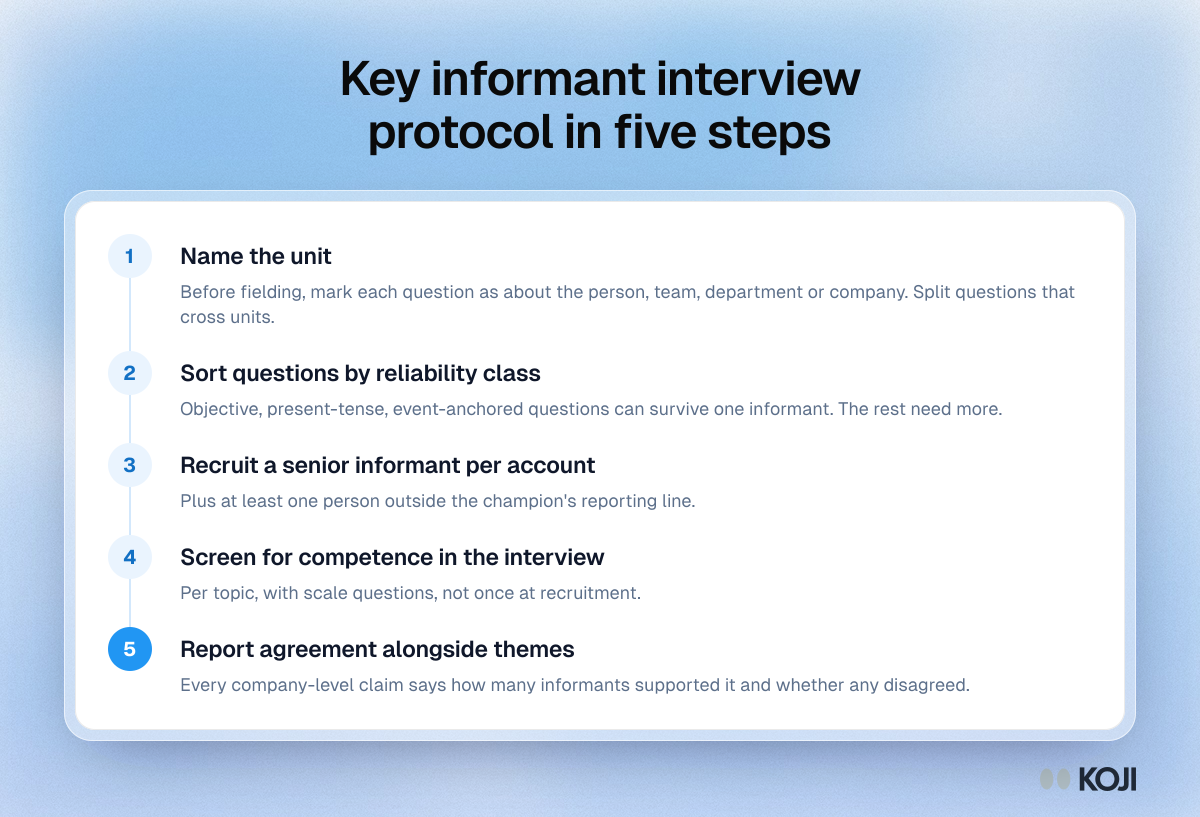
Process of five steps for key informant research, from naming the unit each question is about to reporting agreement between informants.

Process

Key informant interview protocol in five steps
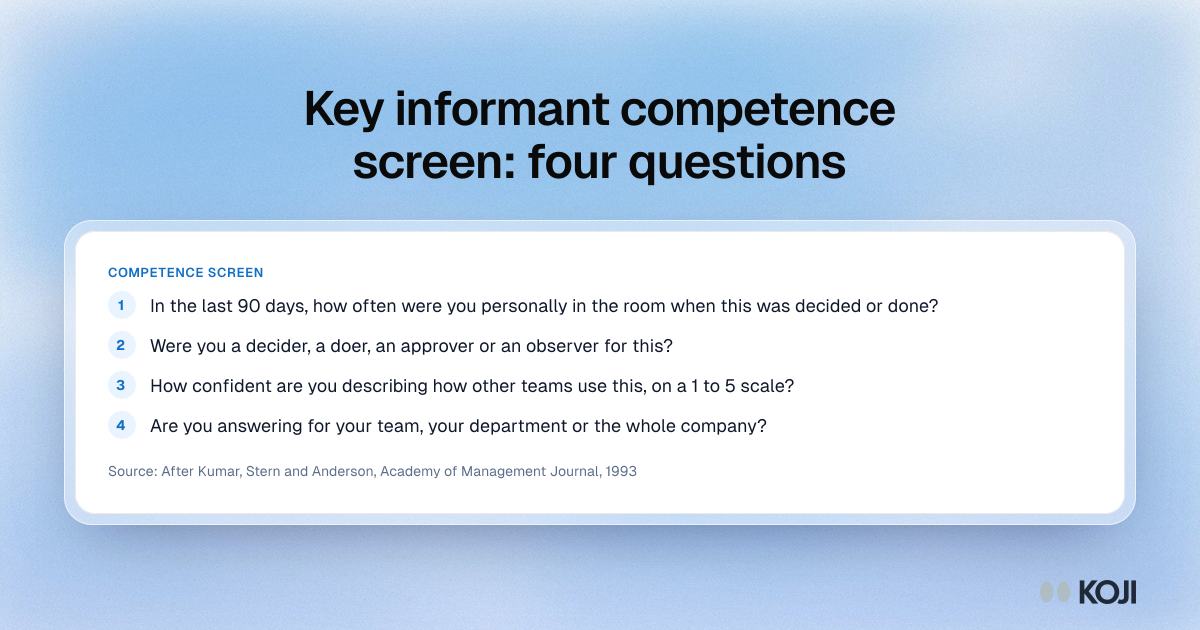
Question bank of four competence screen questions for key informant interviews: proximity, role, confidence per topic and scope.

Question bank

Key informant competence screen: four questions
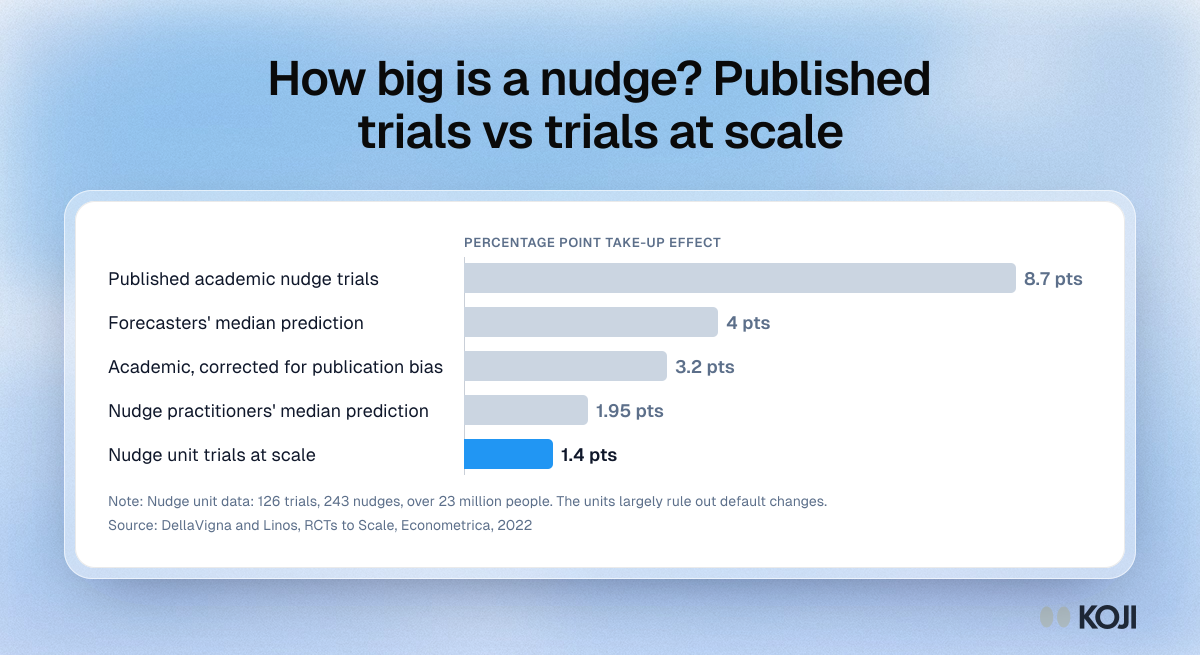
Bar chart of nudge effect sizes: 8.7 points in published academic trials against 1.4 points in 126 nudge unit trials run at scale.

Bar chart

How big is a nudge? Published trials vs trials at scale
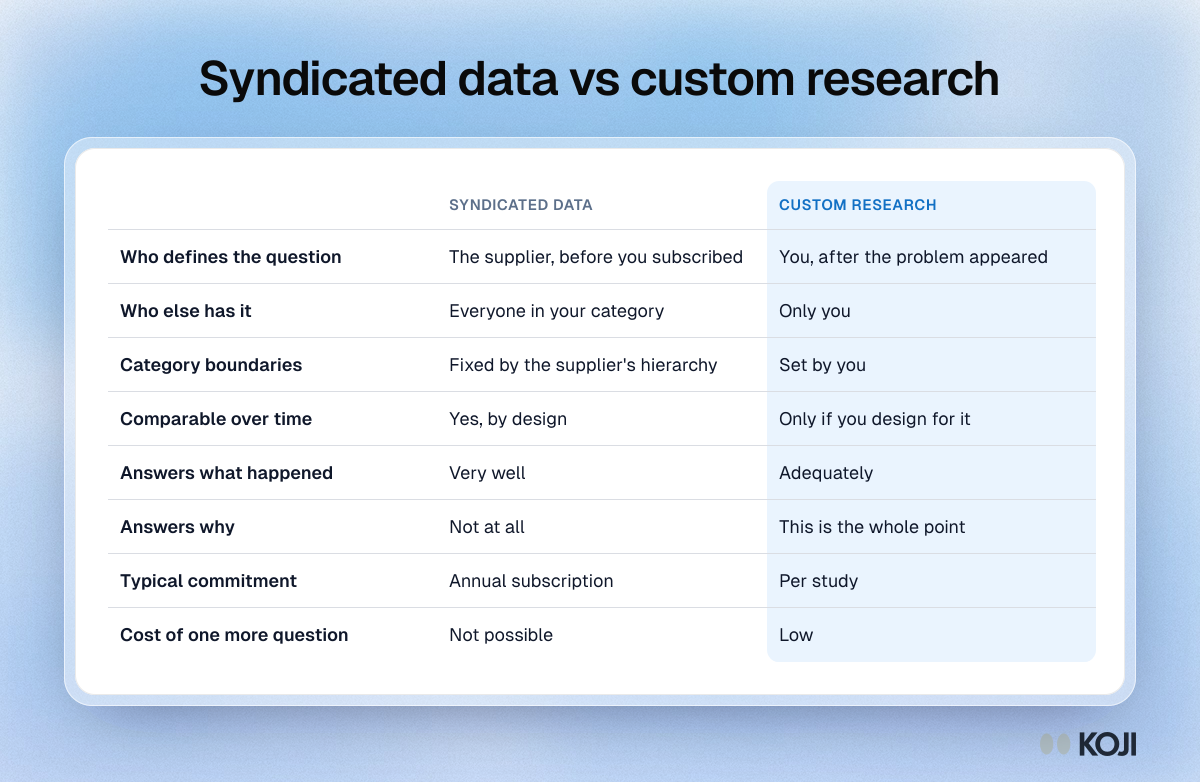
Table comparing syndicated data and custom research on eight points, including who defines the question, who else has it and whether it answers why.

Reference table

Syndicated data vs custom research
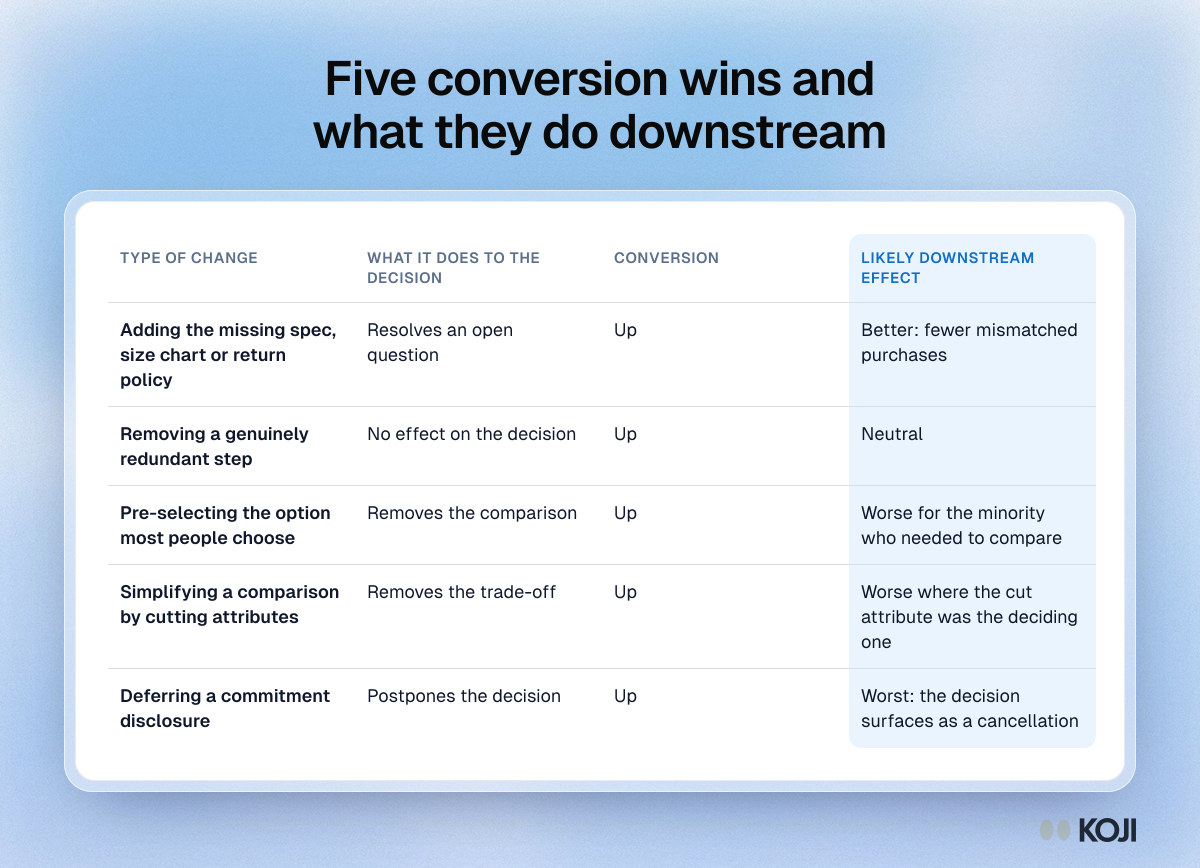
Table of five design changes that all raise conversion, from adding a missing spec to deferring a commitment disclosure, and their downstream effect.

Reference table

Five conversion wins and what they do downstream
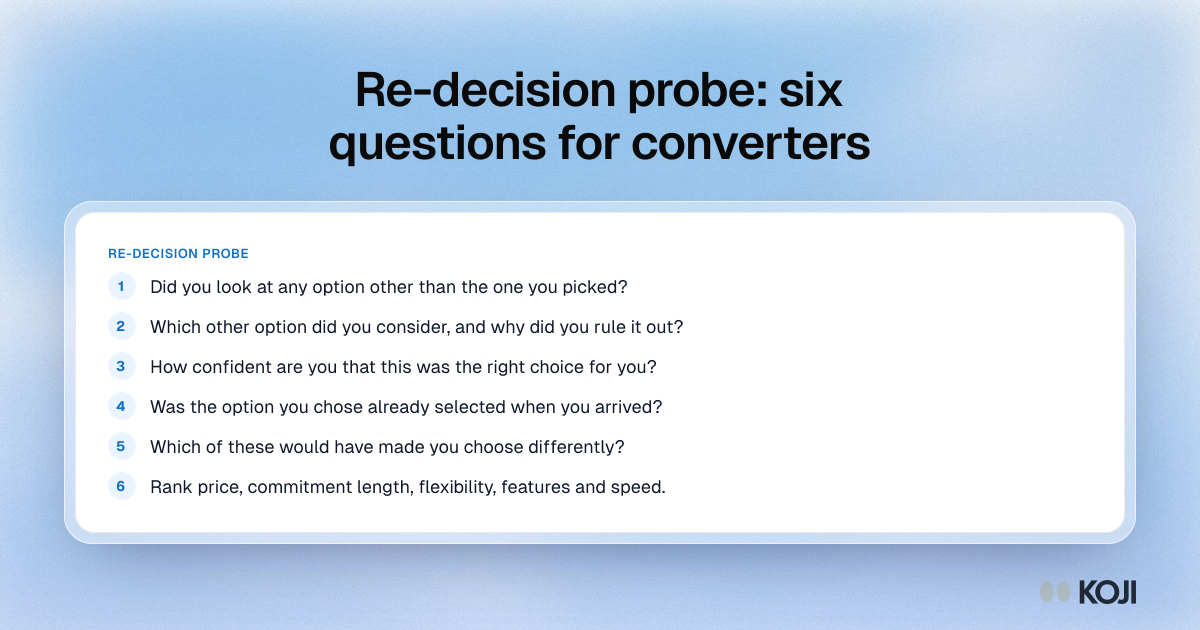
Question bank of six re-decision probe questions that test whether converters compared options or accepted a default.

Question bank

Re-decision probe: six questions for converters
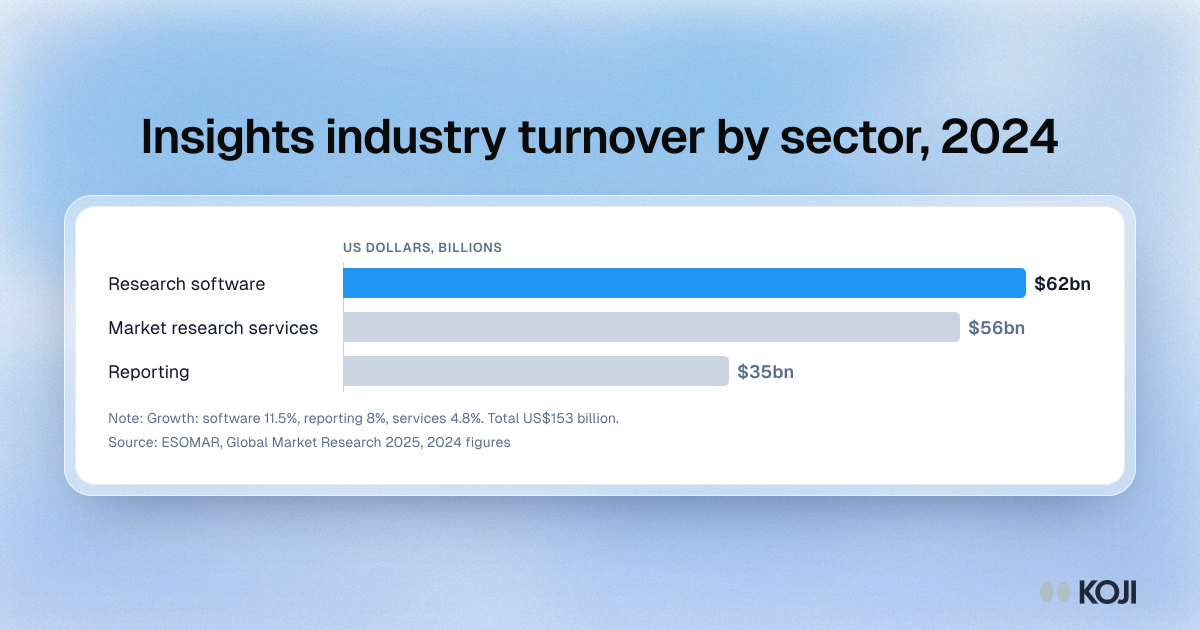
Bar chart of the 153 billion dollar insights industry: research software 62 billion, market research services 56 billion, reporting 35 billion.

Bar chart

Insights industry turnover by sector, 2024
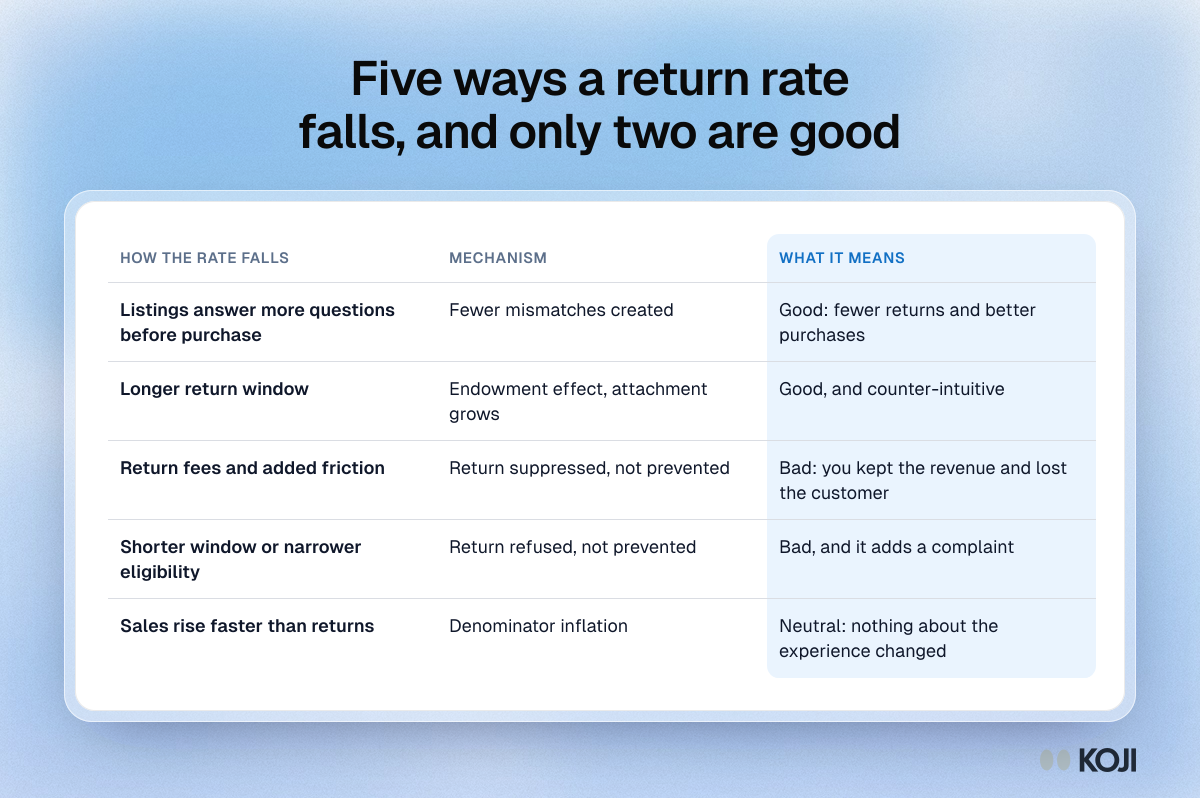
Table of five ways a retail return rate can fall, from better listings and longer windows to return fees, shorter windows and sales growth.

Reference table

Five ways a return rate falls, and only two are good
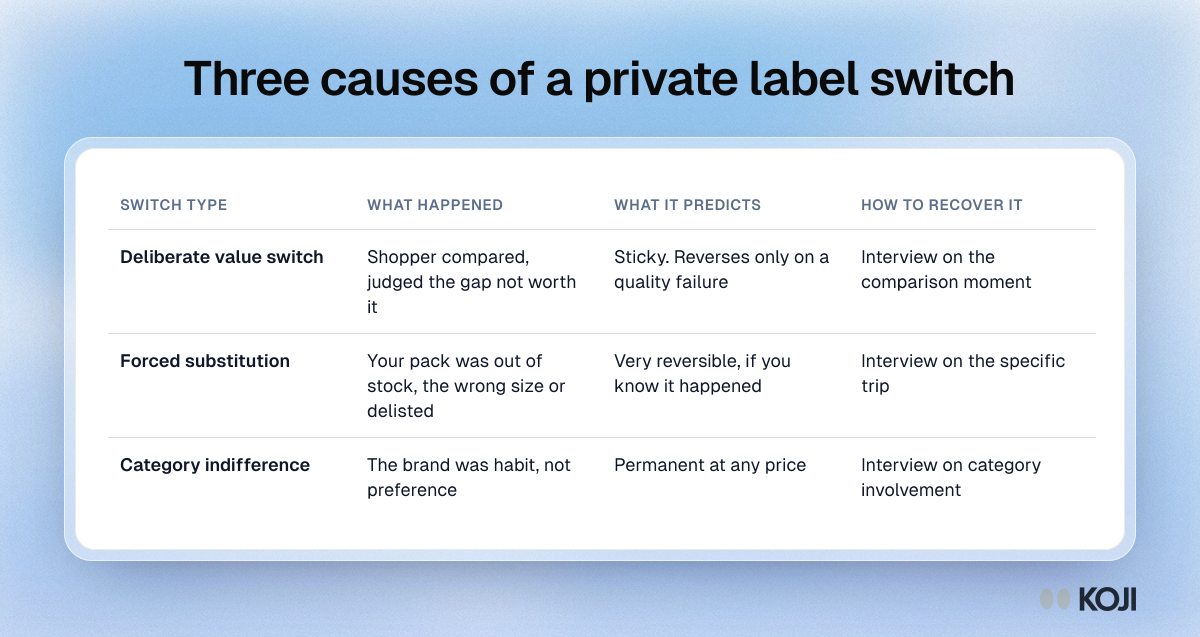
Table of three types of private label switch: deliberate value switch, forced substitution and category indifference, with what each predicts.

Reference table

Three causes of a private label switch