Free to save and share

Frameworks and cheat sheets for customer research

Every framework, checklist and comparison from our guides, as an image you can download, drop into a deck or share with your team.
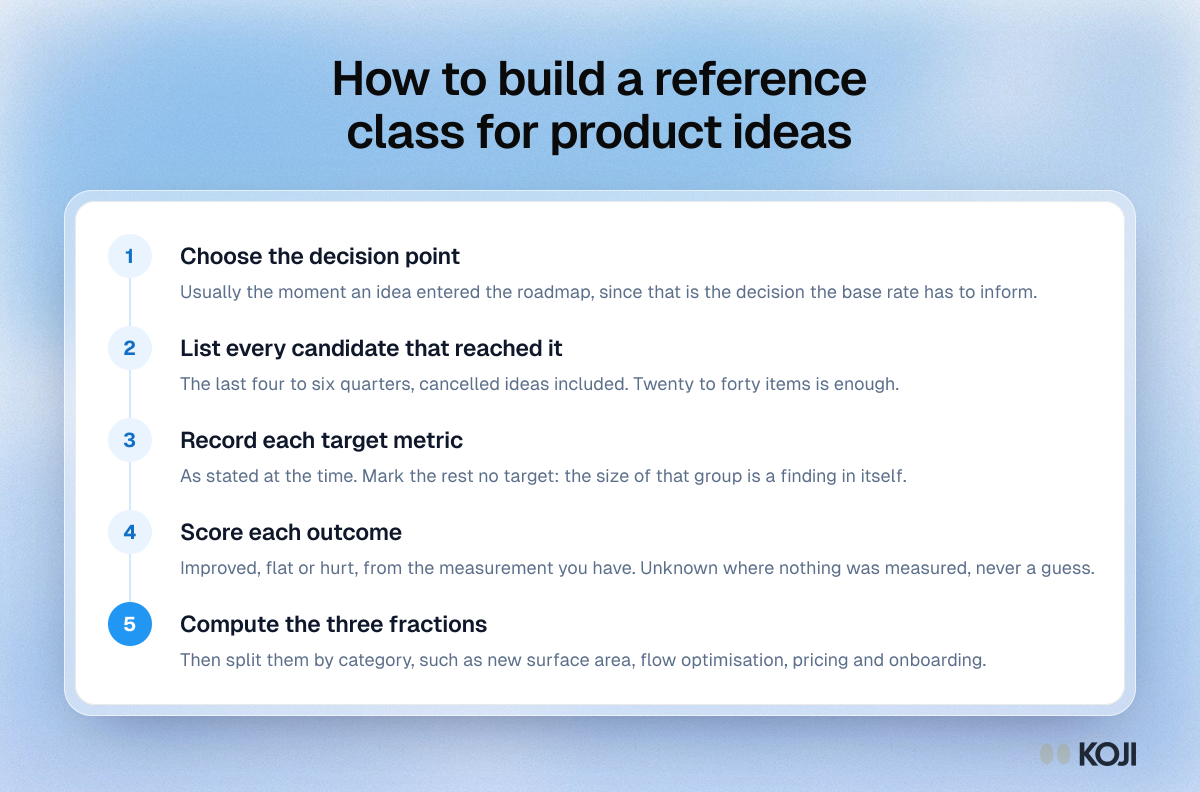
Process in five steps for building a reference class of product ideas: pick the decision point, list candidates, record targets, score outcomes, compute rates.

Process

How to build a reference class for product ideas
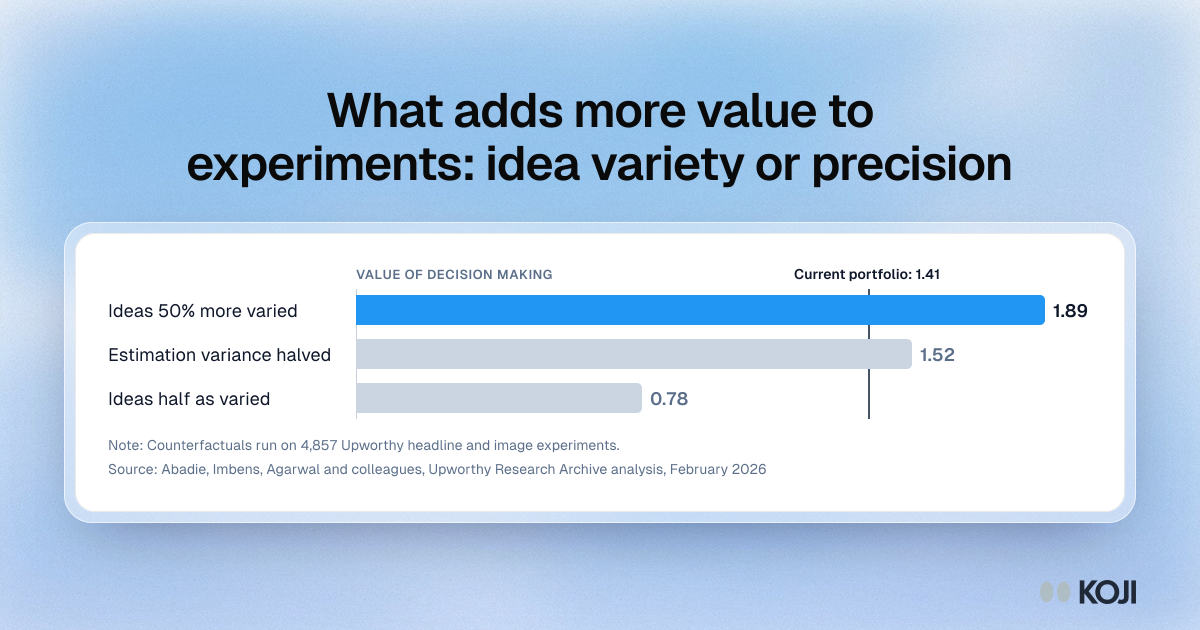
Bar chart from 4,857 Upworthy experiments: 50% more varied ideas raise decision value by 34%, halving variance adds 8%, halving variety cuts it by 44%.

Bar chart

What adds more value to experiments: idea variety or precision
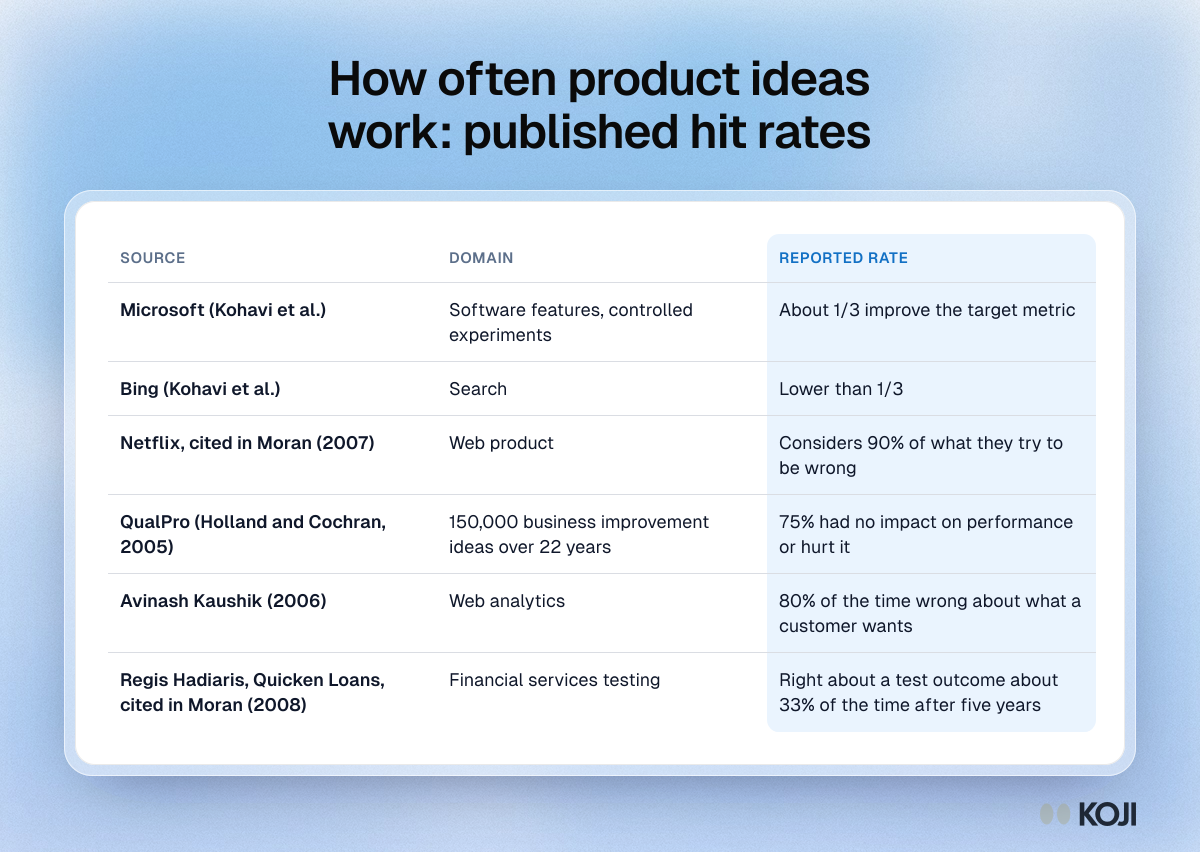
Table of published hit rates for product ideas from Microsoft, Bing, Netflix, QualPro, Avinash Kaushik and Quicken Loans, most near one in three or lower.

Reference table

How often product ideas work: published hit rates
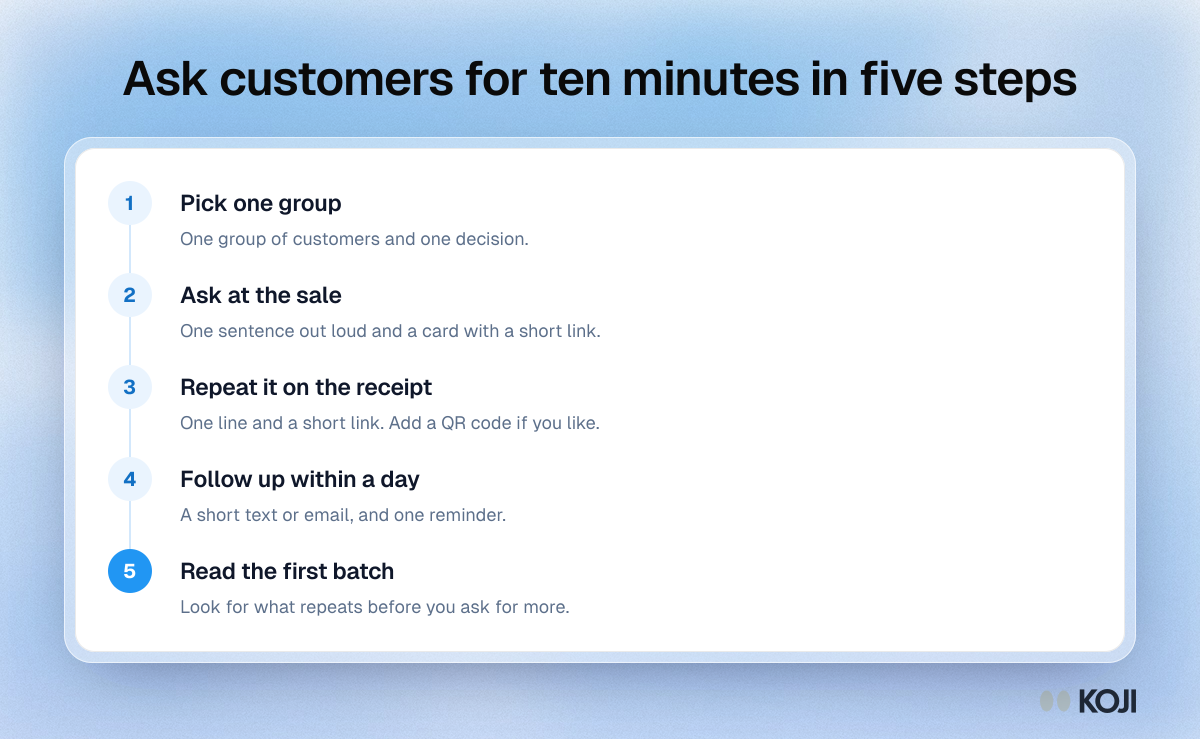
Process of five steps for getting customers to talk to a small business, from picking one group to reading the first batch of answers.

Process

Ask customers for ten minutes in five steps
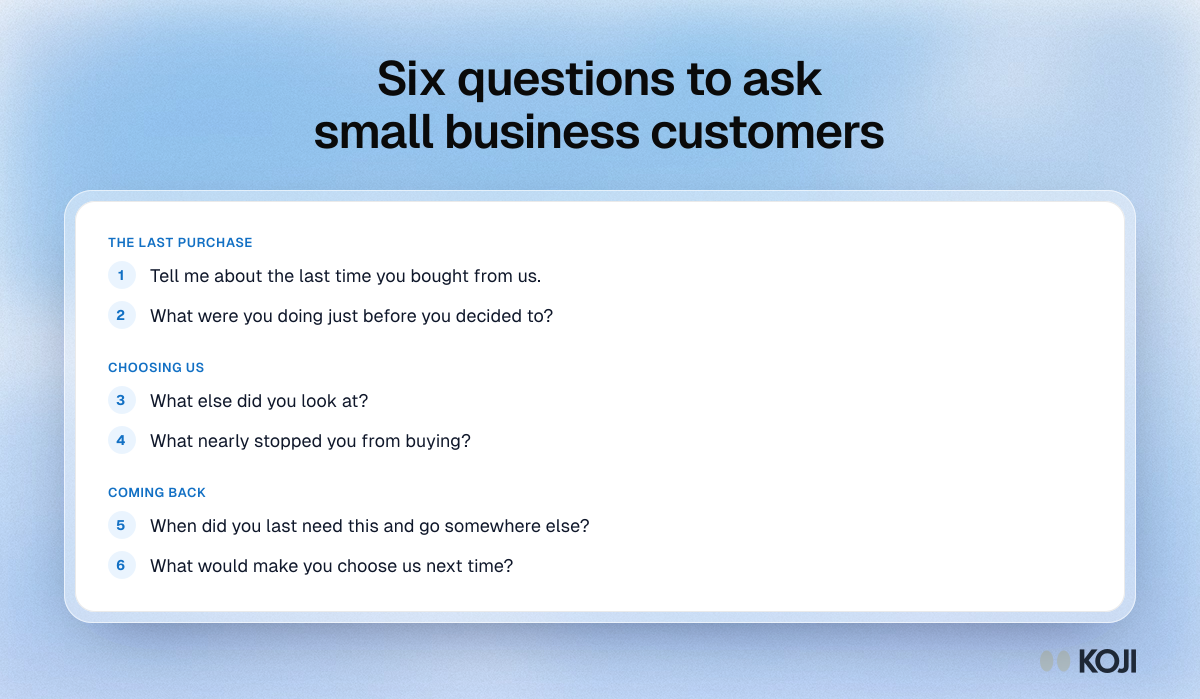
Question bank of six interview questions for small business customers, in three groups: the last purchase, choosing you and coming back.

Question bank

Six questions to ask small business customers
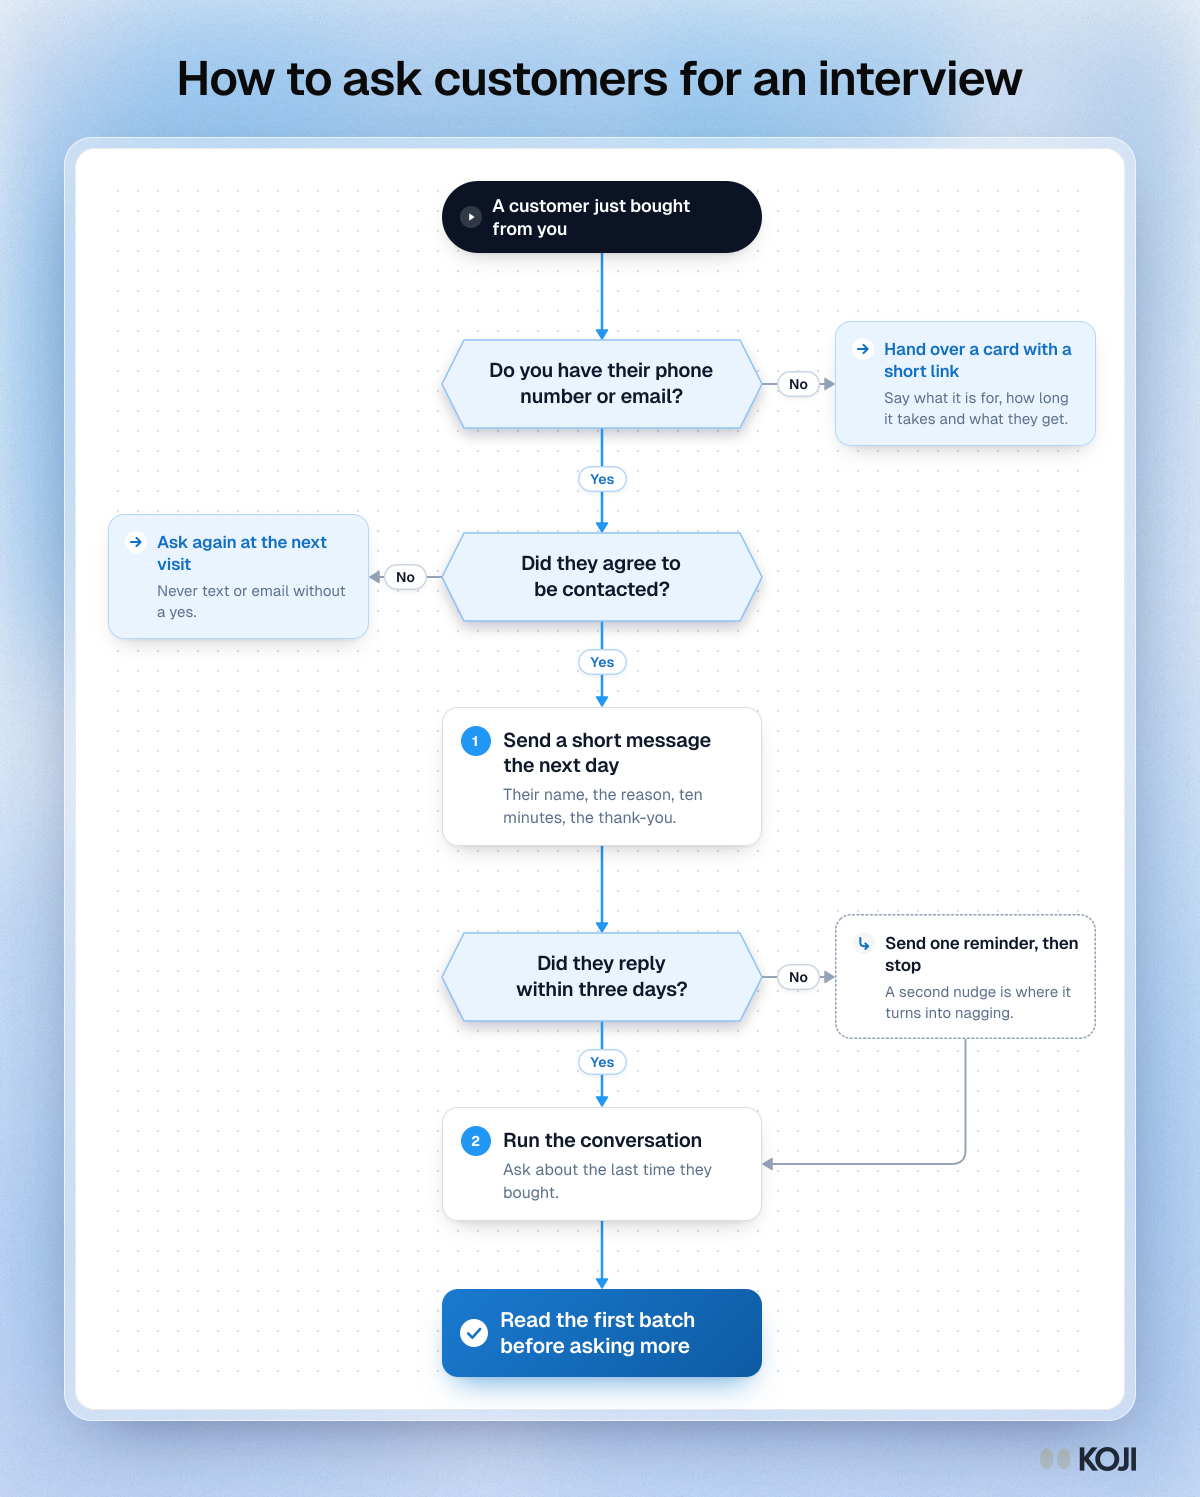
Flowchart for asking a customer for an interview: three questions and one reminder step, ending with reading the first batch of answers.

Flowchart

How to ask customers for an interview
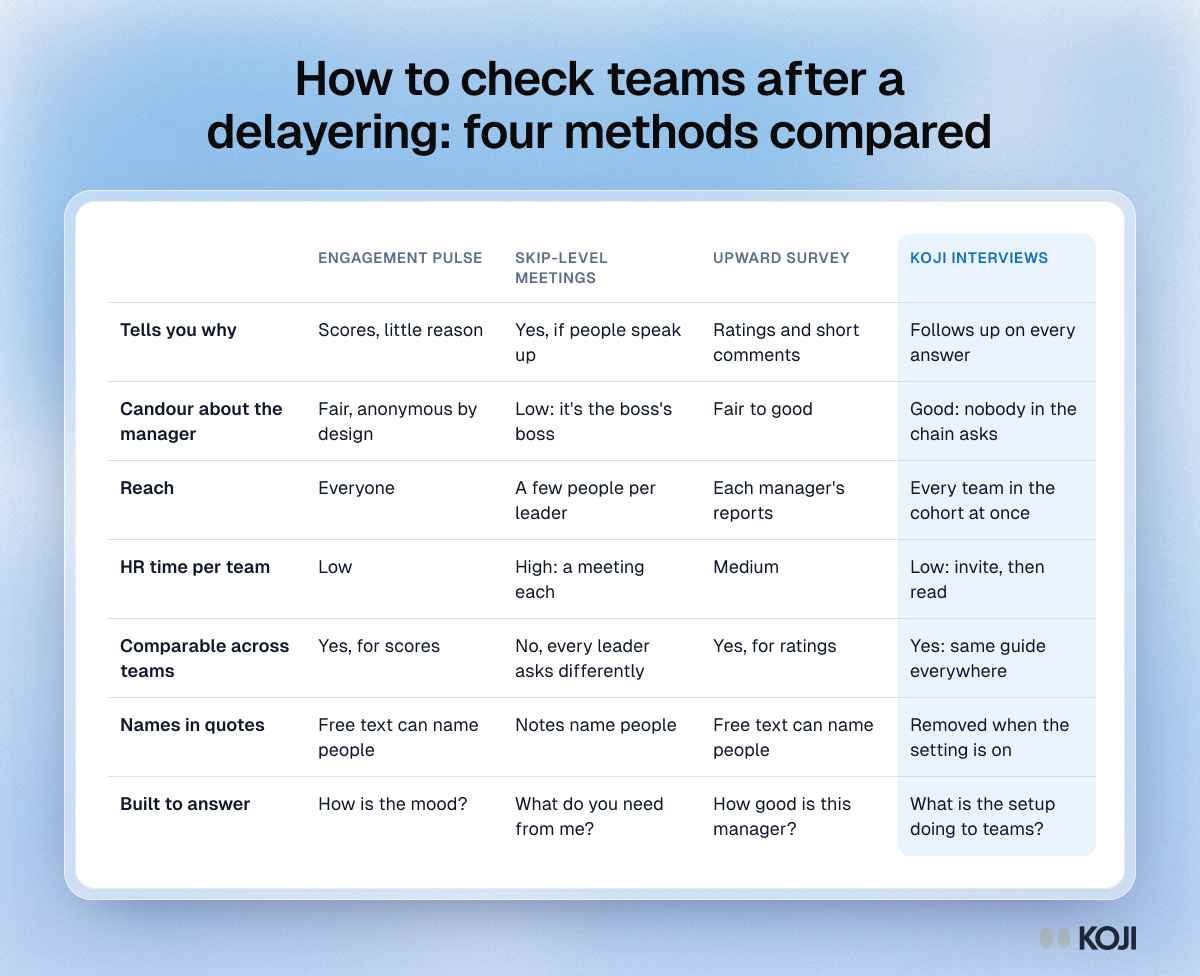
Table comparing an engagement pulse, skip-level meetings, an upward feedback survey and Koji for checking teams after a delayering

Reference table

How to check teams after a delayering: four methods compared
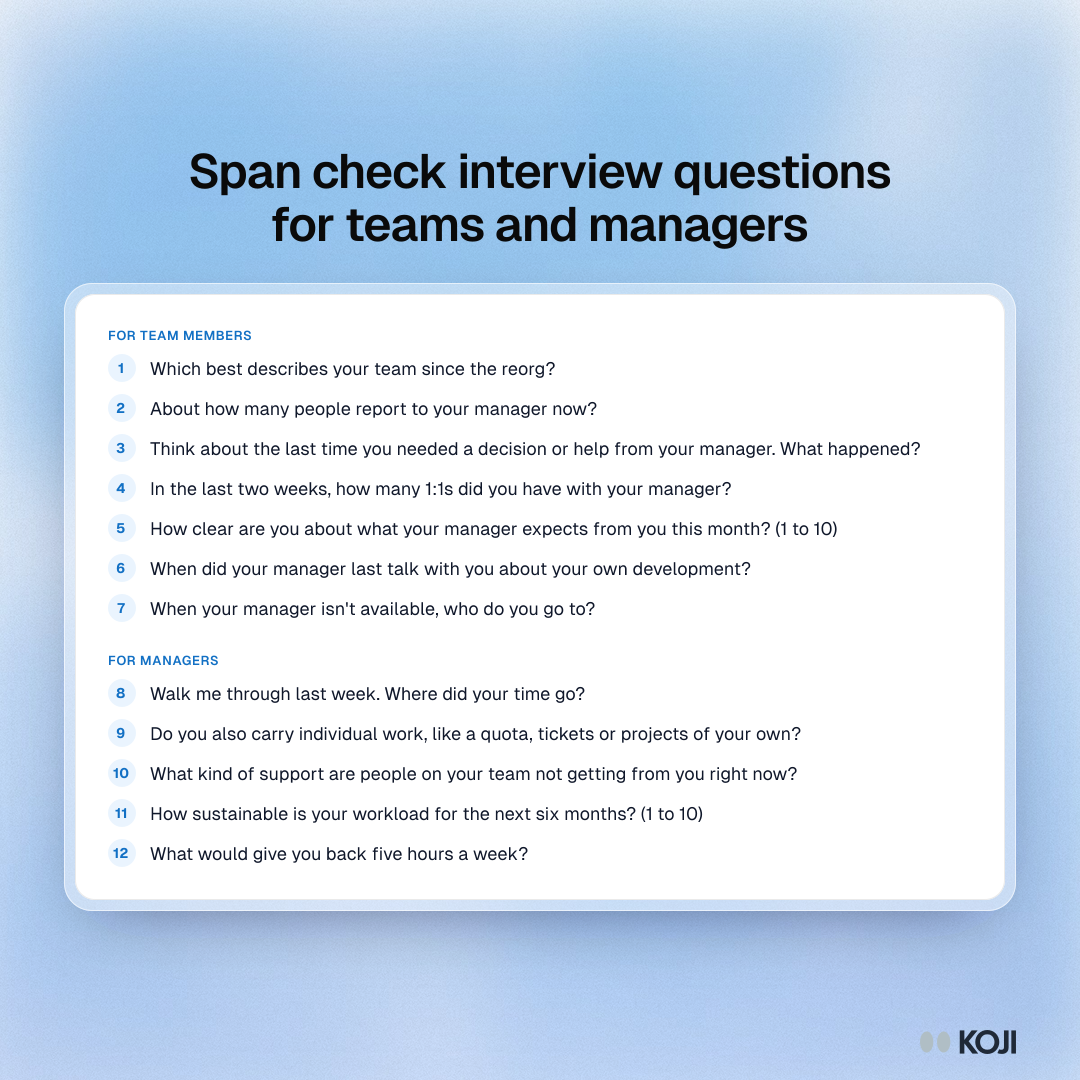
Question bank for a span check after a delayering, with seven questions for team members and five for managers

Question bank

Span check interview questions for teams and managers
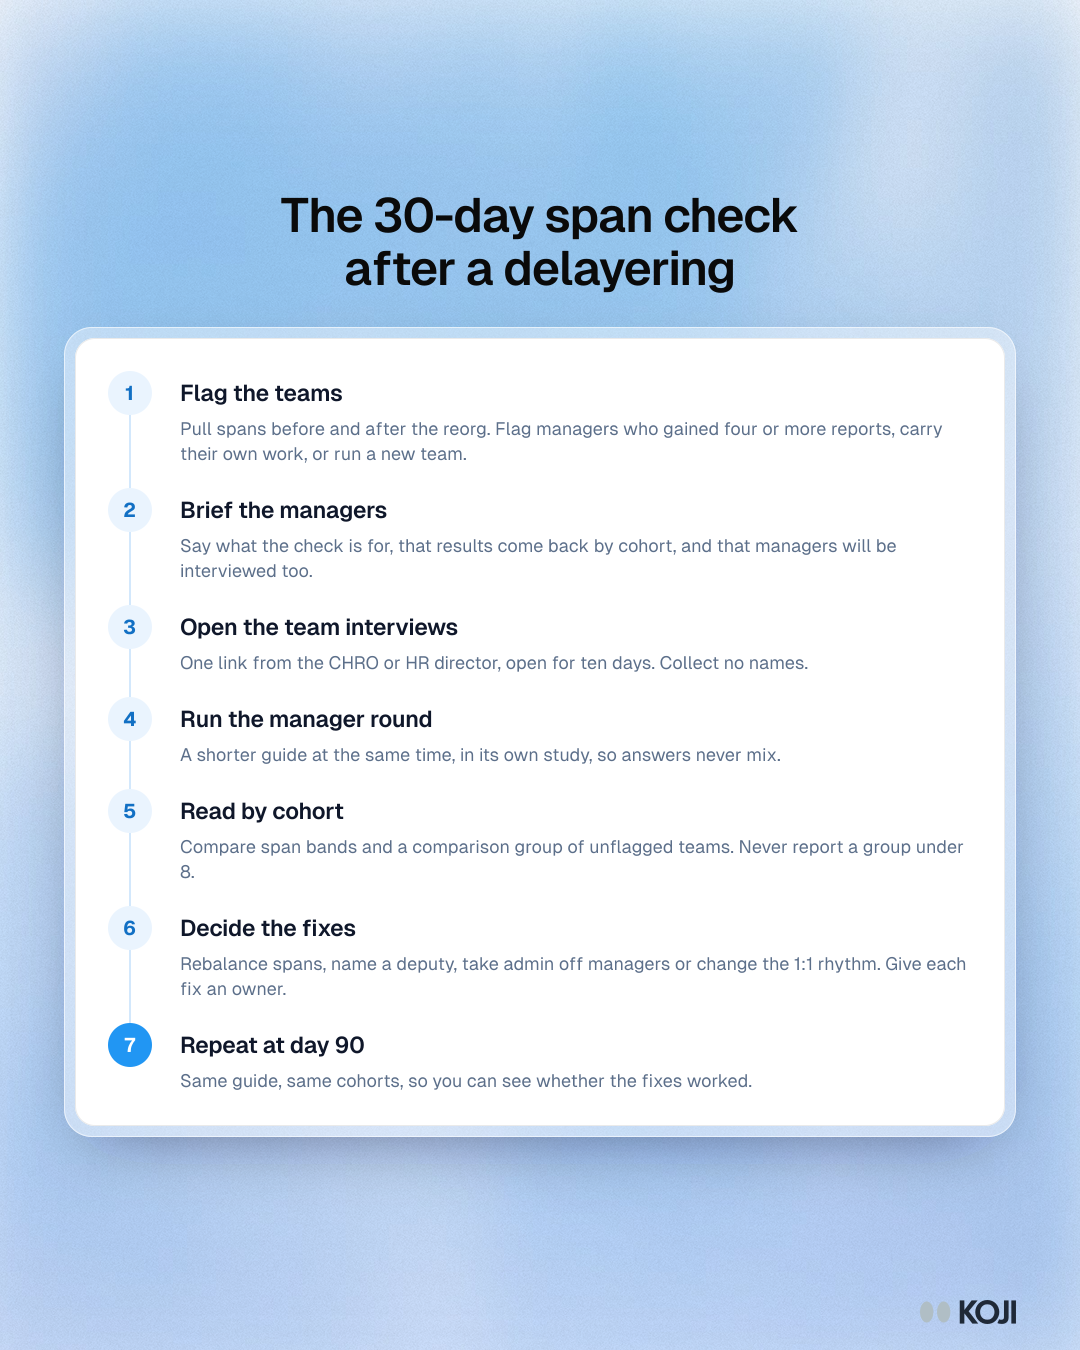
Process of the 30-day span check: flag teams, brief managers, interview teams and managers, read by cohort, decide fixes, repeat at day 90

Process

The 30-day span check after a delayering
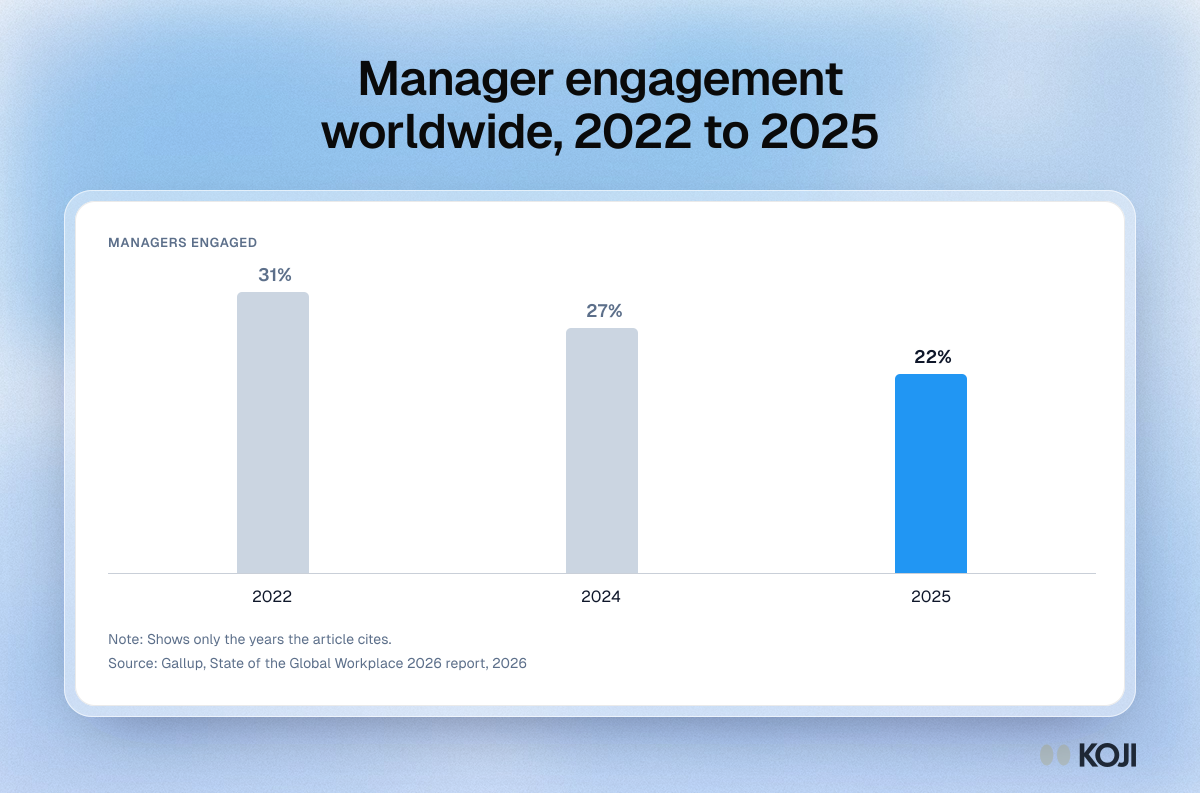
Column chart of the share of managers engaged at work worldwide: 31% in 2022, 27% in 2024 and 22% in 2025

Column chart

Manager engagement worldwide, 2022 to 2025
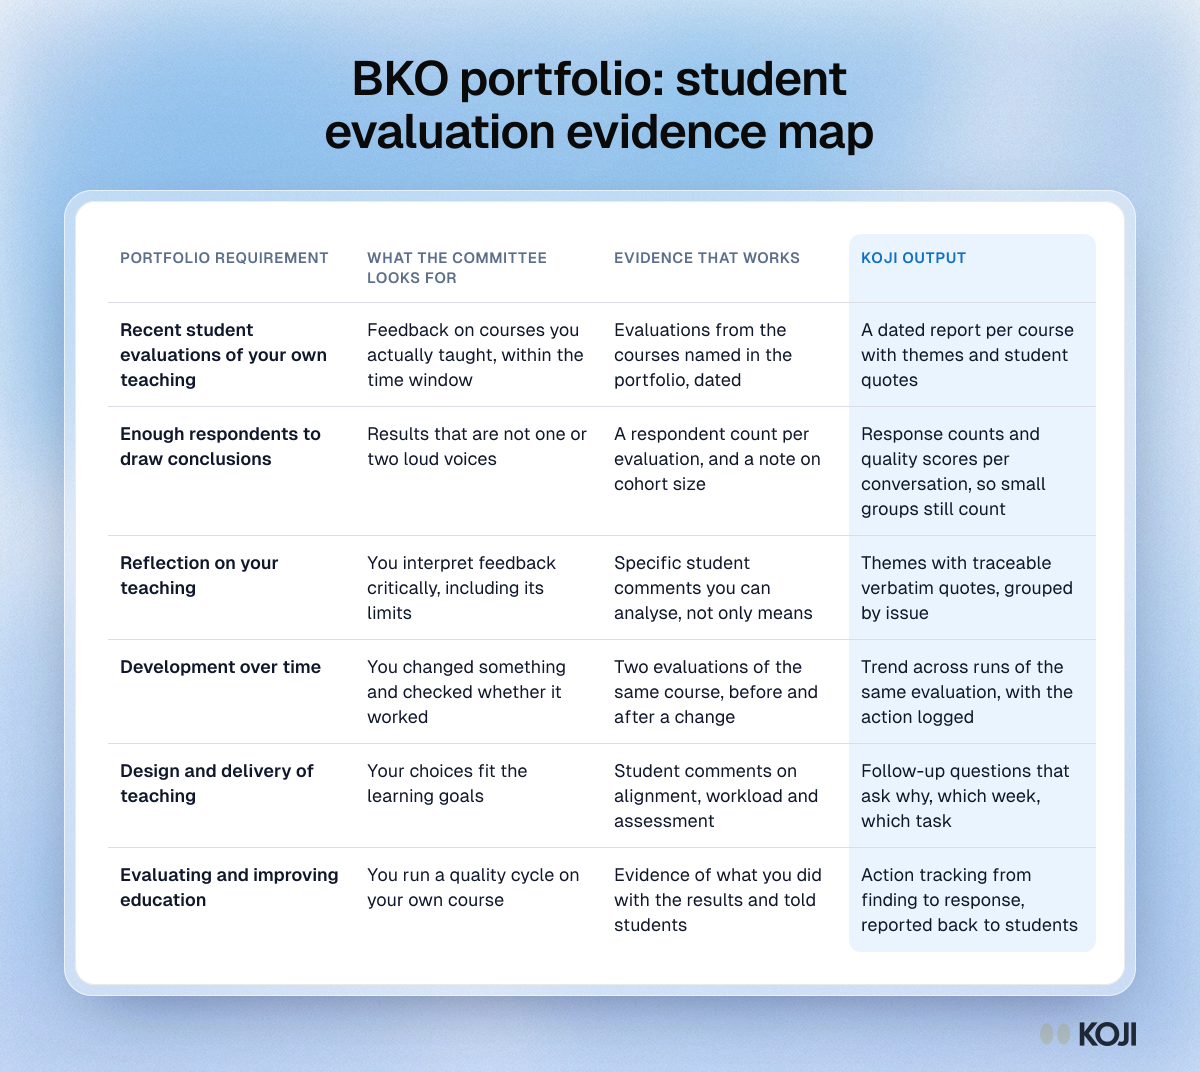
Table mapping BKO portfolio requirements to what the assessment committee looks for and the evaluation evidence and Koji output that supports each one.

Reference table

BKO portfolio: student evaluation evidence map
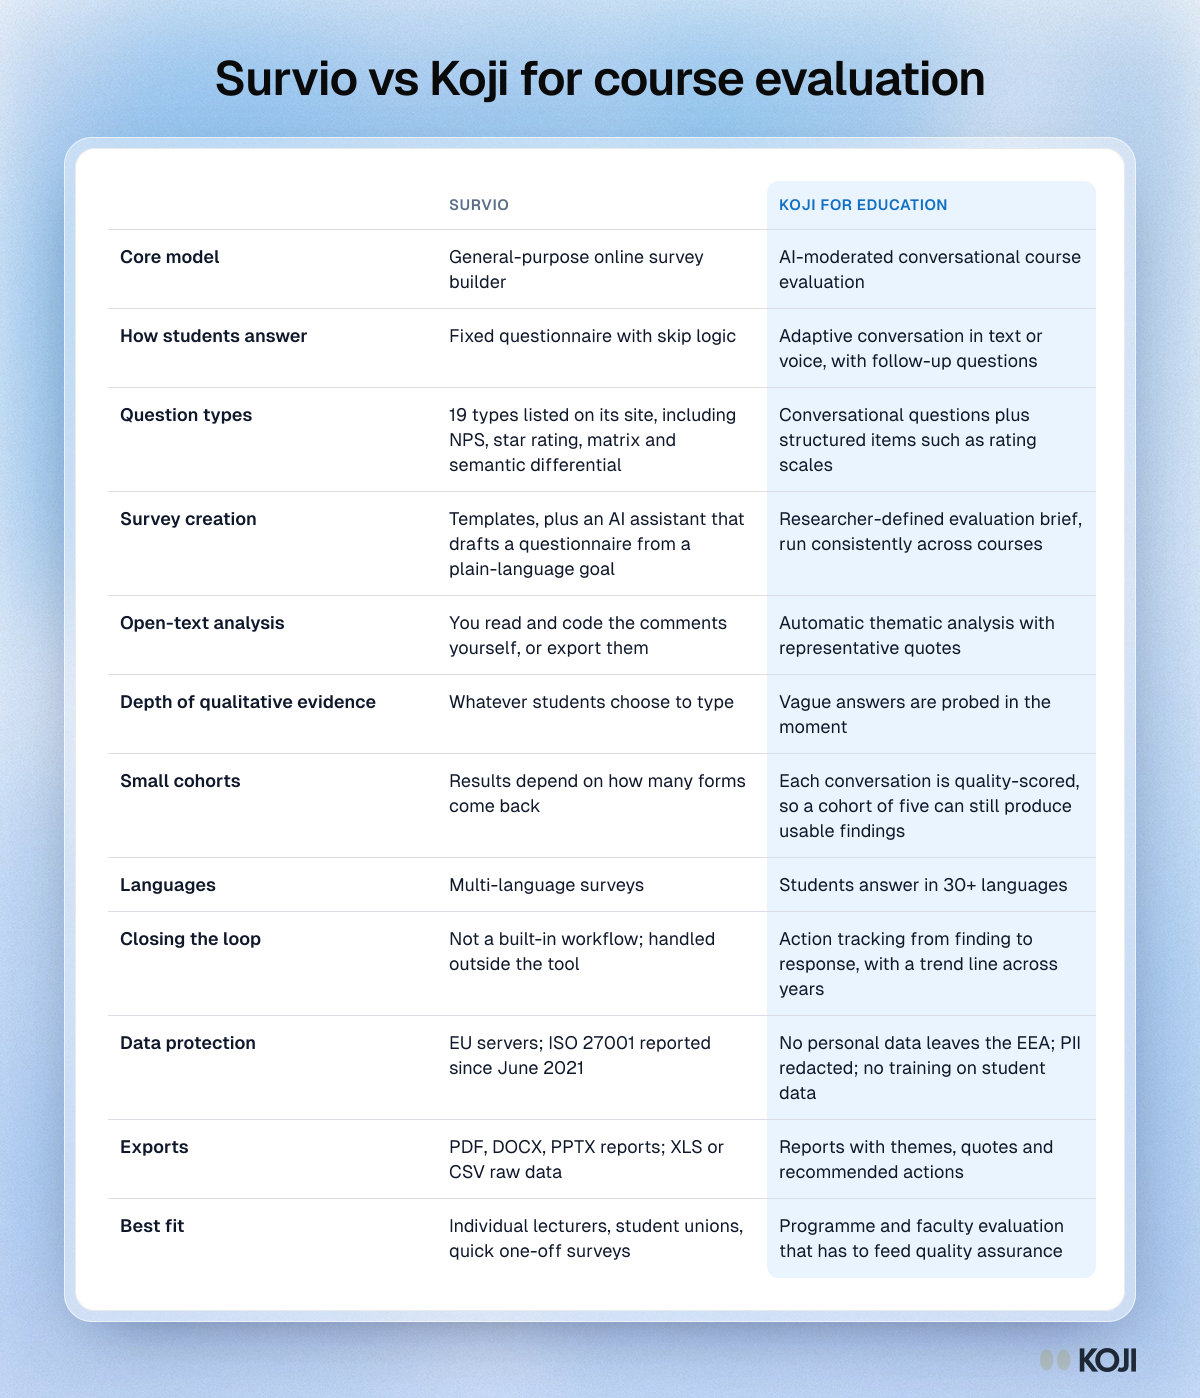
Comparison table of Survio and Koji for course evaluation across answer format, analysis, small cohorts, closing the loop and EU data handling.

Reference table

Survio vs Koji for course evaluation
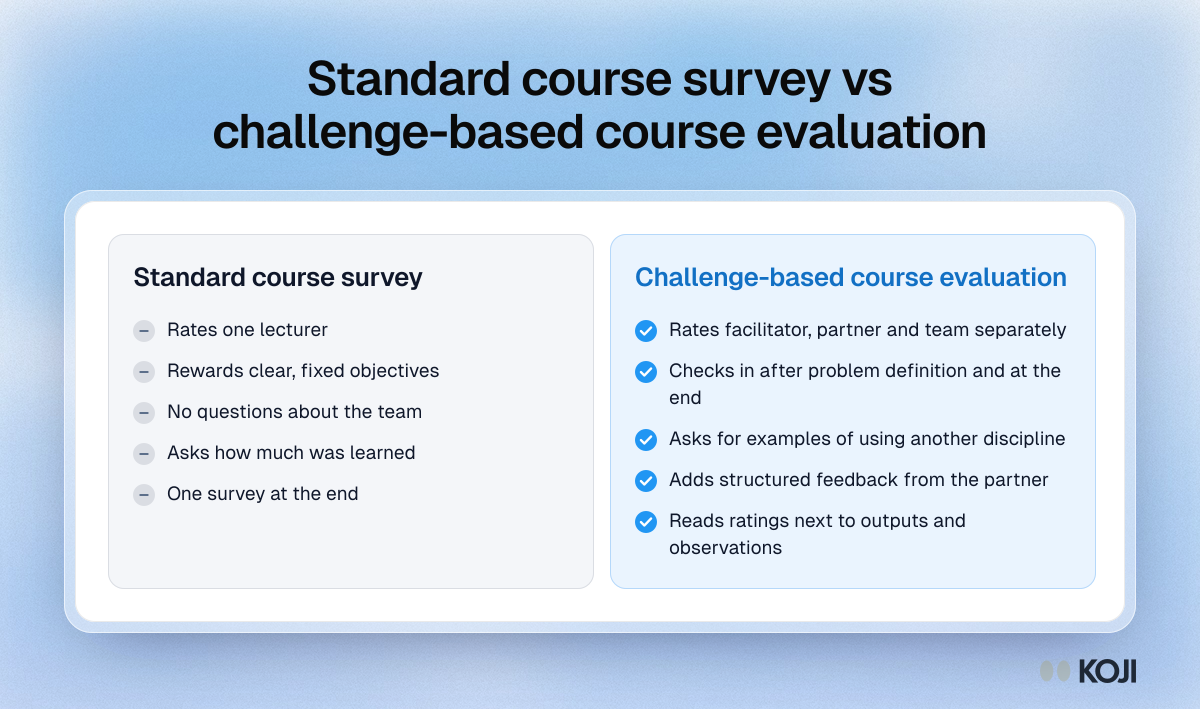
Comparison of a standard course survey with an evaluation built for challenge-based courses, set out across who is rated, what is asked and when.

Comparison

Standard course survey vs challenge-based course evaluation
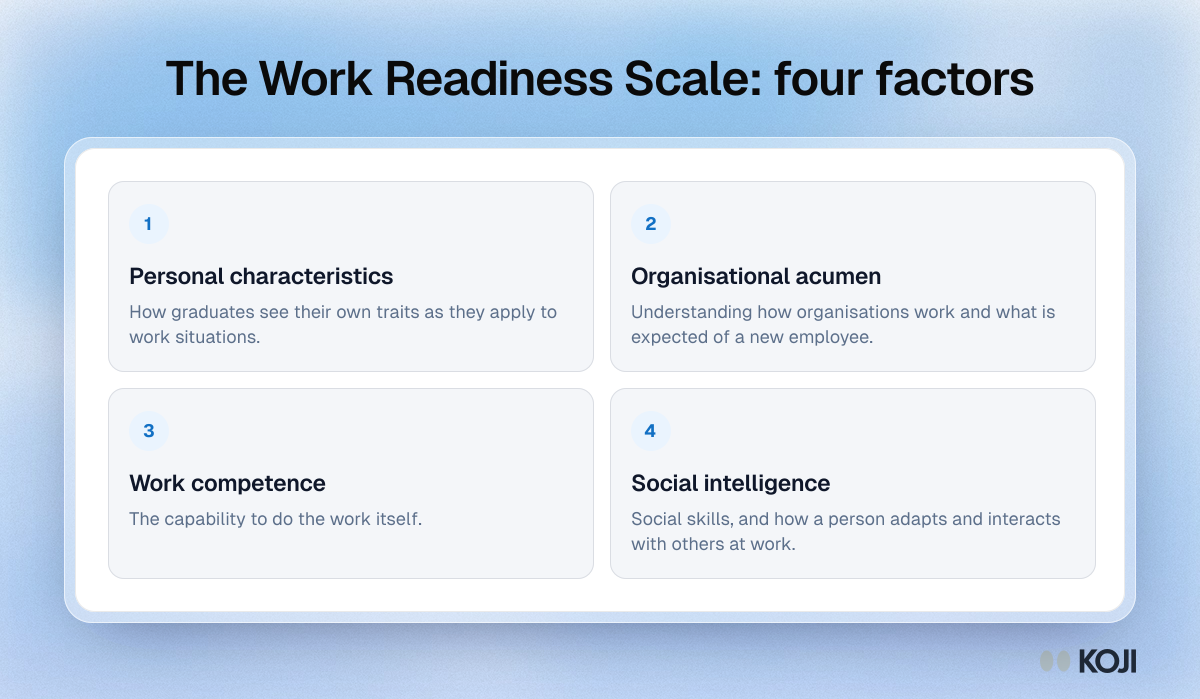
Framework showing the four factors of the Work Readiness Scale: personal characteristics, organisational acumen, work competence and social intelligence.

Framework

The Work Readiness Scale: four factors
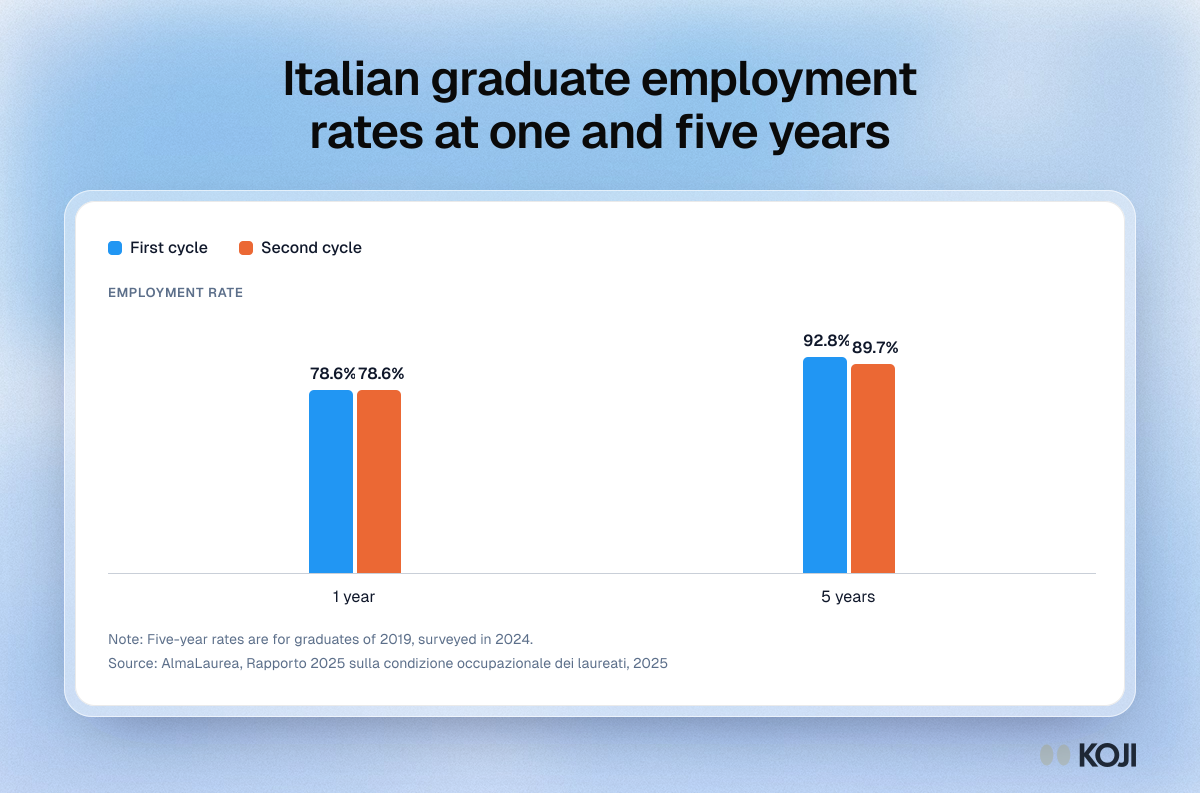
Column chart of AlmaLaurea 2025 employment rates: 78.6% at one year for both cycles, 92.8% and 89.7% at five years.

Column chart

Italian graduate employment rates at one and five years
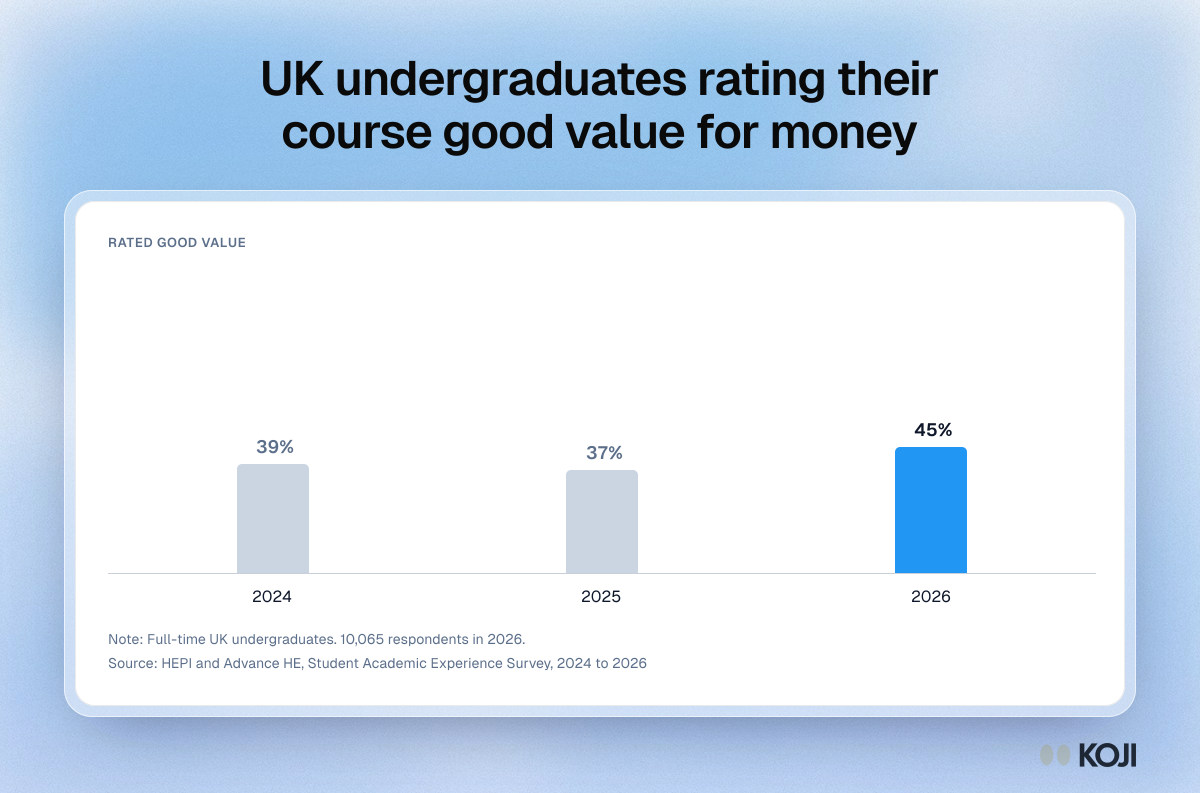
Column chart of the share of UK full-time undergraduates rating their course good or very good value for money: 39% in 2024, 37% in 2025 and 45% in 2026.

Column chart

UK undergraduates rating their course good value for money
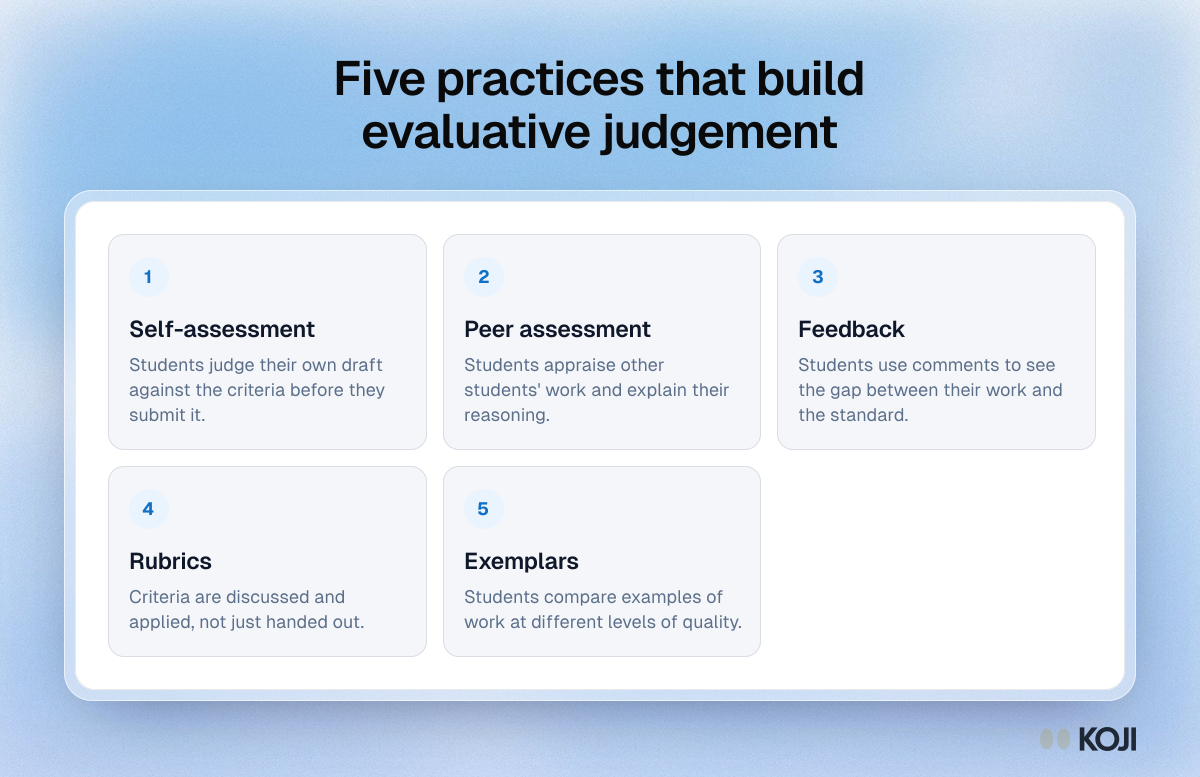
Framework of five practices that develop students' evaluative judgement: self-assessment, peer assessment, feedback, rubrics and exemplars.

Framework

Five practices that build evaluative judgement
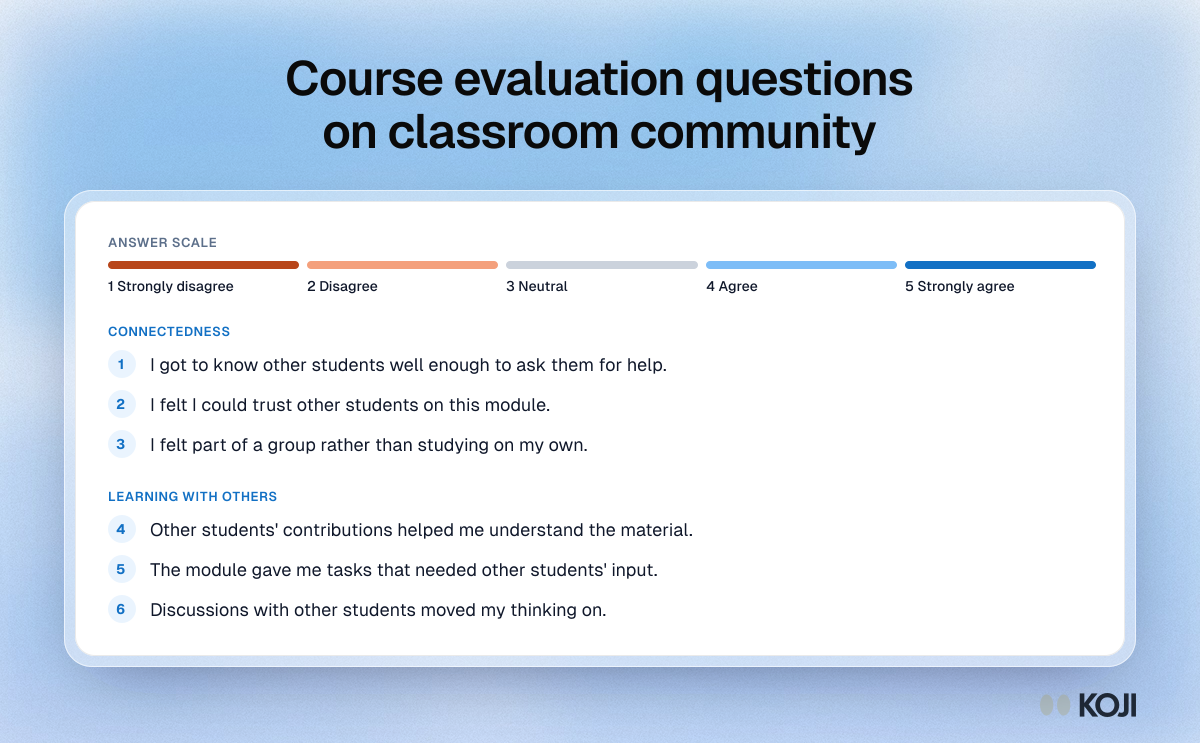
Question bank for asking about classroom community in a course evaluation, in two sections: connectedness with other students and the class as a place to learn.

Question bank

Course evaluation questions on classroom community
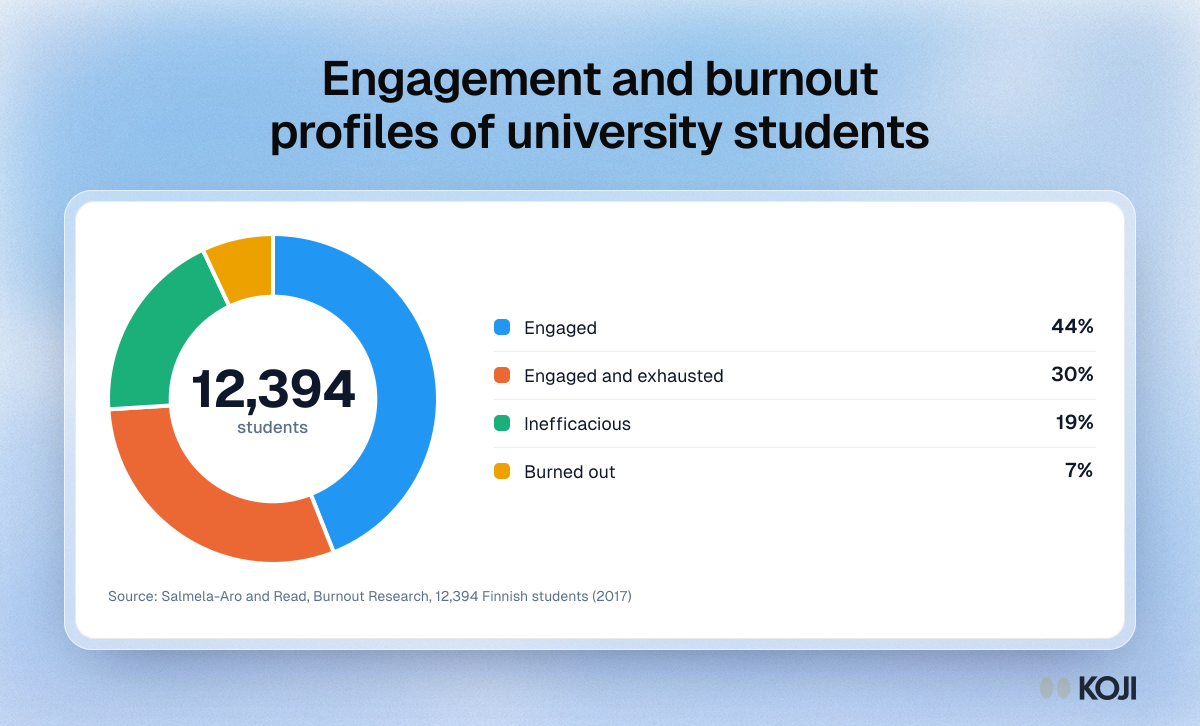
Donut chart of study engagement and burnout profiles in Finnish students: engaged 44%, engaged-exhausted 30%, inefficacious 19%, burned-out 7%.

Donut chart

Engagement and burnout profiles of university students
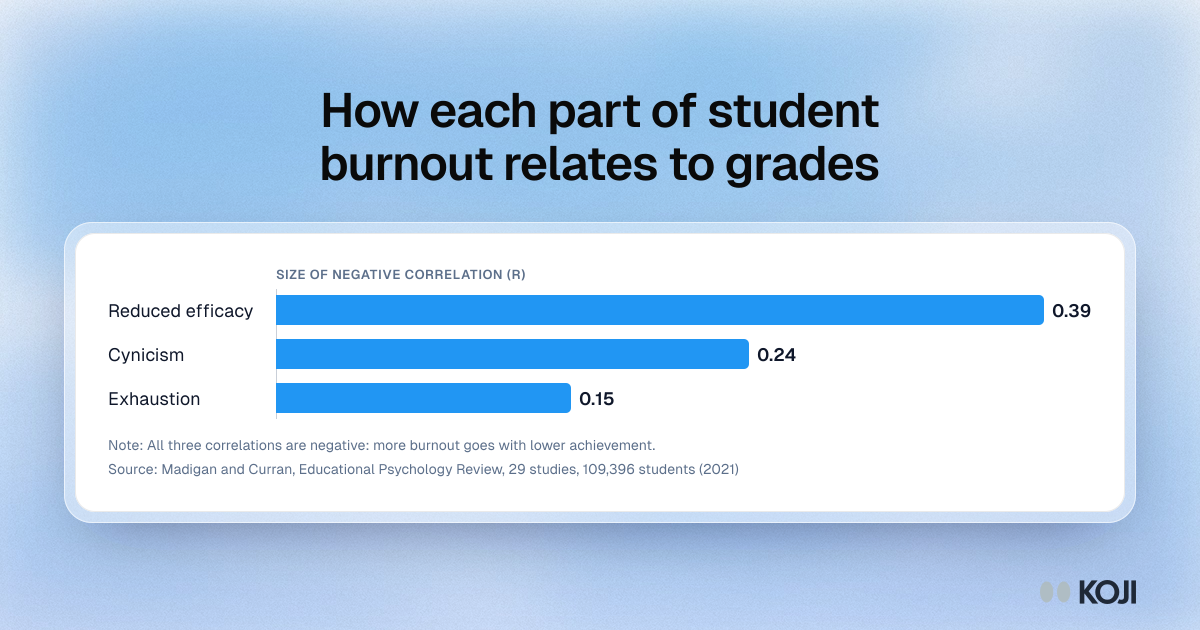
Bar chart of burnout dimensions and academic achievement: reduced efficacy r = -.39, cynicism r = -.24, exhaustion r = -.15.

Bar chart

How each part of student burnout relates to grades
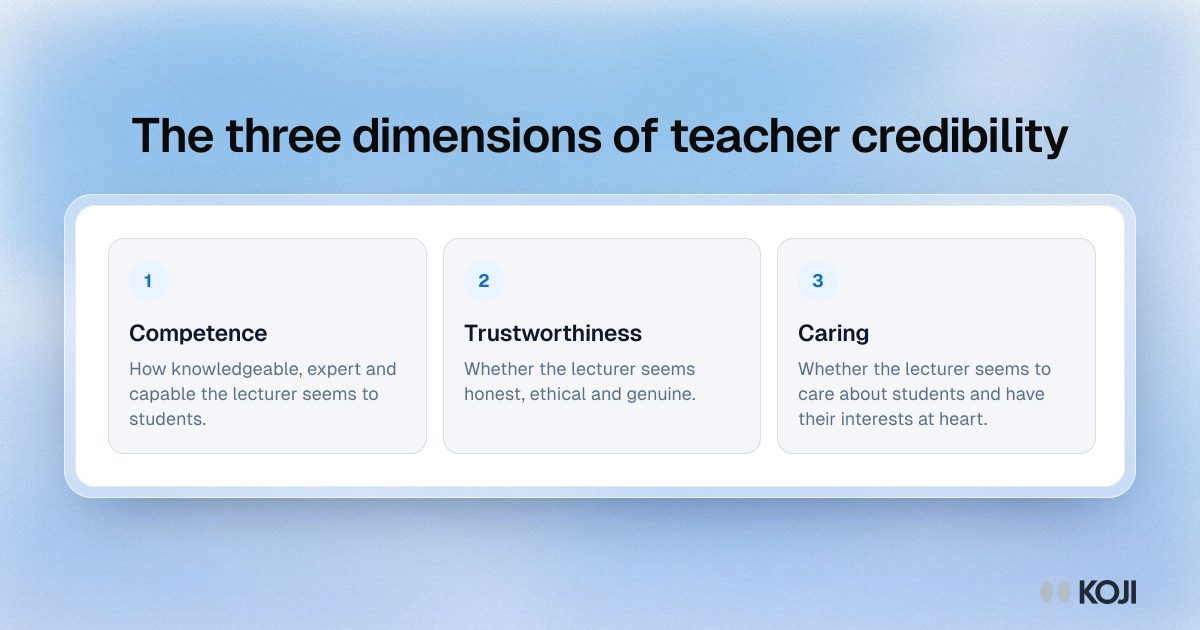
Framework showing the three dimensions of teacher credibility: competence, trustworthiness and caring, as measured by McCroskey and Teven.

Framework

The three dimensions of teacher credibility
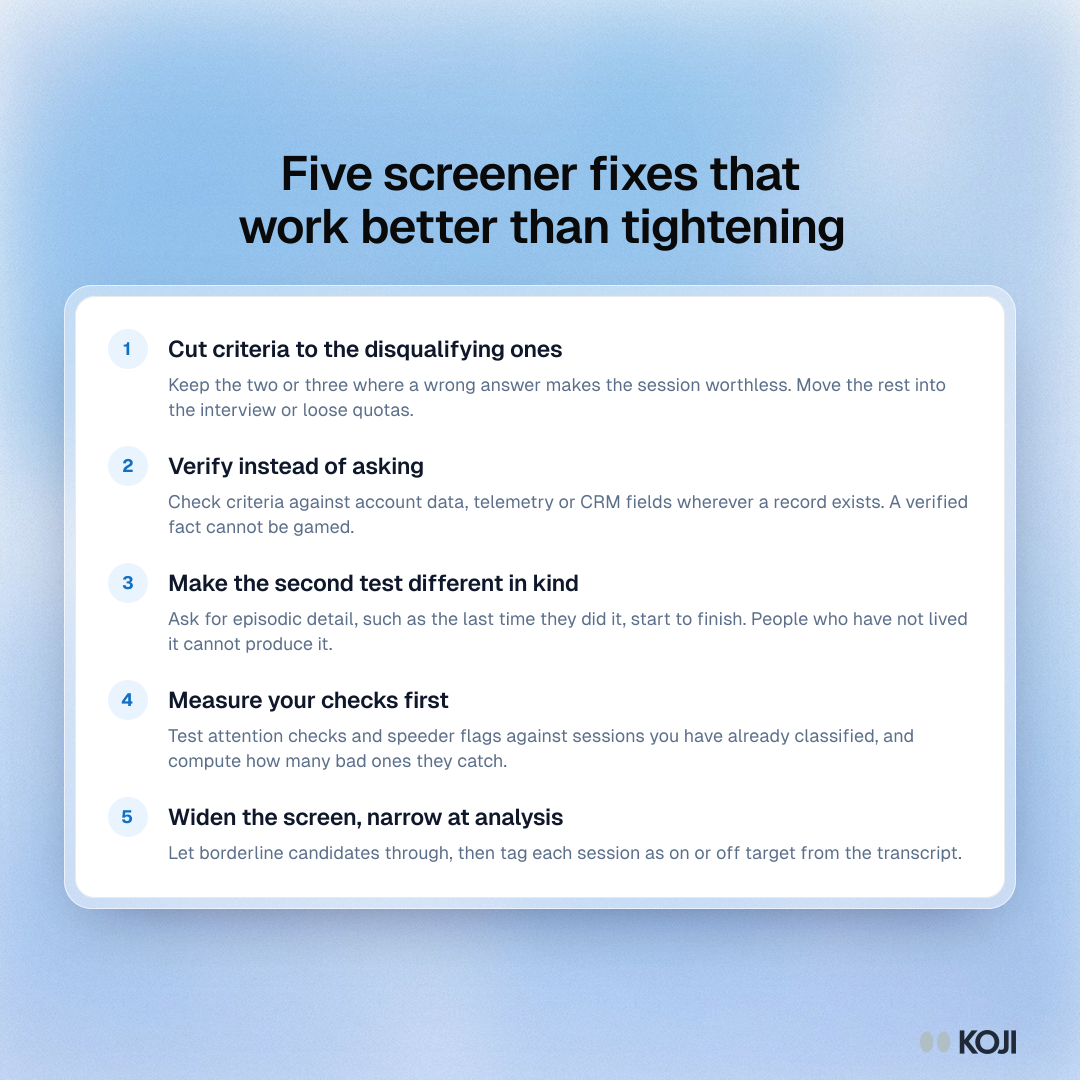
List of five screener fixes: cut criteria to the disqualifying ones, verify instead of asking, ask for episodic detail, measure checks, widen then narrow.

Guide

Five screener fixes that work better than tightening
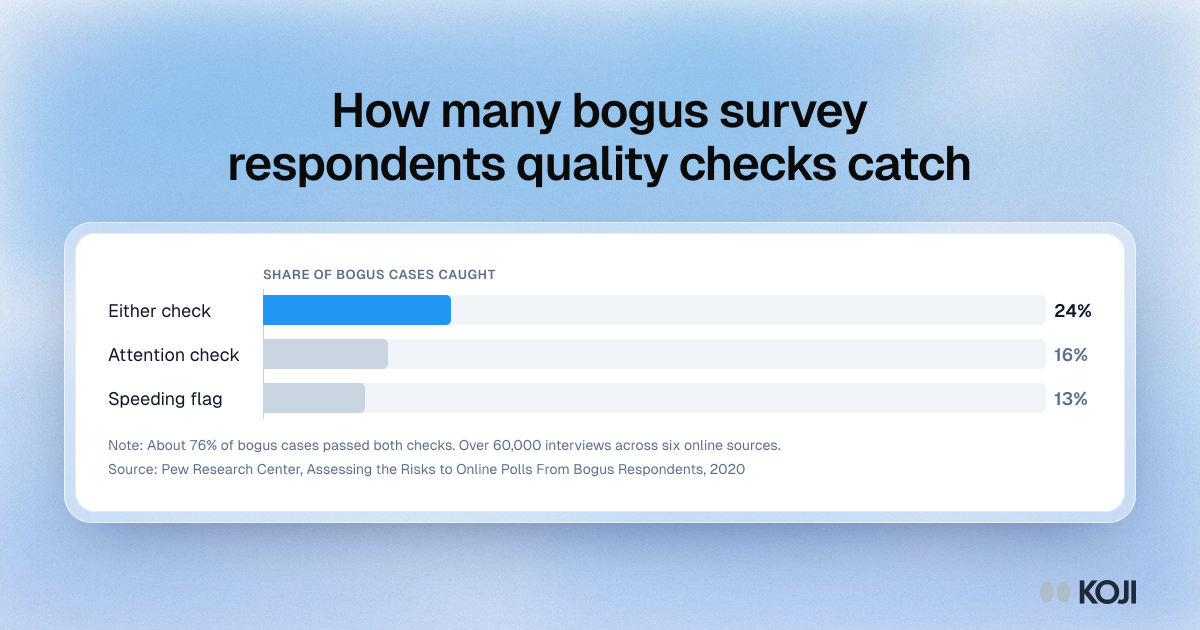
Bar chart of bogus survey respondents caught by quality checks: 16% by an attention check, 13% by a speeding flag and 24% by either one.

Bar chart

How many bogus survey respondents quality checks catch
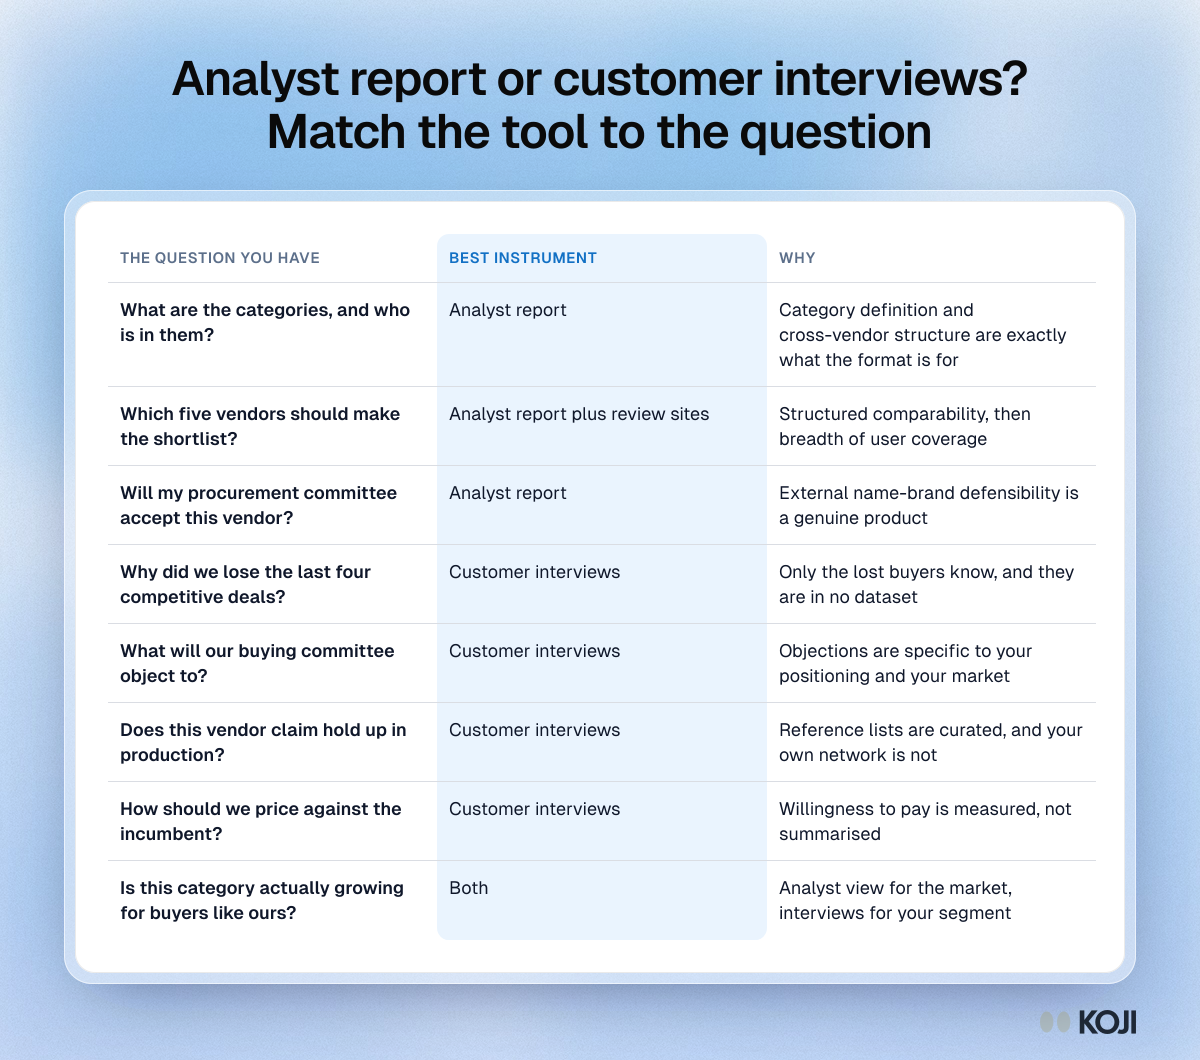
Table of eight B2B buying questions matched to an analyst report, customer interviews or both, from category structure to lost deals and pricing.

Reference table

Analyst report or customer interviews? Match the tool to the question
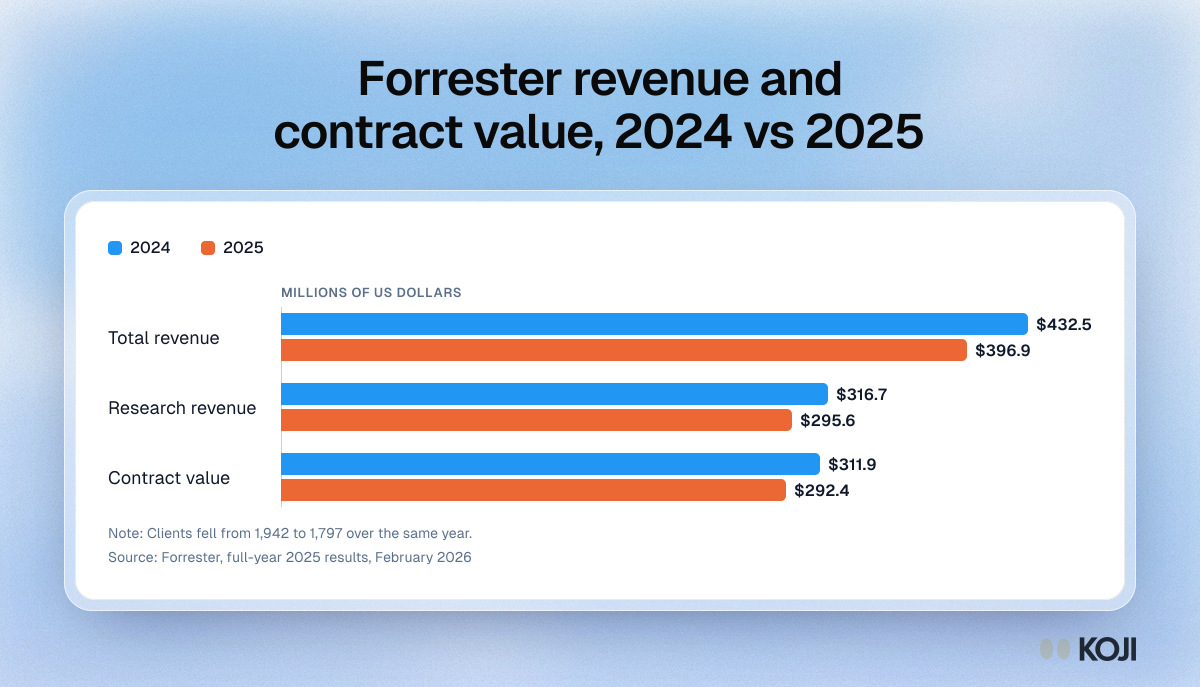
Bar chart of Forrester results in millions of dollars: revenue fell from 432.5 to 396.9, research revenue 316.7 to 295.6, contract value 311.9 to 292.4.

Bar chart

Forrester revenue and contract value, 2024 vs 2025
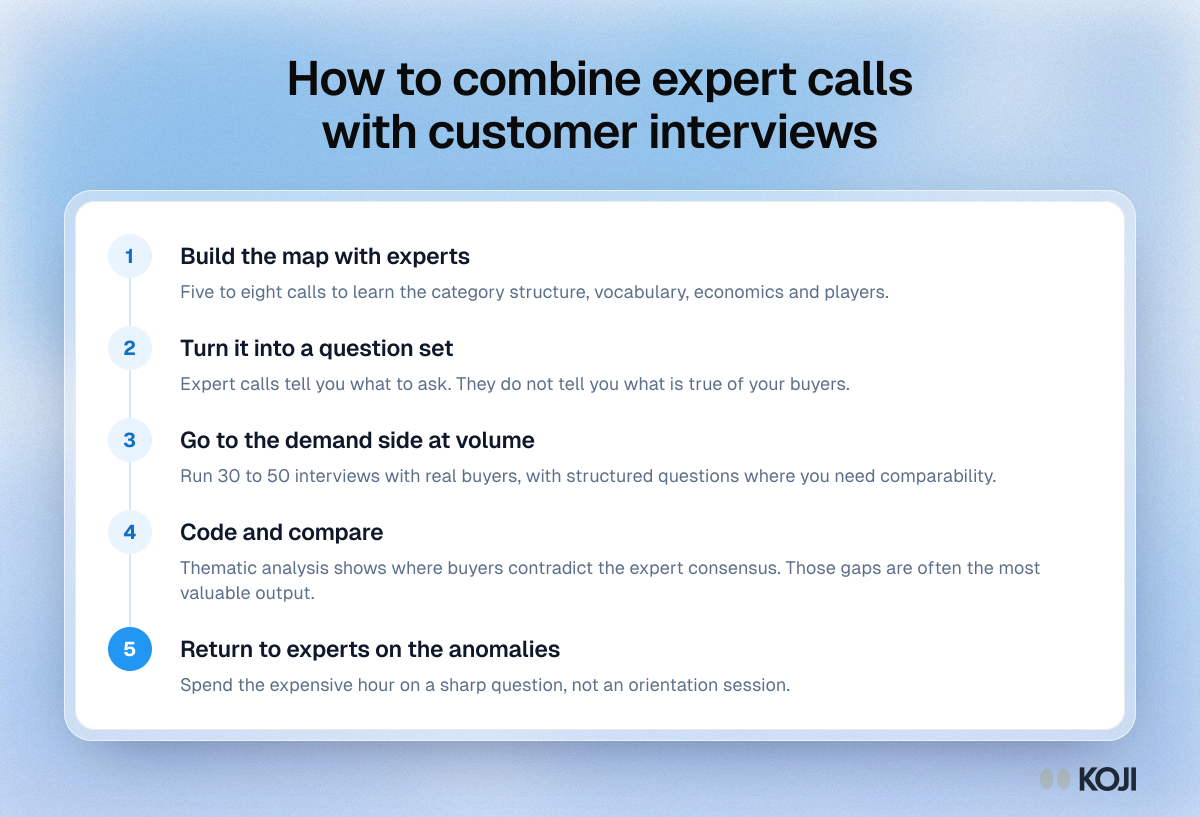
Process of five steps to combine expert network calls and customer interviews: map with experts, write questions, interview buyers, compare, follow up.

Process

How to combine expert calls with customer interviews
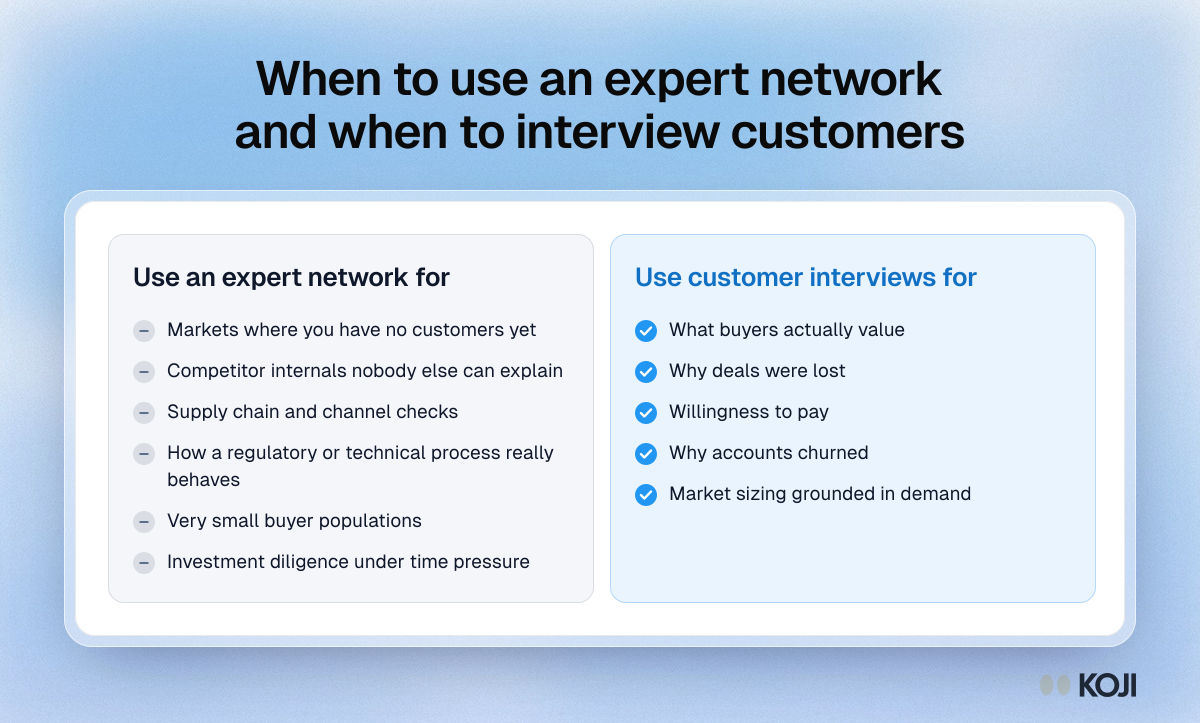
Comparison of when to use expert networks, such as competitor internals and new markets, and when to use customer interviews, such as churn and pricing.

Comparison

When to use an expert network and when to interview customers
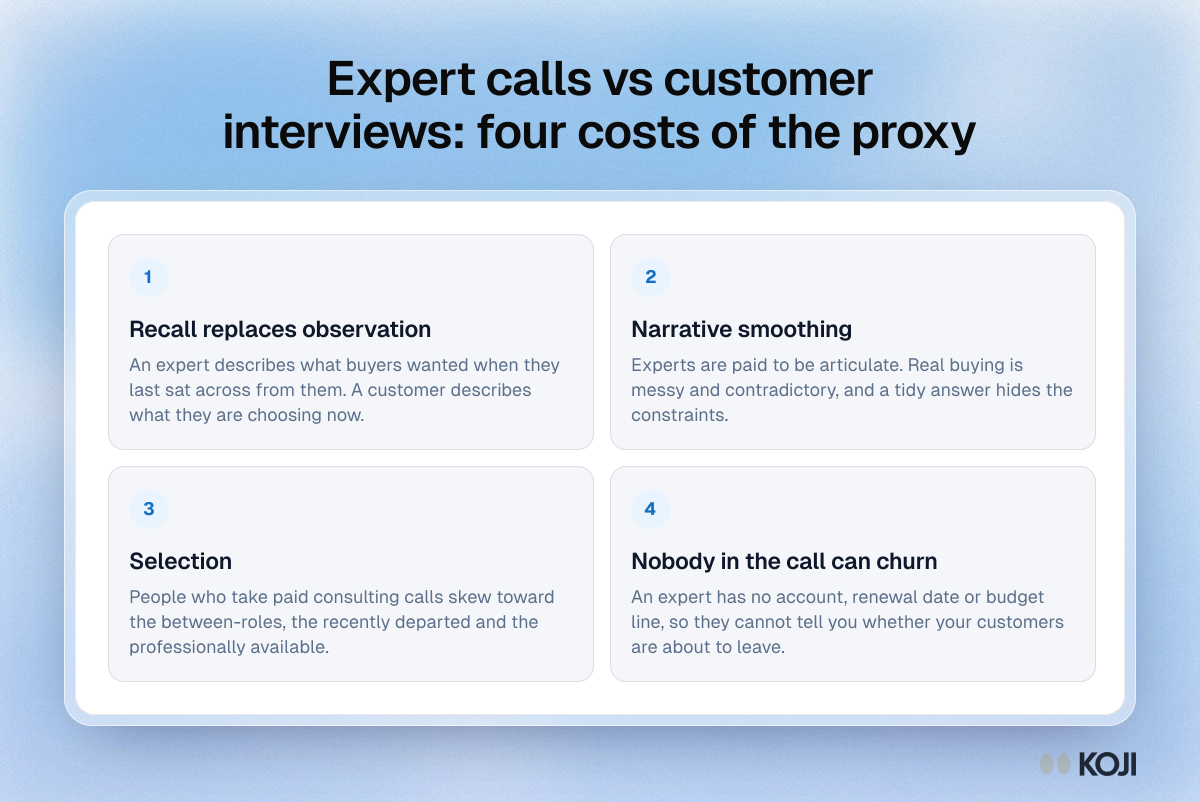
Framework of four costs of using expert network calls instead of customer interviews: recall over observation, narrative smoothing, selection and no churn risk.

Framework

Expert calls vs customer interviews: four costs of the proxy
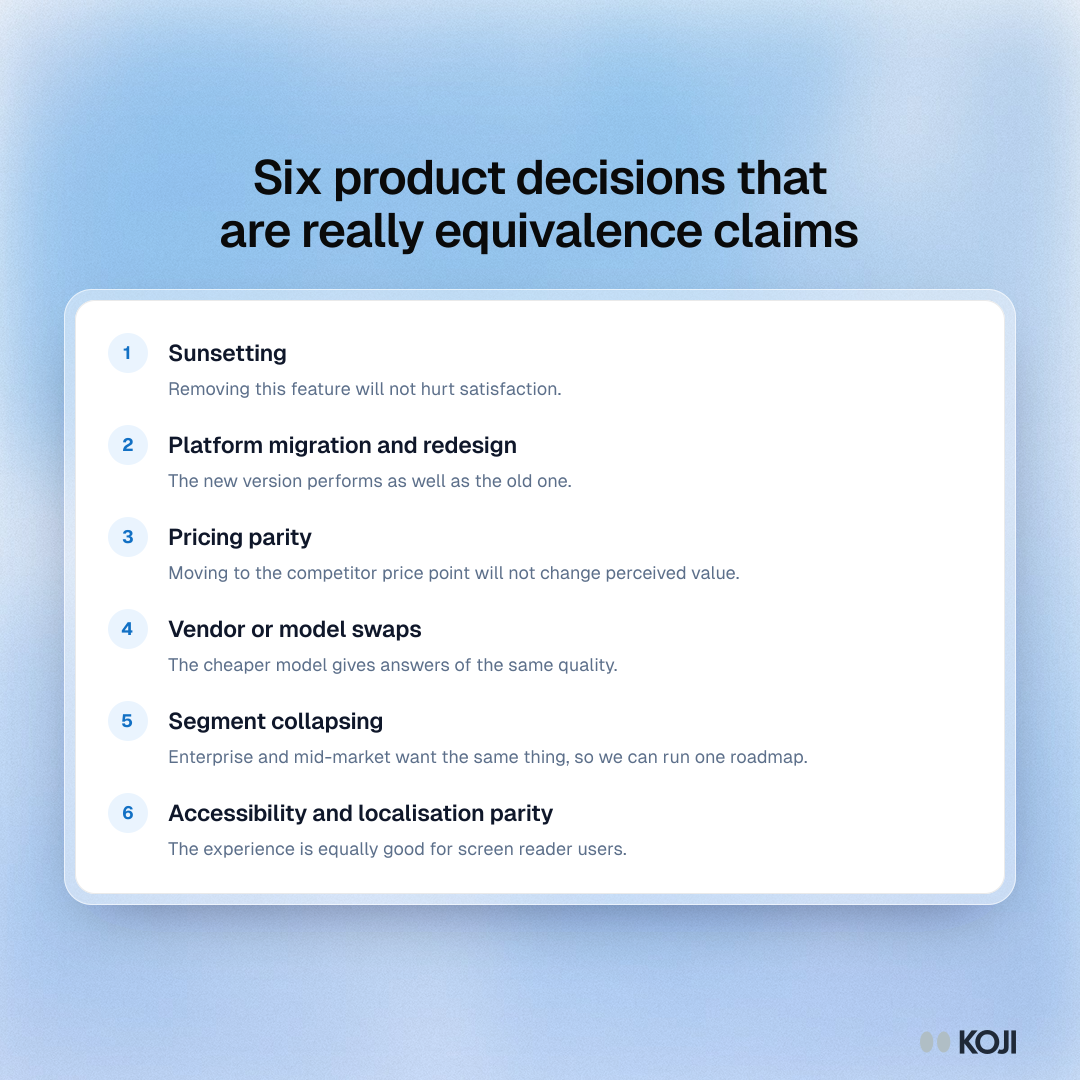
List of six product decisions that claim no difference: sunsetting, migration, pricing parity, vendor or model swaps, merging segments and accessibility parity.

Guide

Six product decisions that are really equivalence claims
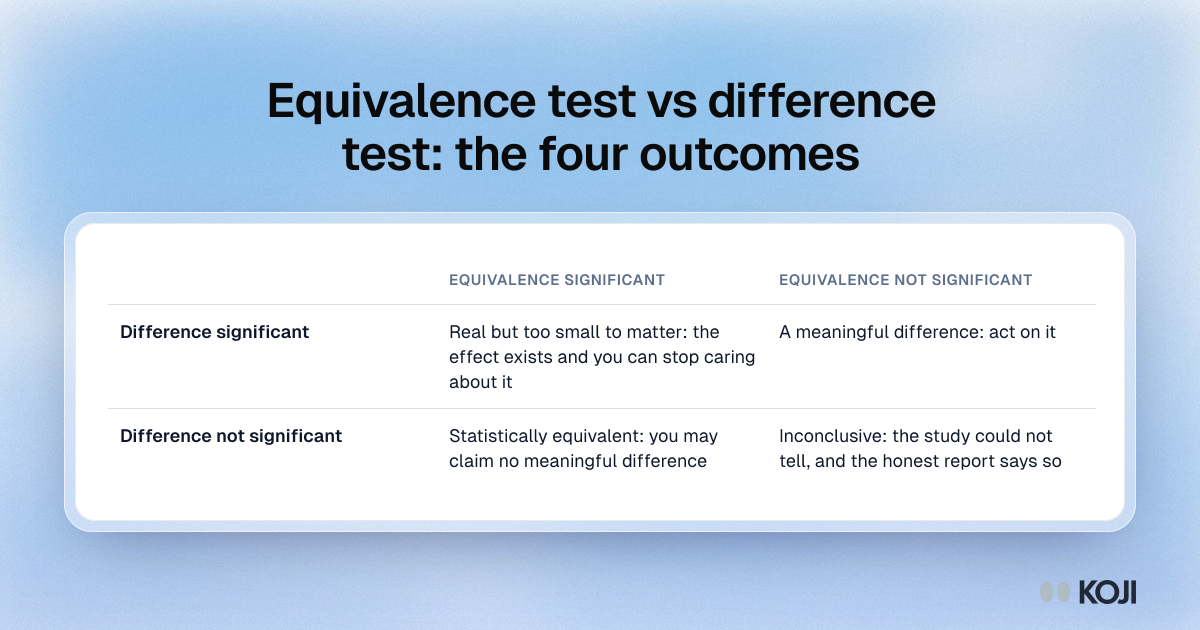
Two by two table of results from a difference test and an equivalence test: too small to matter, a meaningful difference, equivalent, or inconclusive.

Reference table

Equivalence test vs difference test: the four outcomes
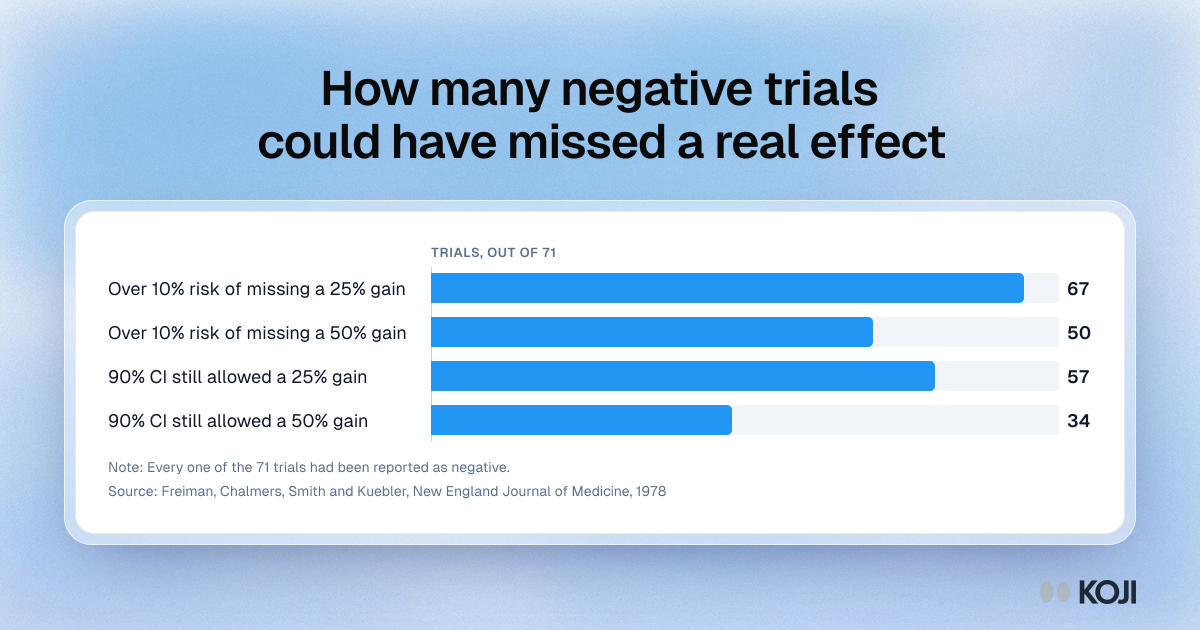
Bar chart of 71 trials reported as negative: 67 risked missing a 25% improvement, and in 34 the data still allowed a 50% improvement.

Bar chart

How many negative trials could have missed a real effect
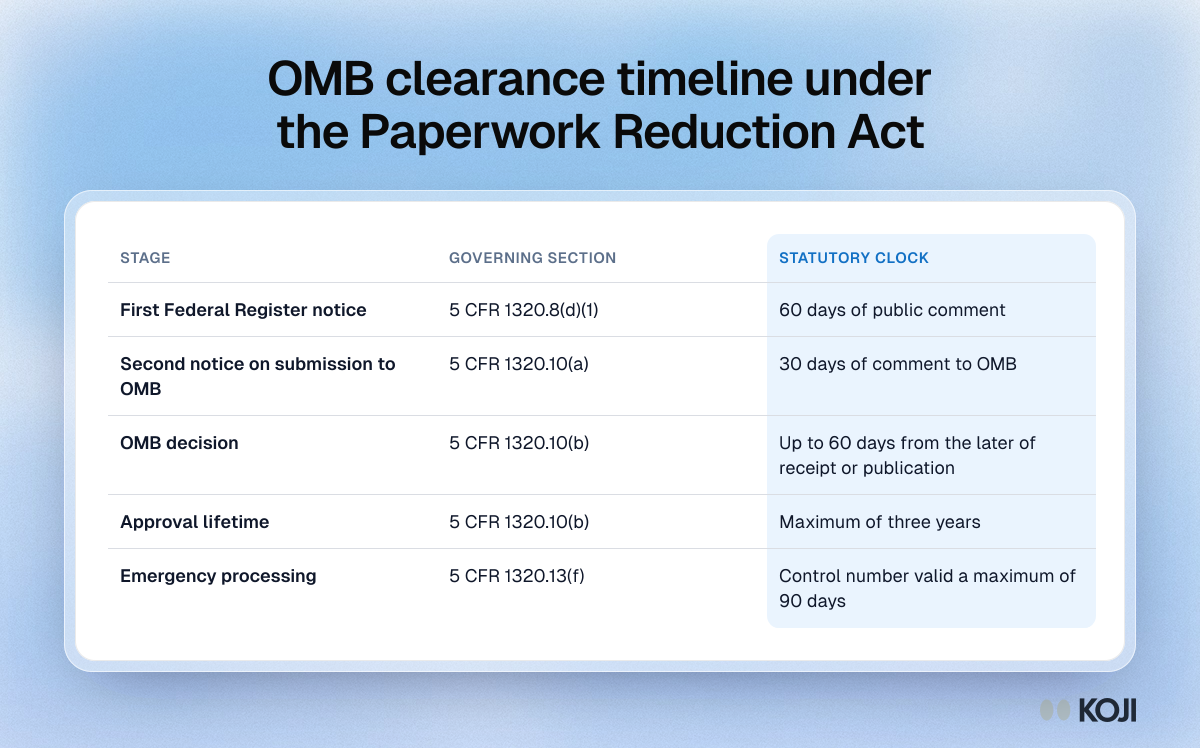
Table of the OMB clearance stages under the Paperwork Reduction Act: a 60-day notice, a 30-day notice, up to 60 days for OMB and a three-year approval limit.

Reference table

OMB clearance timeline under the Paperwork Reduction Act
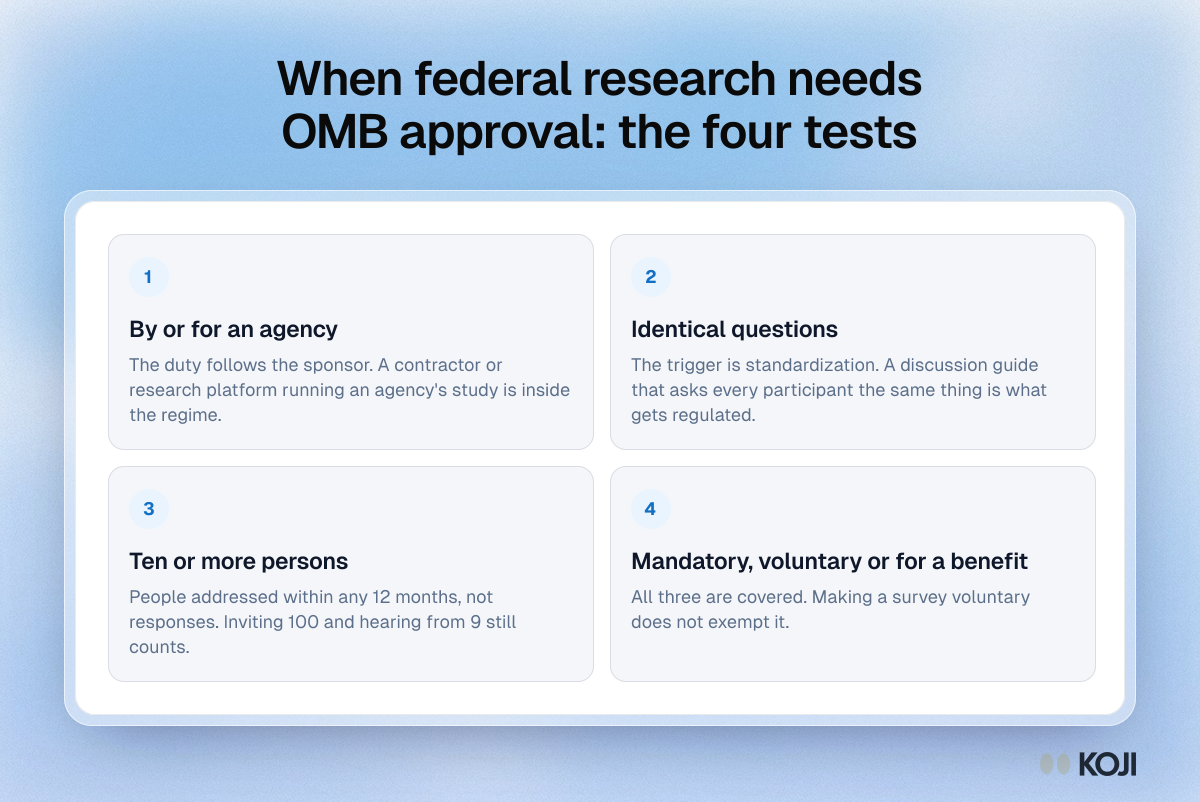
Framework of the four Paperwork Reduction Act tests: by or for an agency, identical questions, ten or more persons, and mandatory, voluntary or for a benefit.

Framework

When federal research needs OMB approval: the four tests
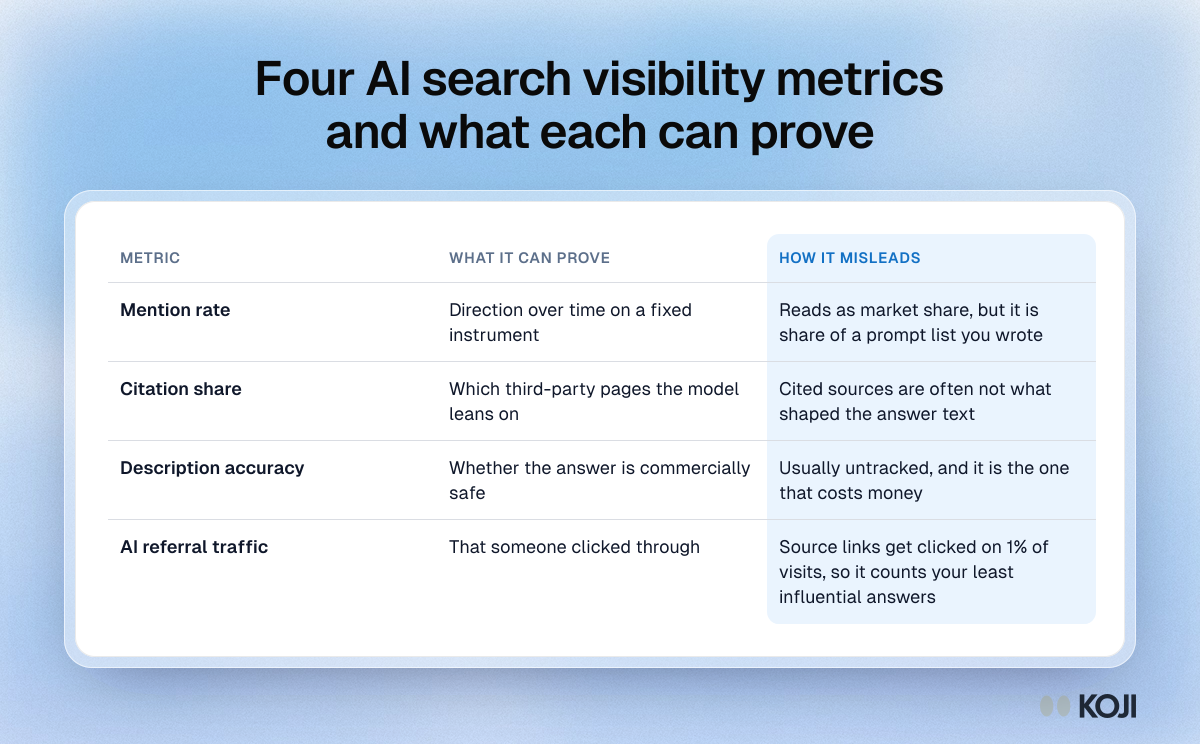
Table of four AI search visibility metrics: mention rate, citation share, description accuracy and AI referral traffic, with what each proves and hides.

Reference table

Four AI search visibility metrics and what each can prove
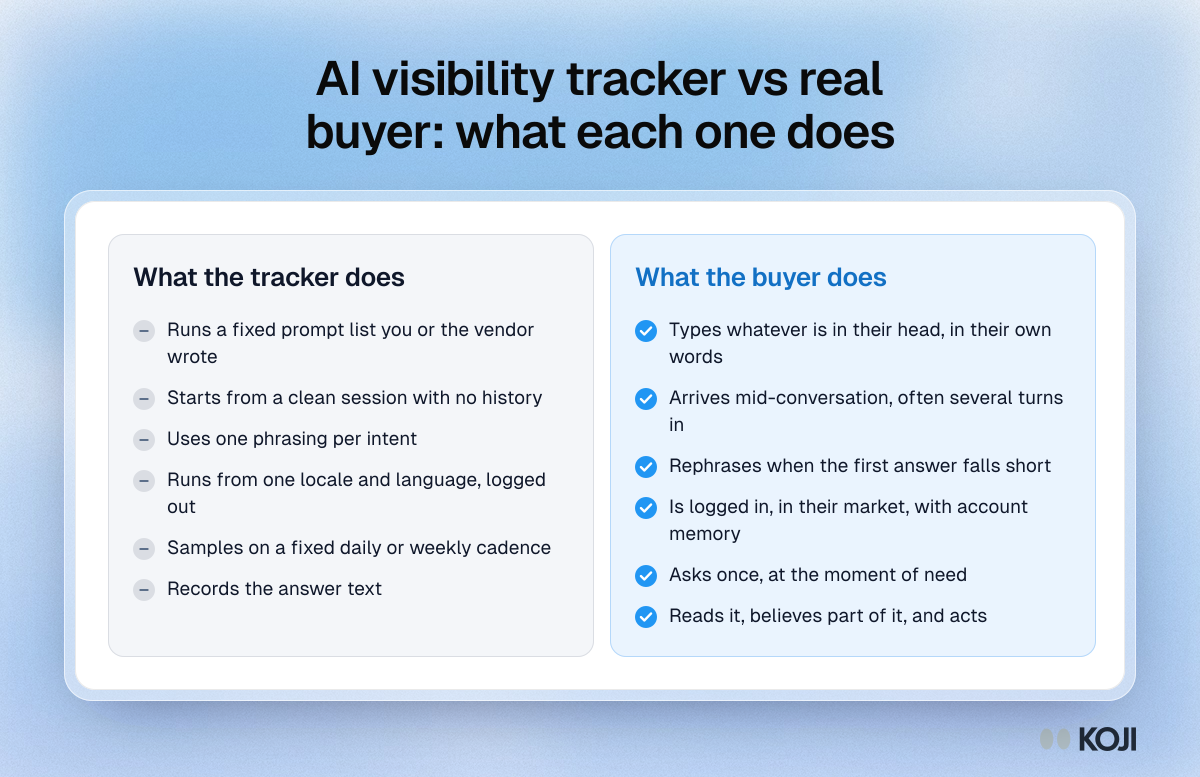
Comparison of an AI visibility tracker and a real buyer: fixed prompts, clean sessions and one phrasing against free text, history and rephrasing.

Comparison

AI visibility tracker vs real buyer: what each one does
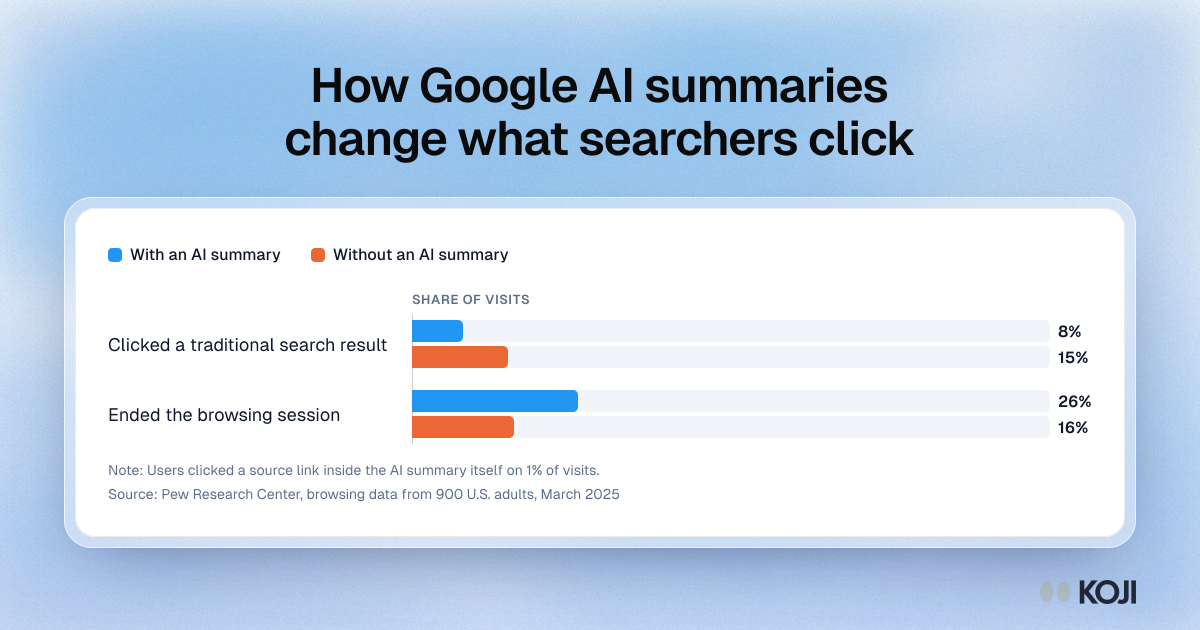
Bar chart: searchers clicked a traditional result on 8% of visits with an AI summary against 15% without, and ended the session on 26% against 16%.

Bar chart

How Google AI summaries change what searchers click
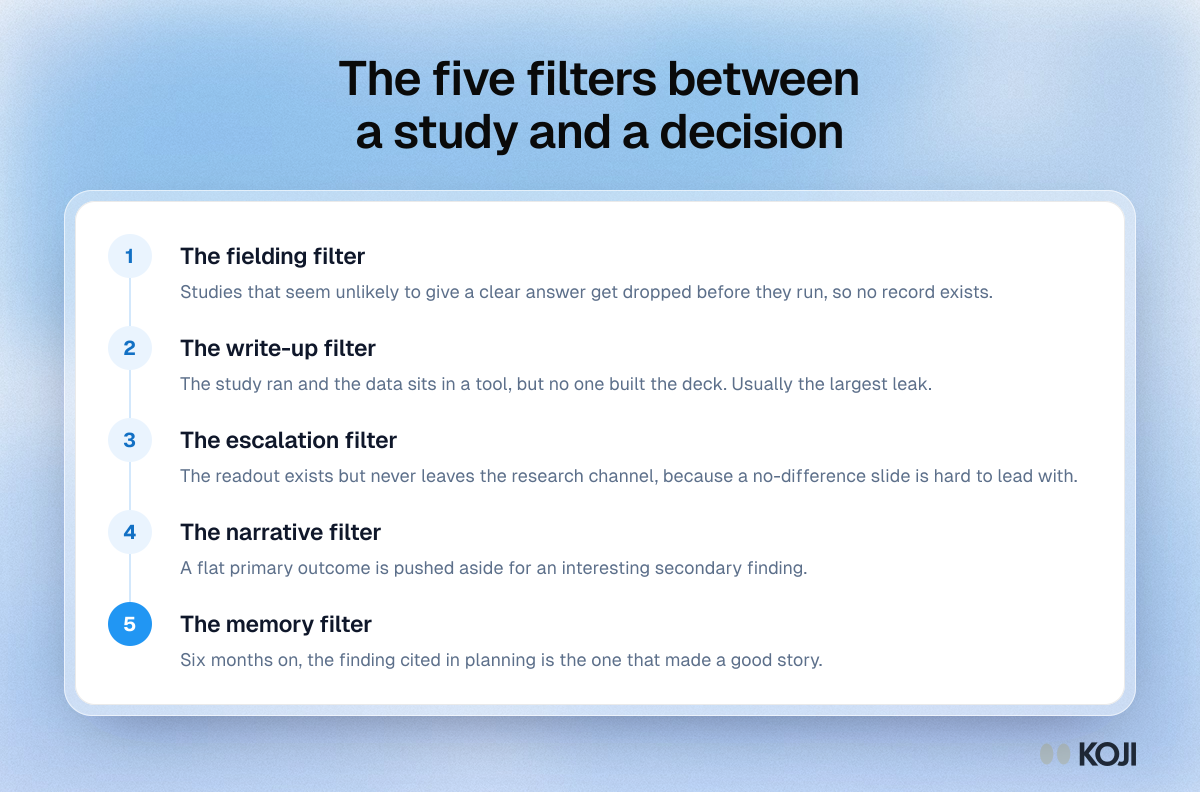
Process diagram of five filters where null results get lost: fielding, write-up, escalation, narrative and memory, from study plan to planning doc.

Process

The five filters between a study and a decision
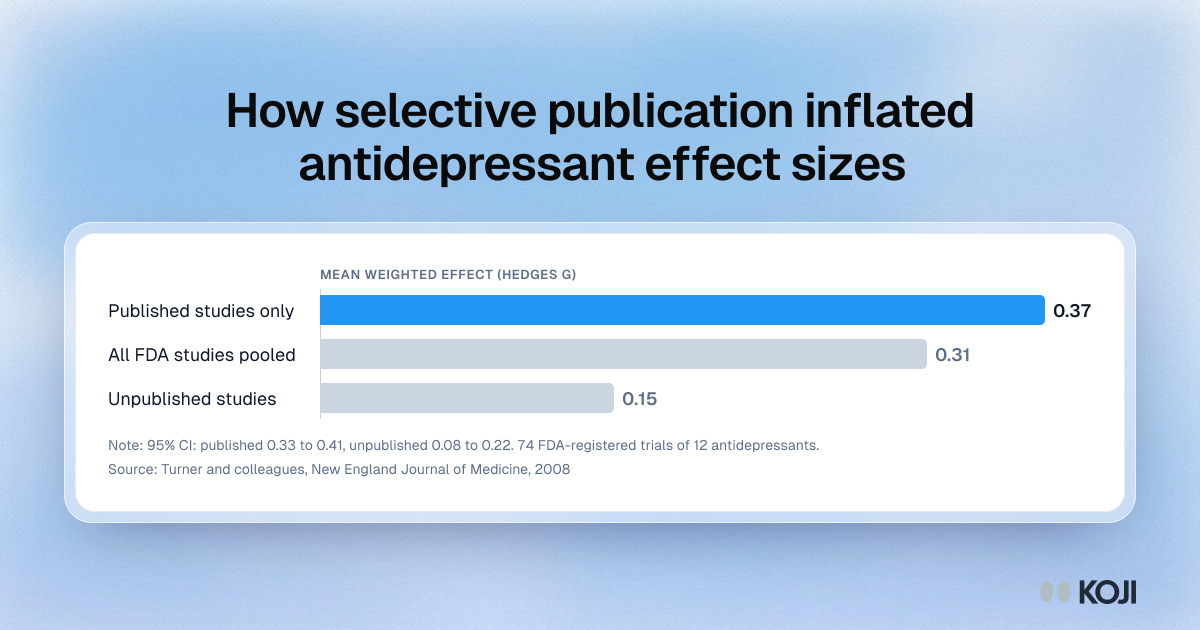
Bar chart of antidepressant trial effect sizes: 0.37 in published studies, 0.31 across all FDA studies and 0.15 in unpublished studies.

Bar chart

How selective publication inflated antidepressant effect sizes
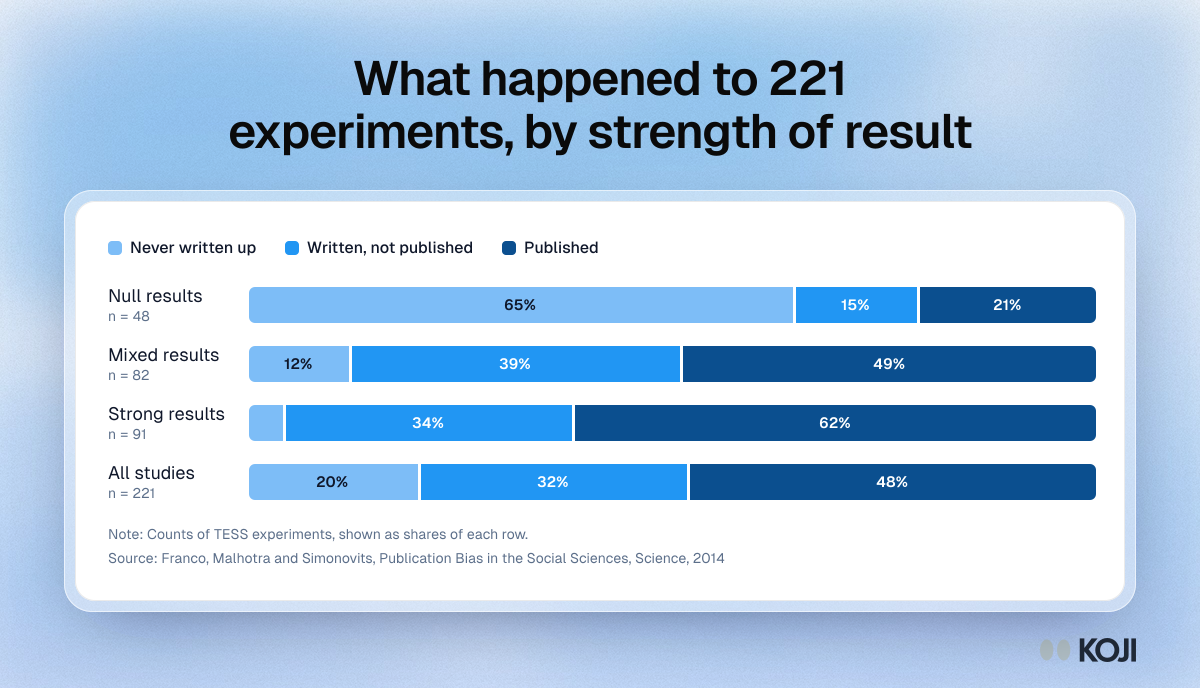
Stacked bar chart of 221 experiments: 31 of 48 null results were never written up, against 4 of 91 strong results, and 106 studies were published.

Stacked bar chart

What happened to 221 experiments, by strength of result
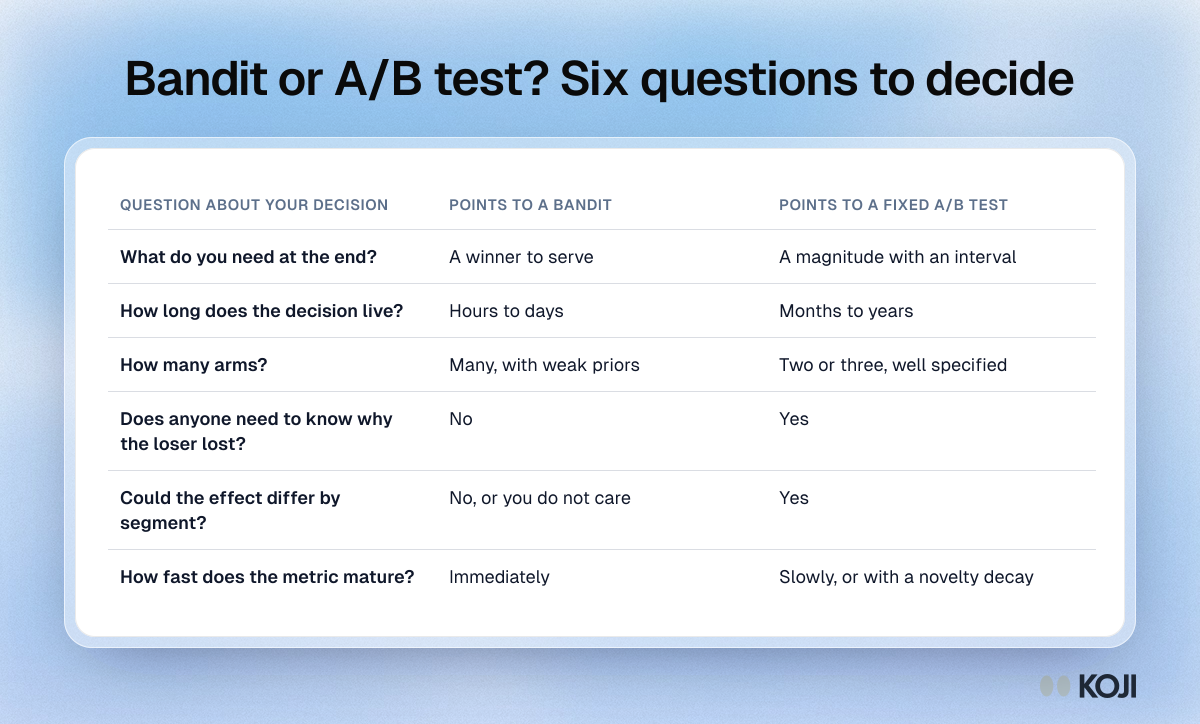
Decision table with six questions for choosing a multi-armed bandit or a fixed A/B test, such as what you need at the end and how long the decision lives.

Reference table

Bandit or A/B test? Six questions to decide
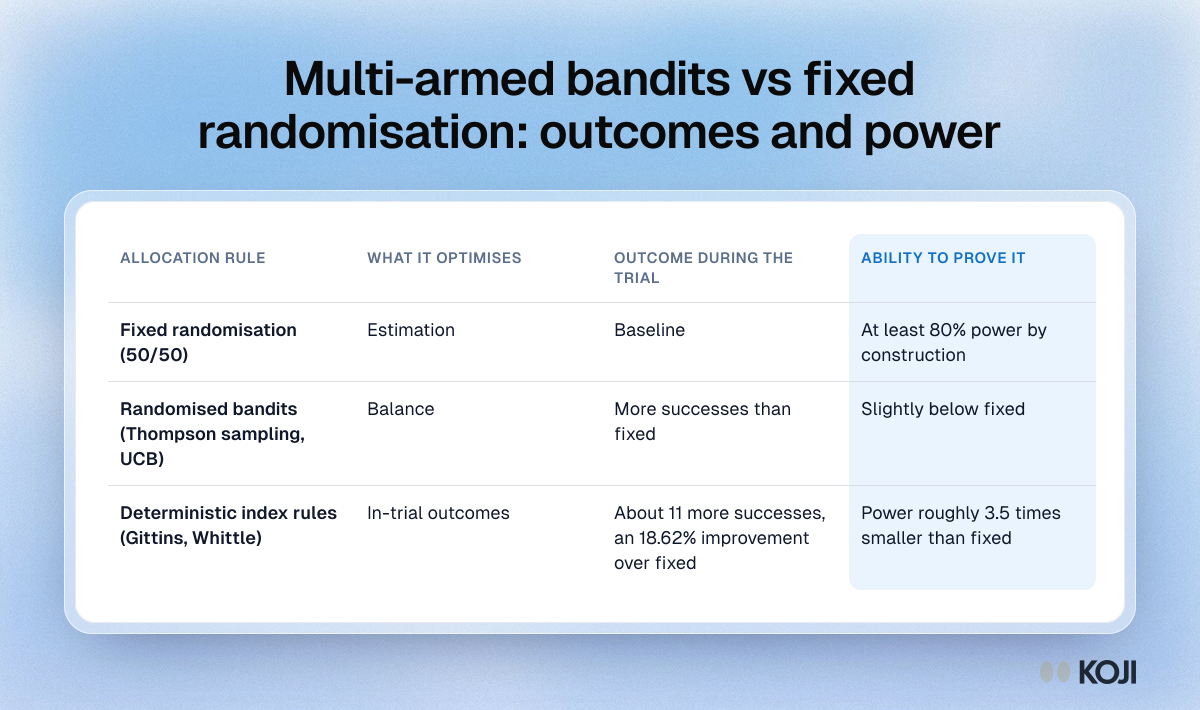
Table comparing allocation rules: fixed 50/50 keeps 80% power, while Gittins and Whittle bandits gain about 11 successes with power 3.5 times smaller.

Reference table

Multi-armed bandits vs fixed randomisation: outcomes and power
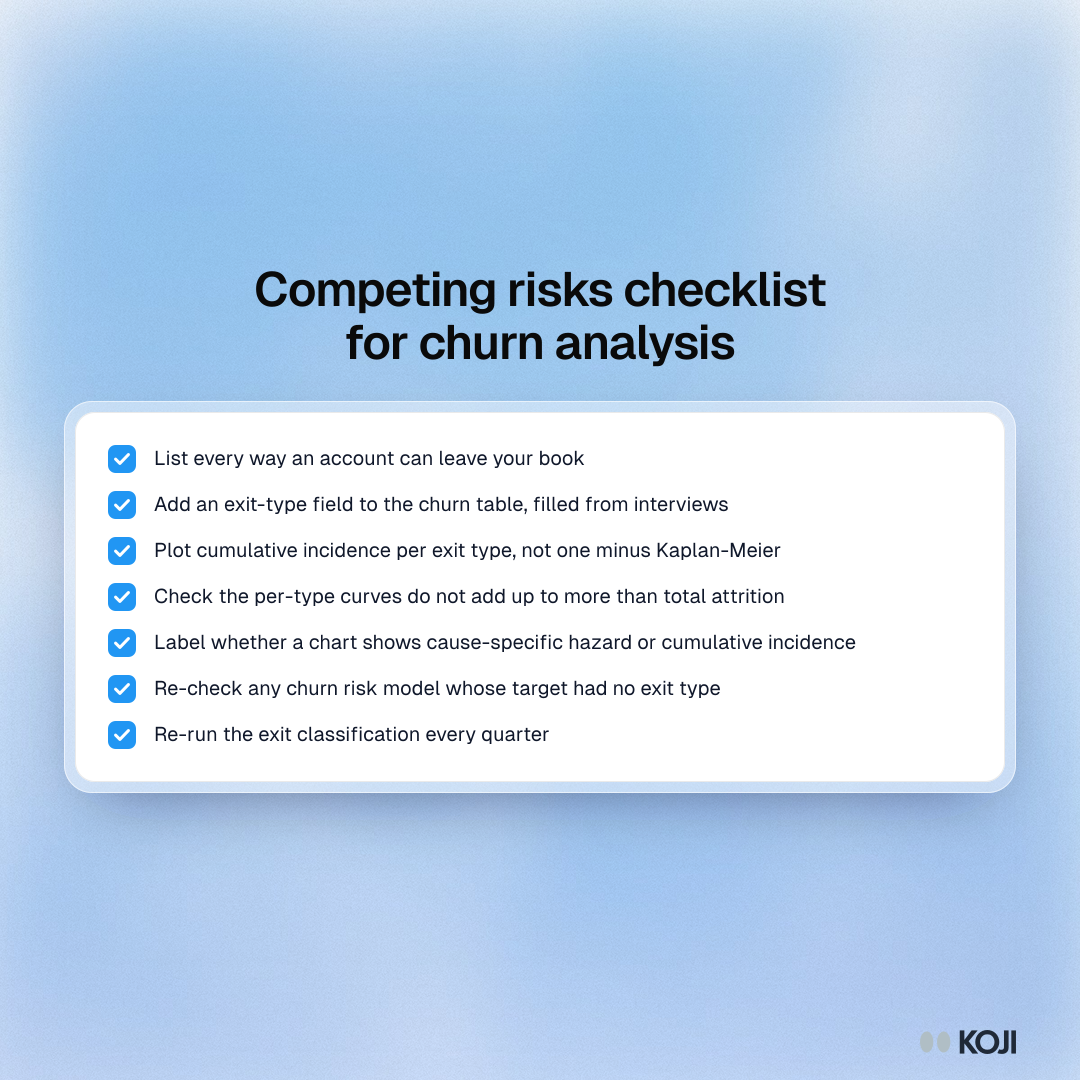
Checklist of seven steps for competing risks in churn: list exit types, record them from interviews, plot cumulative incidence and run the sum check.

Checklist

Competing risks checklist for churn analysis
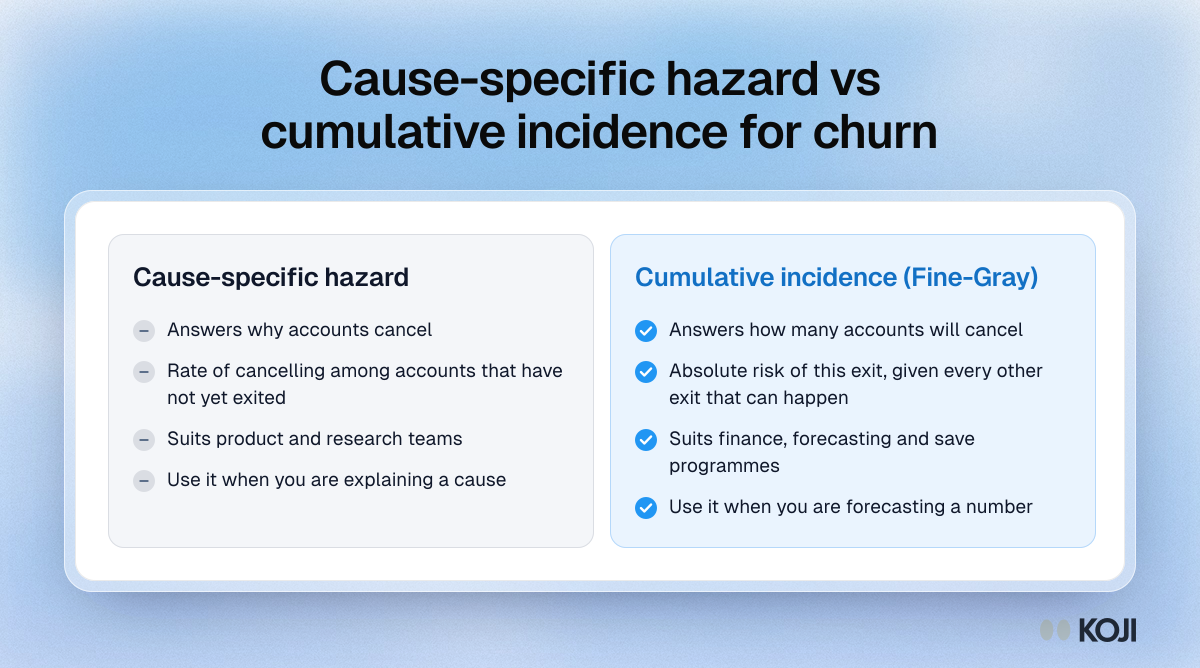
Comparison of two churn measures: cause-specific hazard explains why accounts cancel, cumulative incidence (Fine-Gray) forecasts how many will.

Comparison

Cause-specific hazard vs cumulative incidence for churn
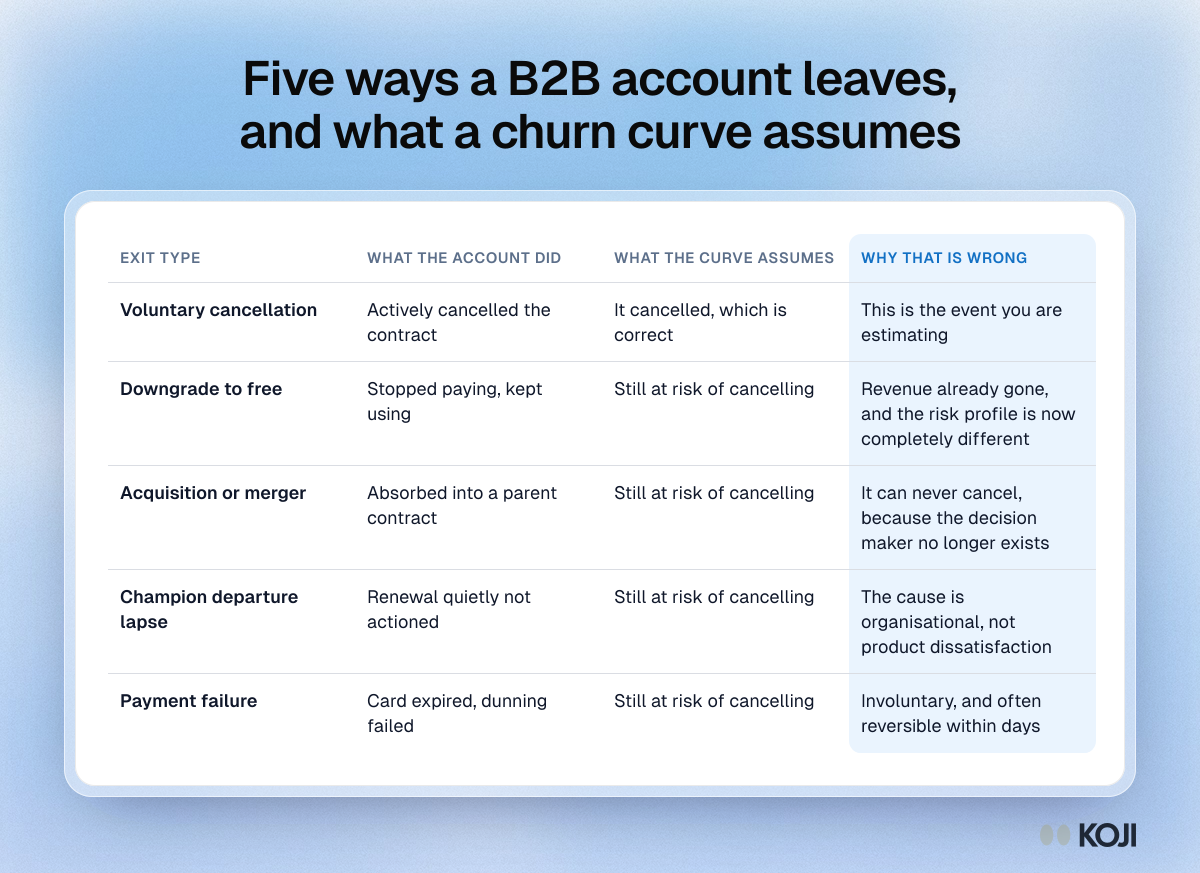
Table of five B2B churn exit types: cancellation, downgrade, acquisition, champion lapse and payment failure, with what a standard retention curve assumes.

Reference table

Five ways a B2B account leaves, and what a churn curve assumes
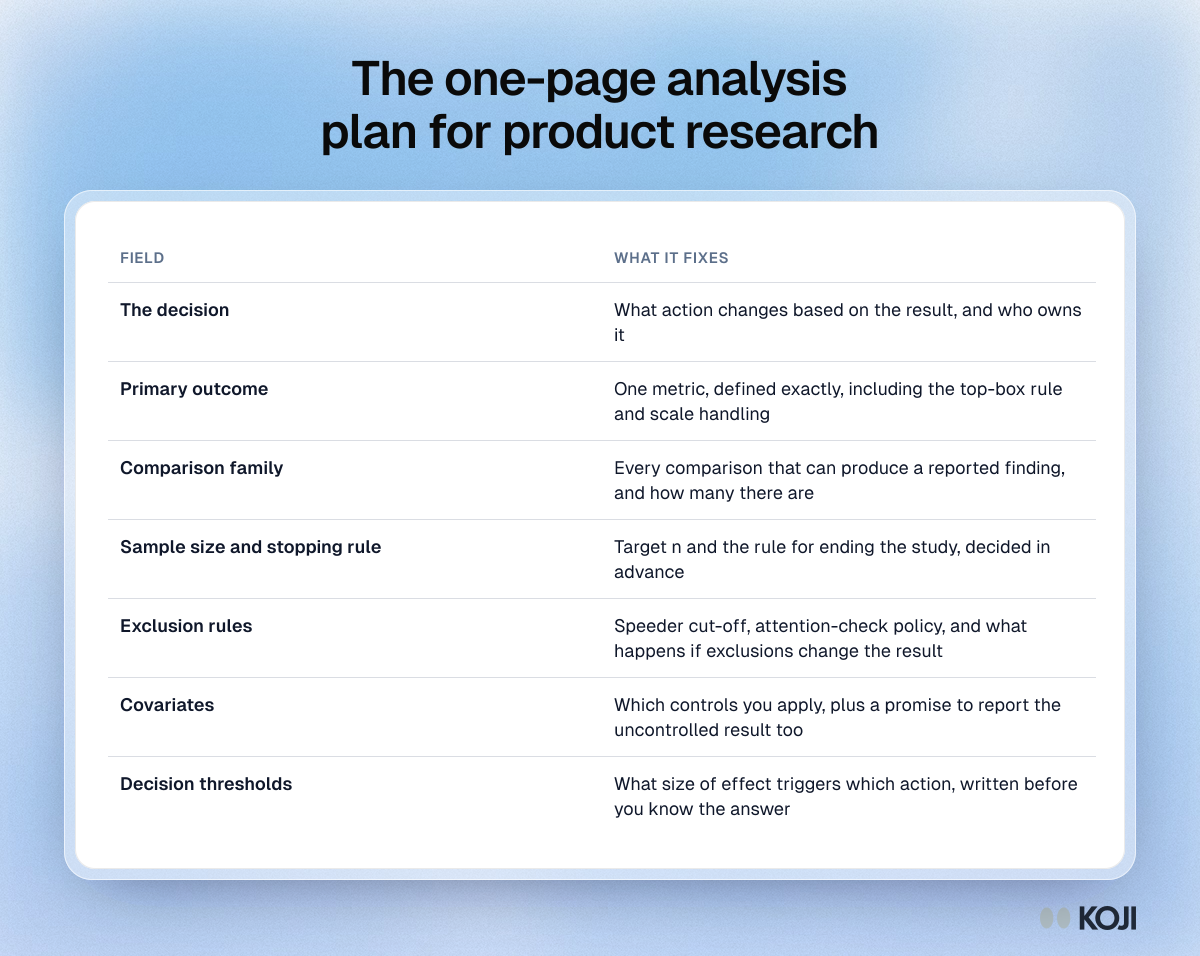
Table of a one-page analysis plan with seven fields: decision, primary outcome, comparison family, stopping rule, exclusions, covariates and thresholds.

Reference table

The one-page analysis plan for product research
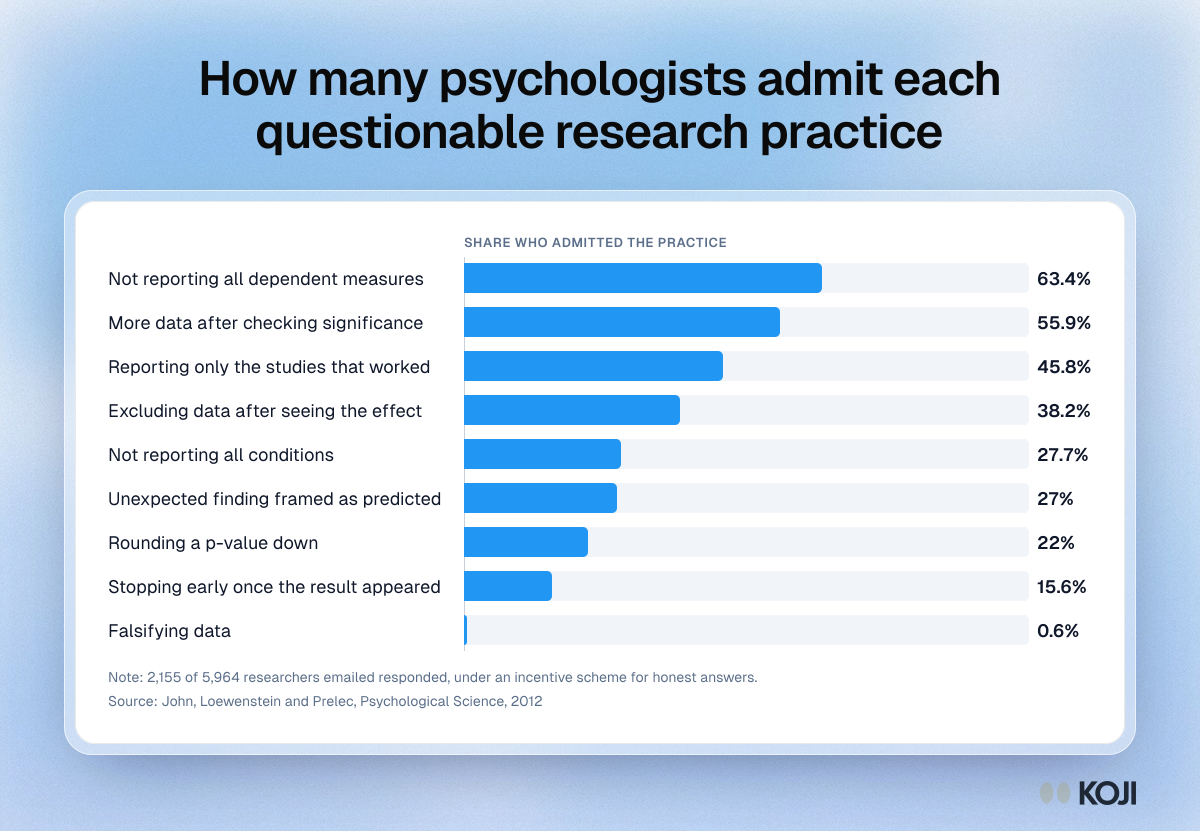
Bar chart of self-admitted research practices: 63.4% did not report all measures, 55.9% added data after checking results, 0.6% falsified data.

Bar chart

How many psychologists admit each questionable research practice
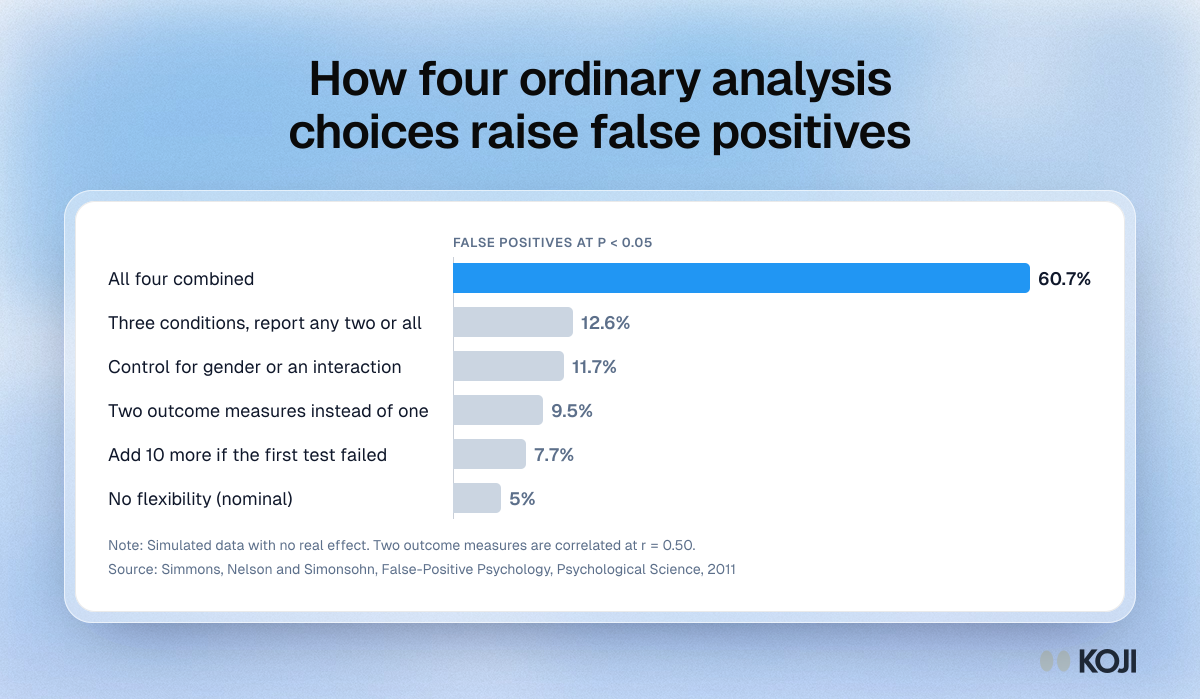
Bar chart of simulated false-positive rates: 5% with no flexibility, 7.7% to 12.6% for each single choice, and 60.7% with all four combined.

Bar chart

How four ordinary analysis choices raise false positives
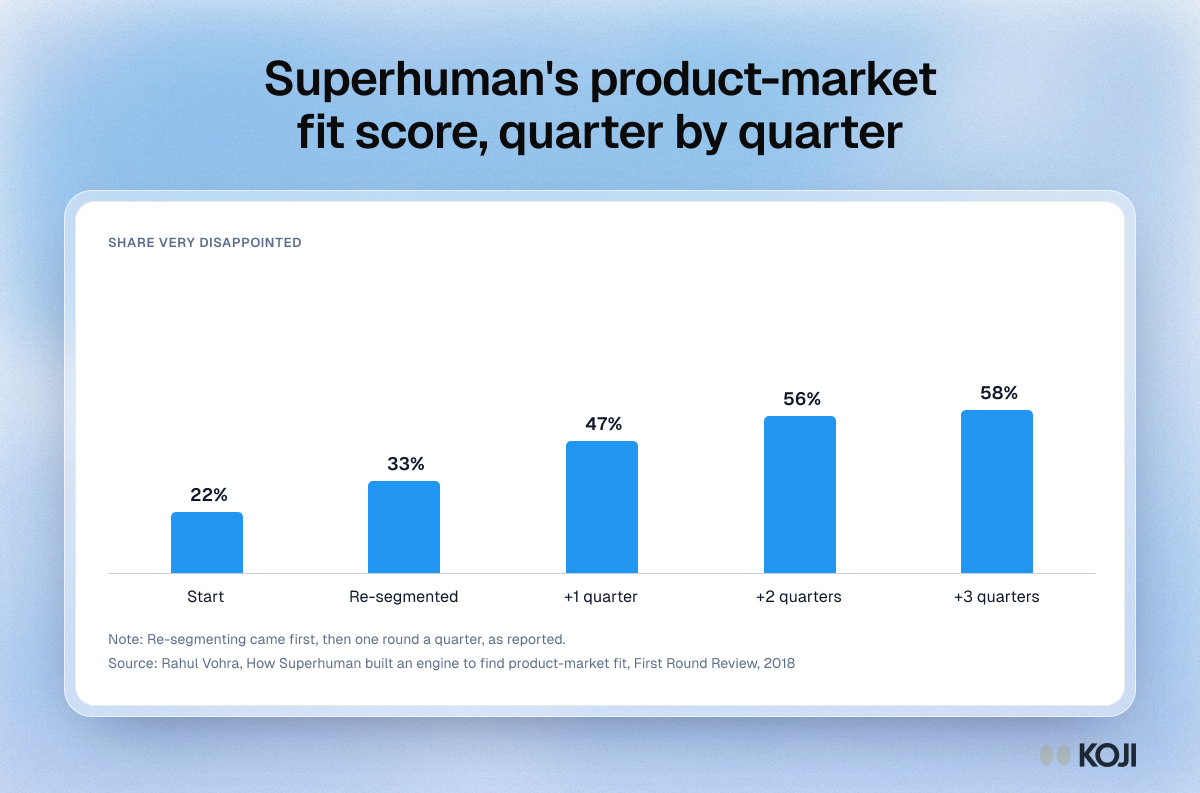
Column chart of Superhuman's very disappointed score rising from 22% to 33% after re-segmenting, then 47%, 56% and 58%.

Column chart

Superhuman's product-market fit score, quarter by quarter
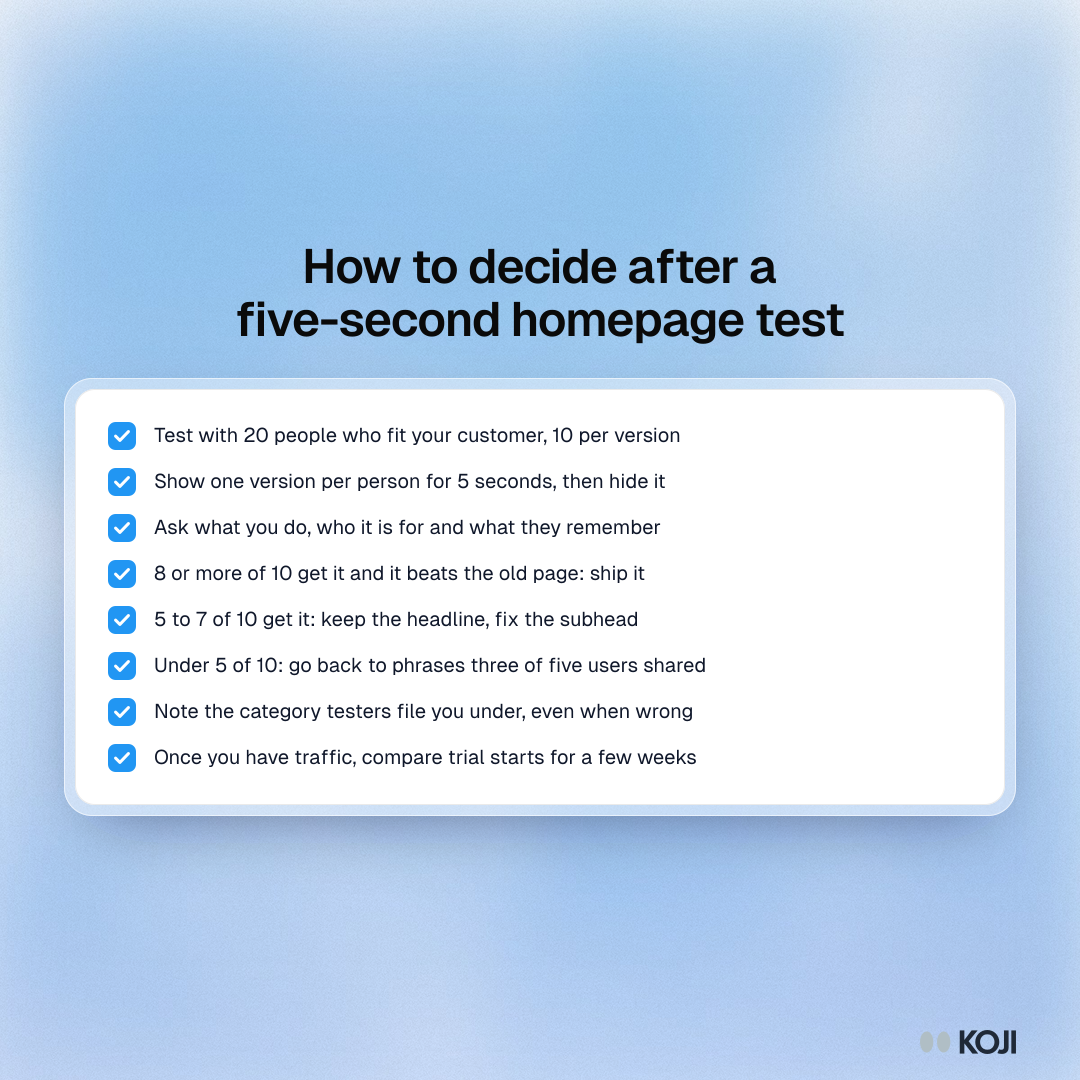
Checklist for running and reading a five-second homepage test: sample, setup, pass marks, what to change and what to track afterwards.

Checklist

How to decide after a five-second homepage test
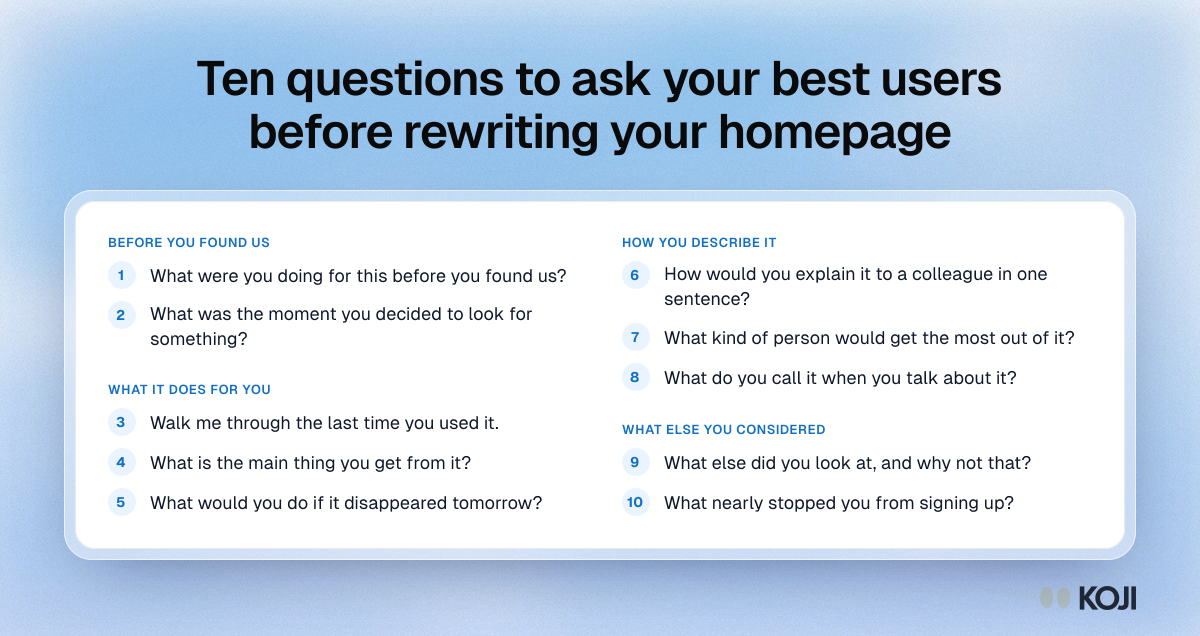
Question bank of ten interview questions for your best users, in four sections: before you found us, what it does, how you describe it, alternatives.

Question bank

Ten questions to ask your best users before rewriting your homepage
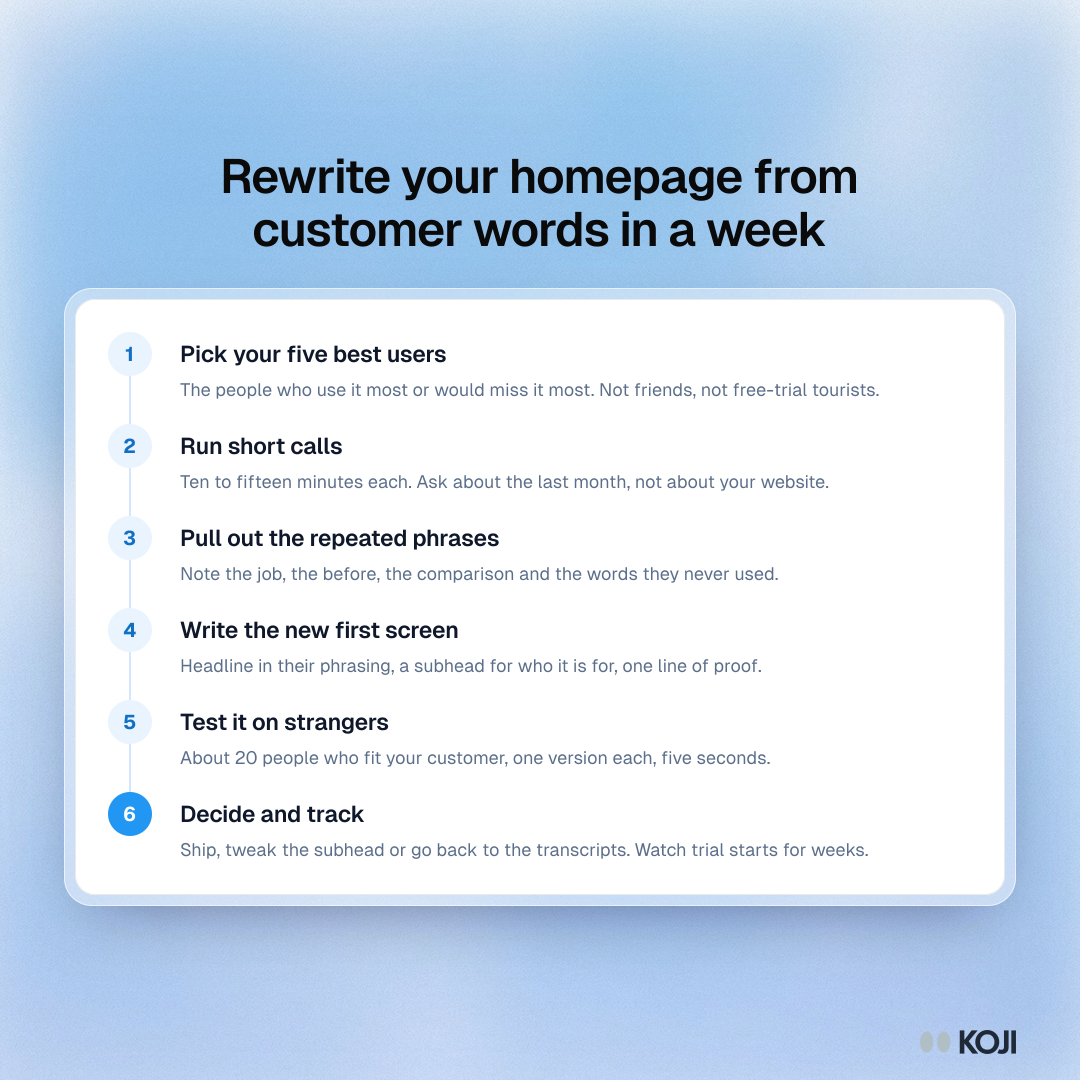
Process in six steps for rewriting a homepage from customer words: pick five best users, run calls, pull phrases, write, test, decide.

Process

Rewrite your homepage from customer words in a week
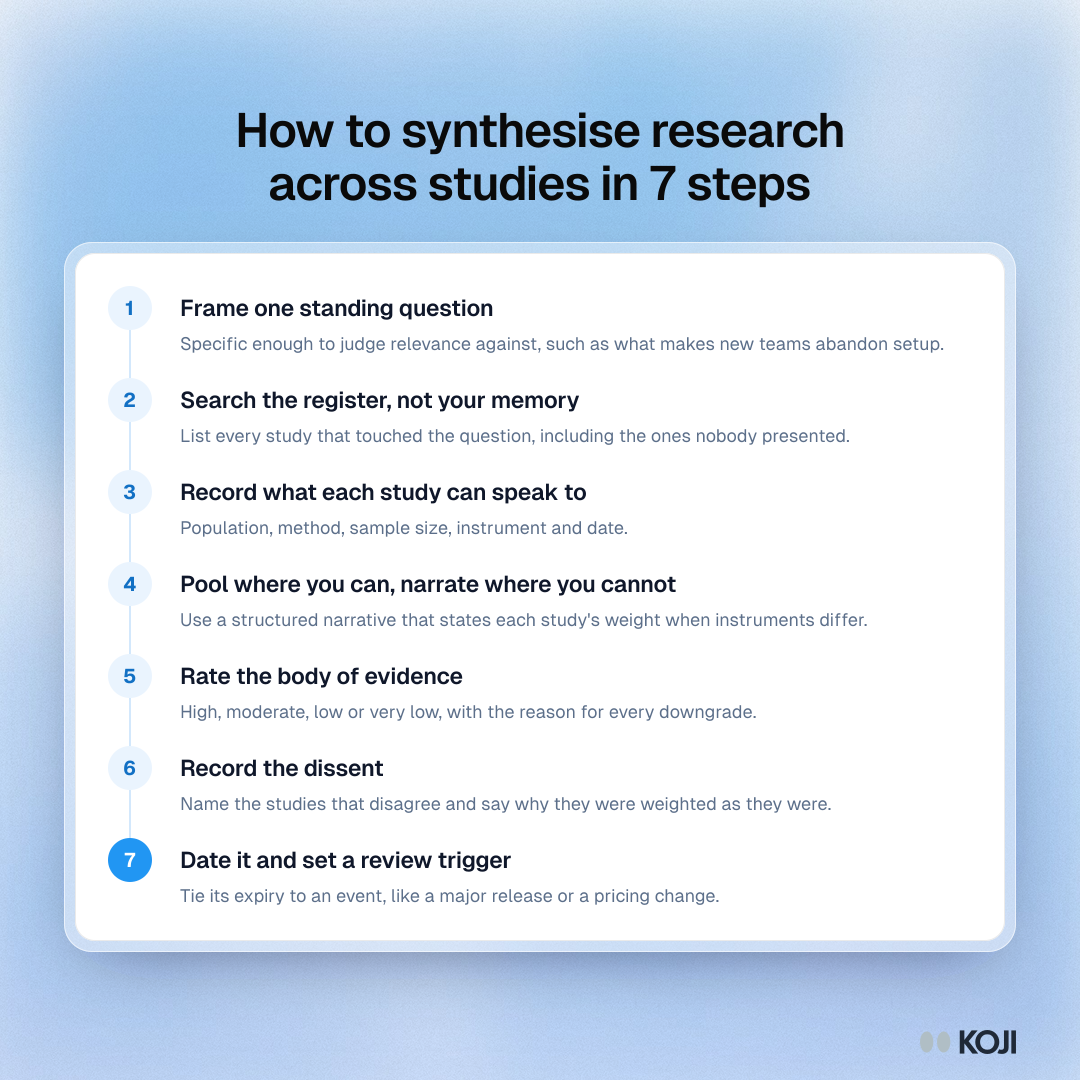
Process of seven steps for synthesising research across studies, from framing one standing question to dating it with a review trigger.

Process

How to synthesise research across studies in 7 steps
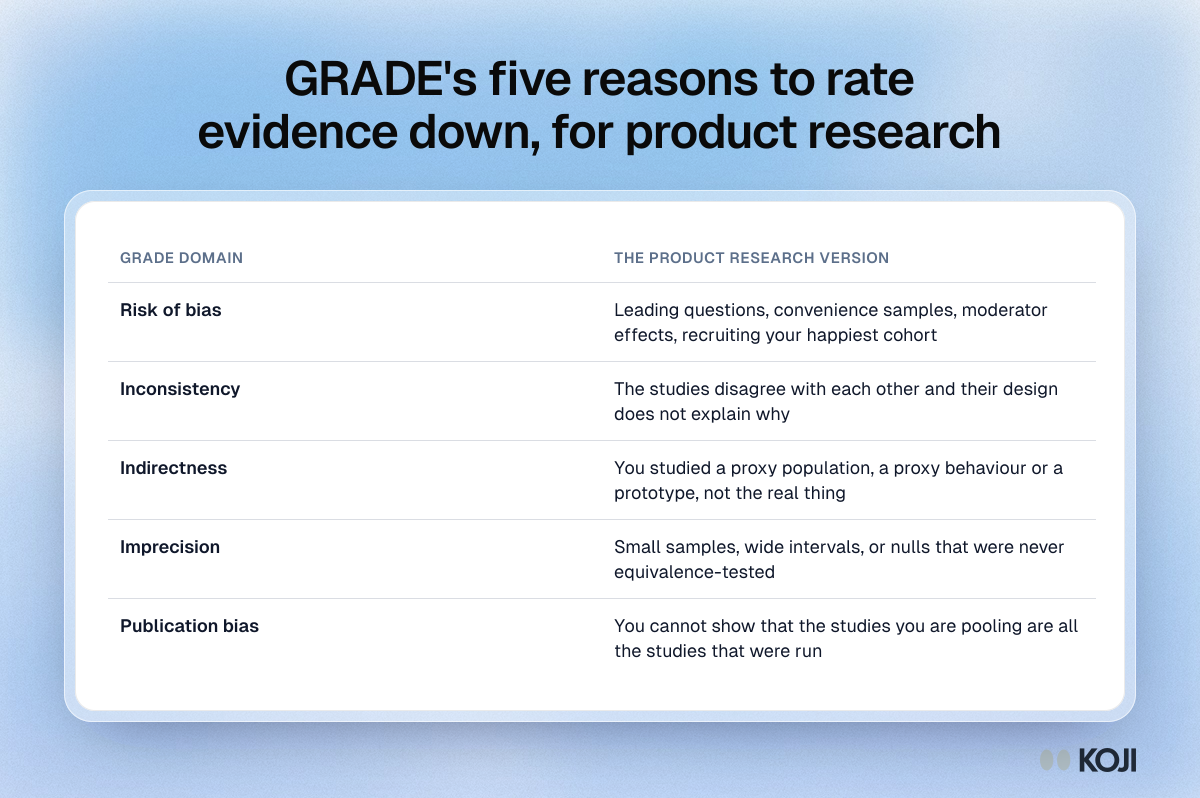
Table of the five GRADE downgrade domains (risk of bias, inconsistency, indirectness, imprecision, publication bias) applied to product research.

Reference table

GRADE's five reasons to rate evidence down, for product research
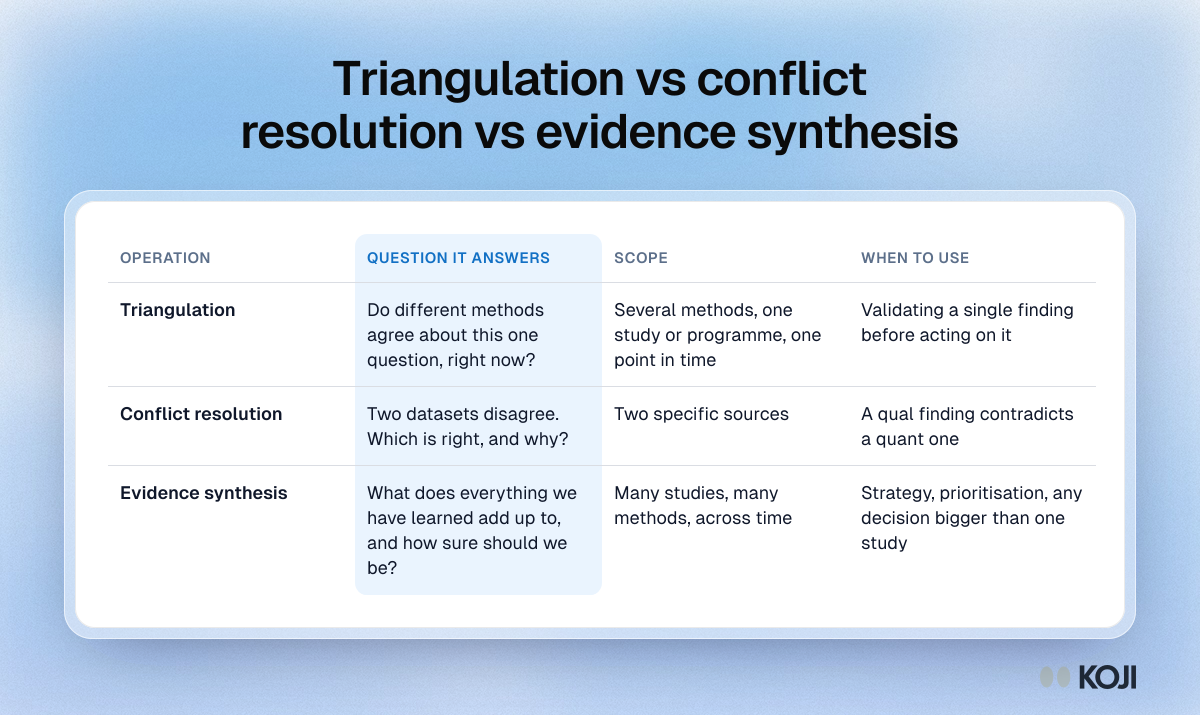
Table comparing triangulation, conflict resolution and evidence synthesis by the question each answers, its scope and when to use it.

Reference table

Triangulation vs conflict resolution vs evidence synthesis
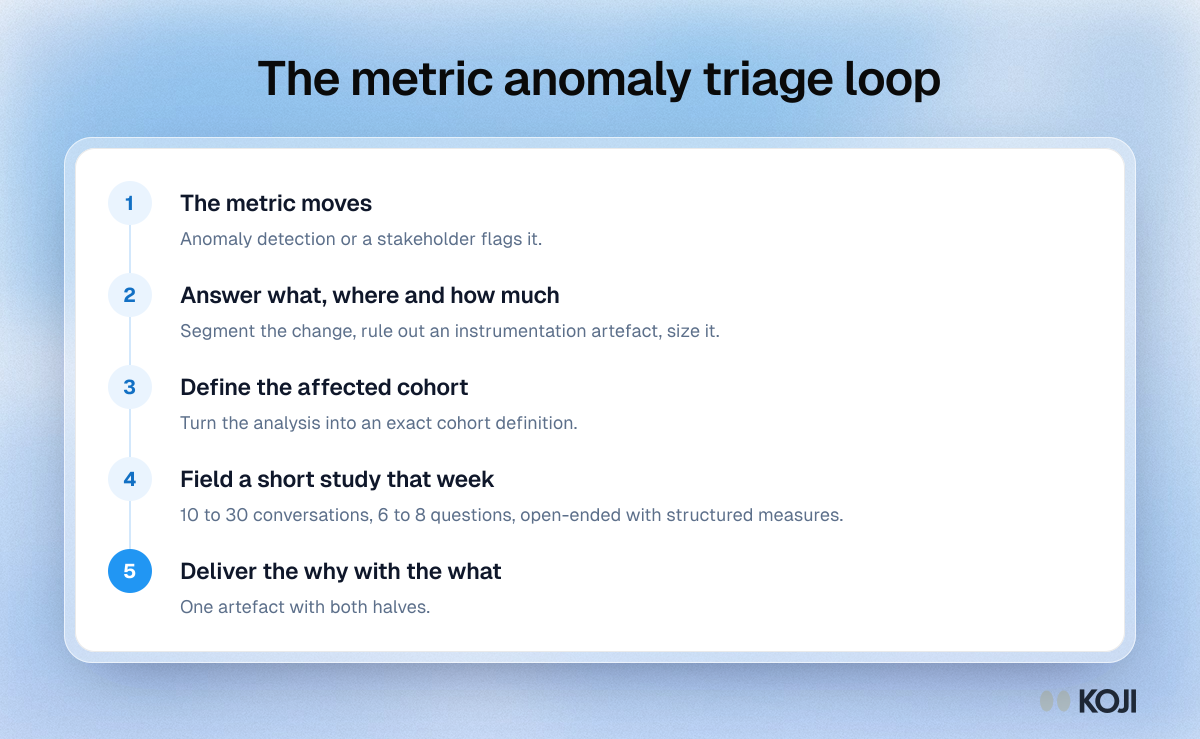
Process diagram of the metric anomaly triage loop in five steps, from a metric moving to delivering the why alongside the what.

Process

The metric anomaly triage loop
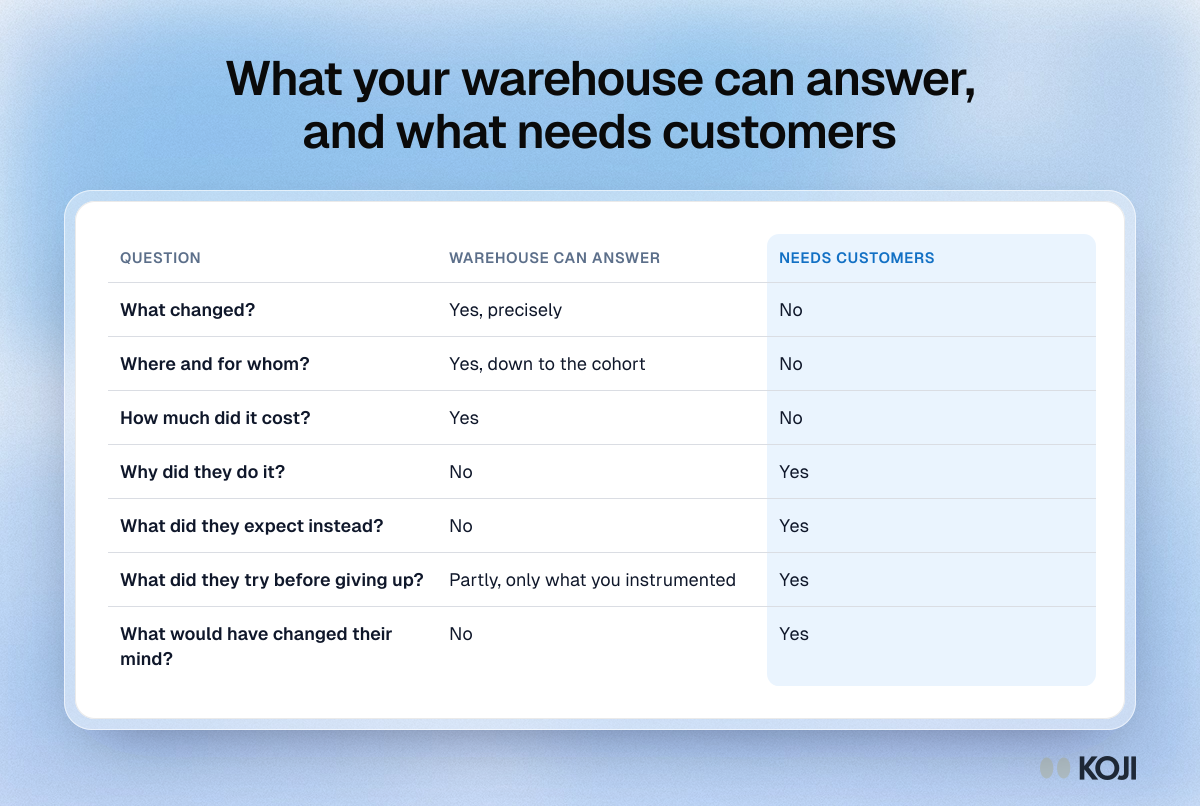
Table of seven questions about a metric change, showing the warehouse answers what, where and how much, while why needs customers.

Reference table

What your warehouse can answer, and what needs customers
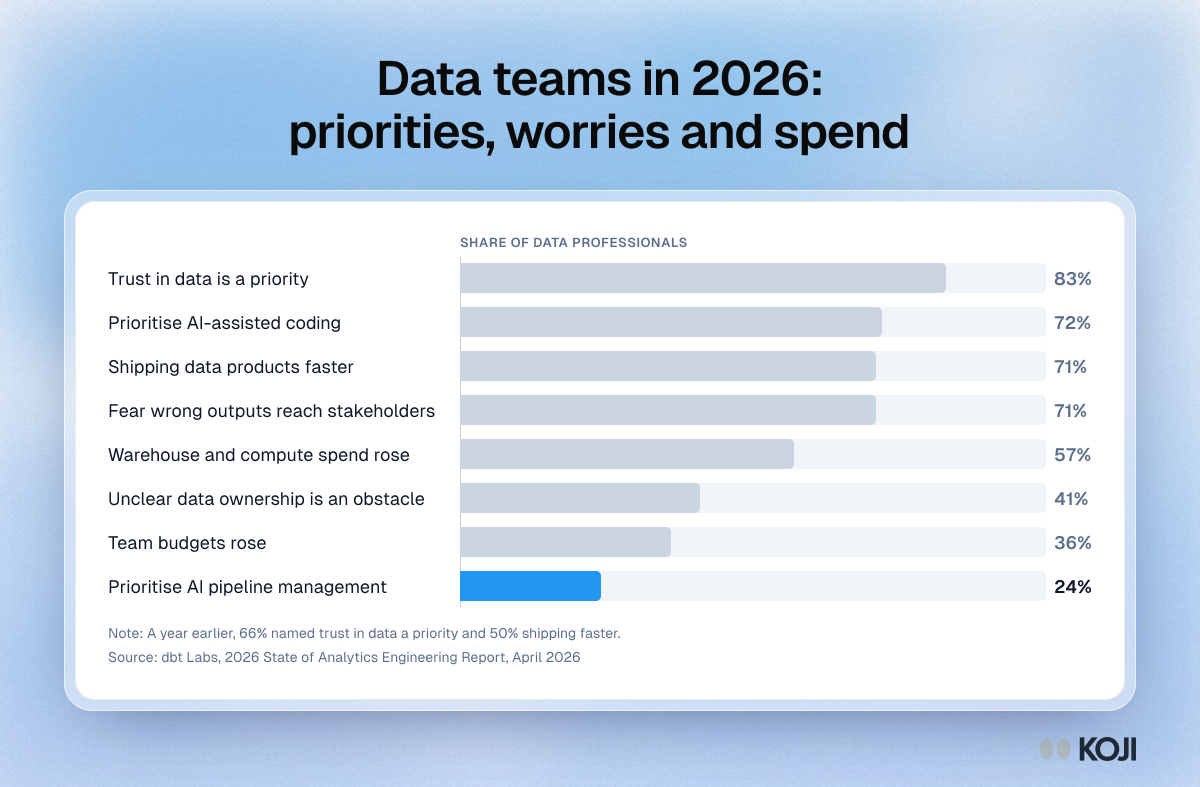
Bar chart from the 2026 State of Analytics Engineering Report: 72% prioritise AI-assisted coding, but only 24% AI pipeline management.

Bar chart

Data teams in 2026: priorities, worries and spend
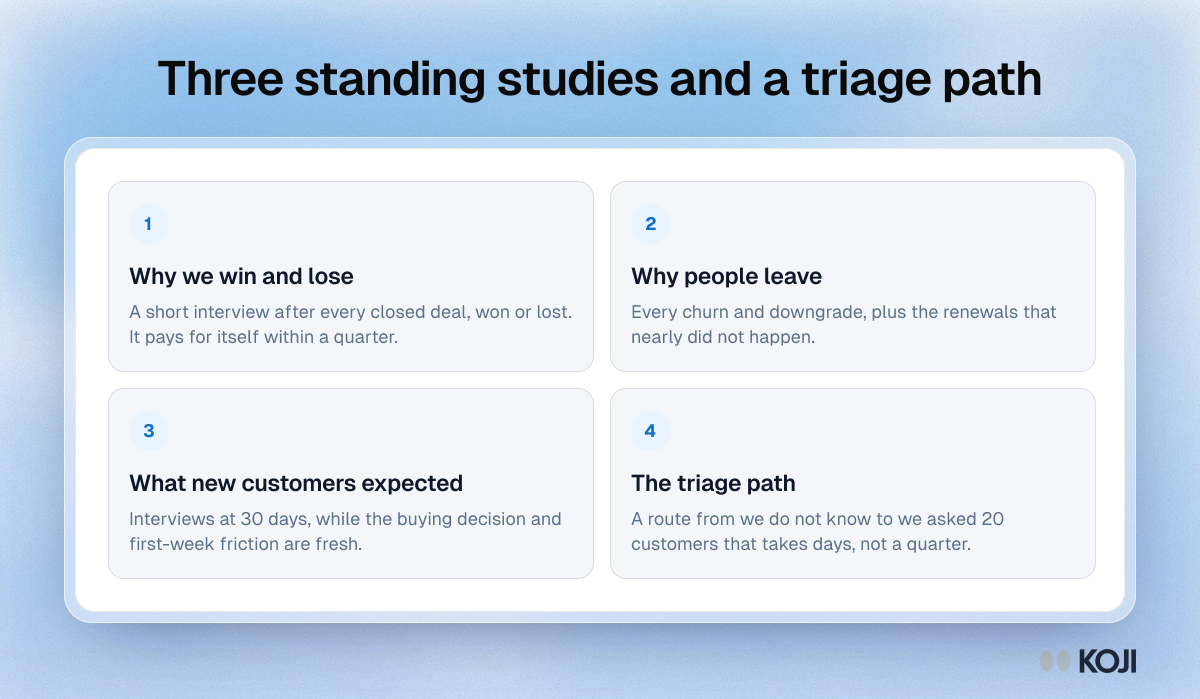
Framework of three always-on customer research studies (win and loss, churn, 30-day new customer) plus a triage path for urgent questions.

Framework

Three standing studies and a triage path
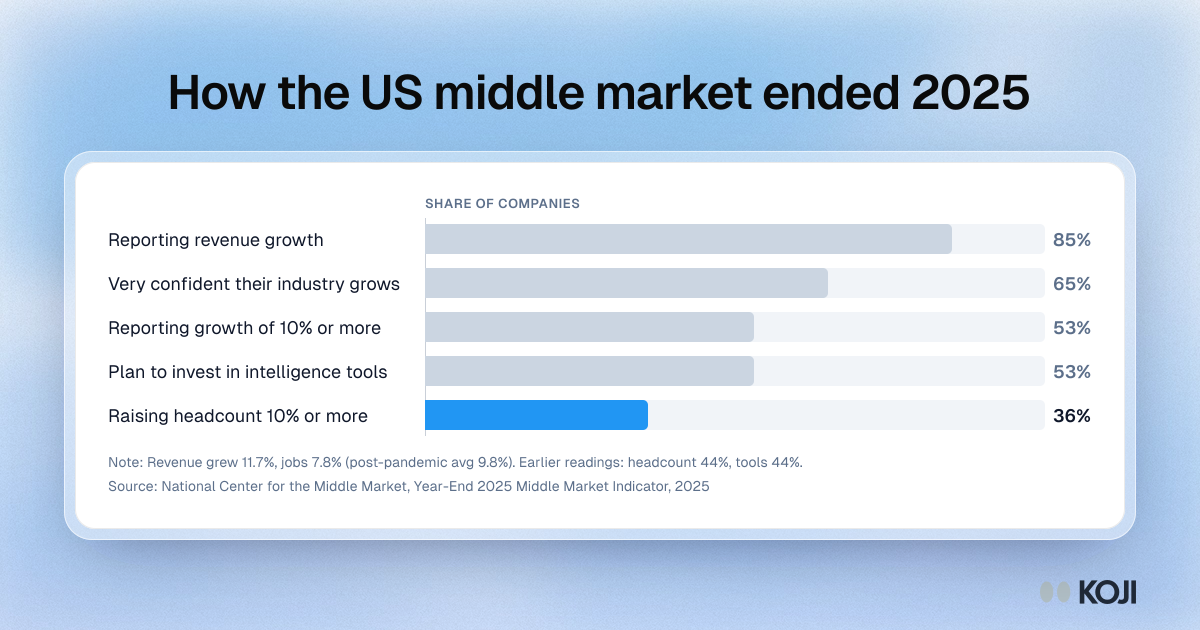
Bar chart of the Year-End 2025 Middle Market Indicator: 85% of firms grew revenue, while only 36% raised headcount by 10% or more.

Bar chart

How the US middle market ended 2025
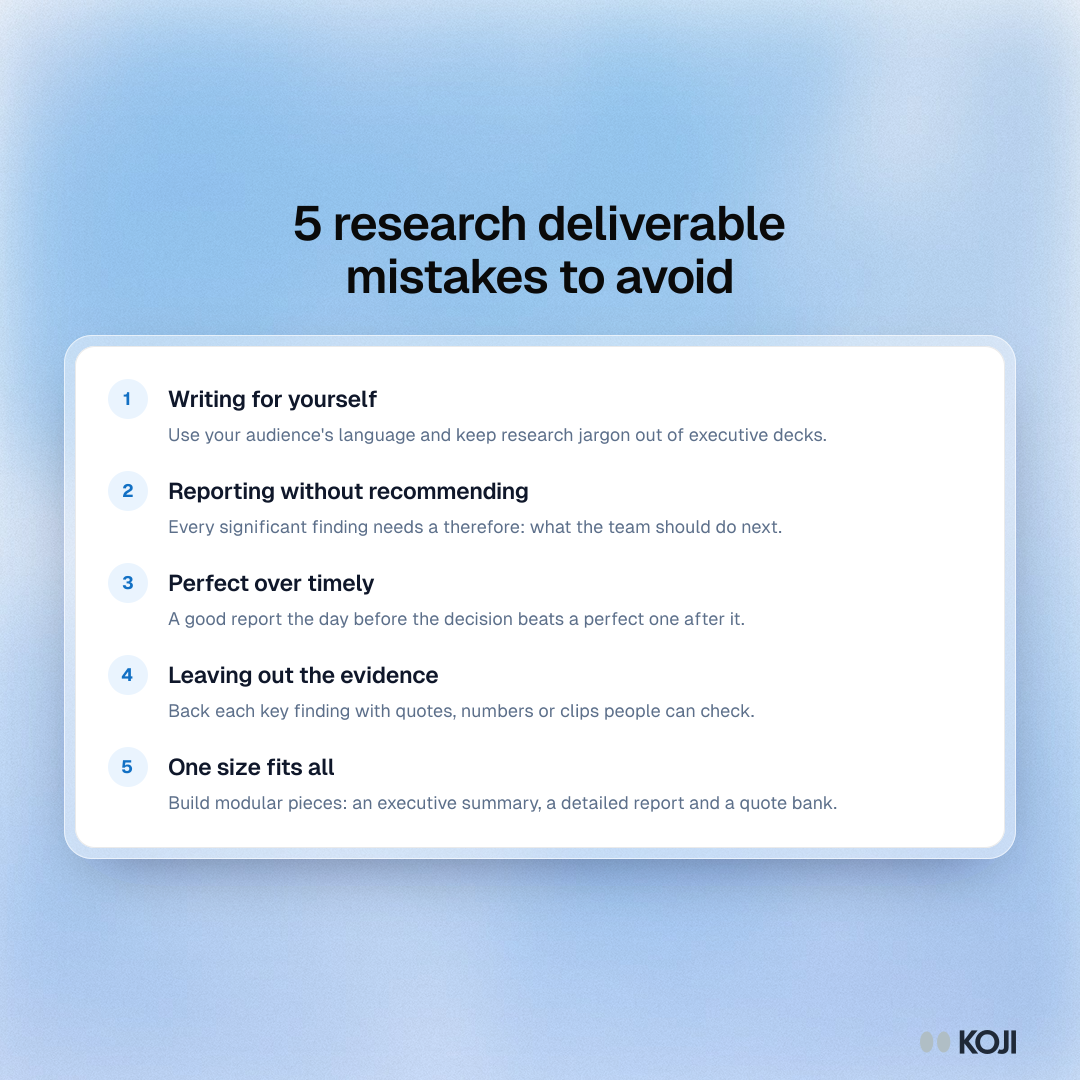
Listicle of five research deliverable mistakes: writing for yourself, no recommendations, perfect over timely, no evidence, one format for all.

Guide

5 research deliverable mistakes to avoid