Free to save and share

Frameworks and cheat sheets for customer research

Every framework, checklist and comparison from our guides, as an image you can download, drop into a deck or share with your team.
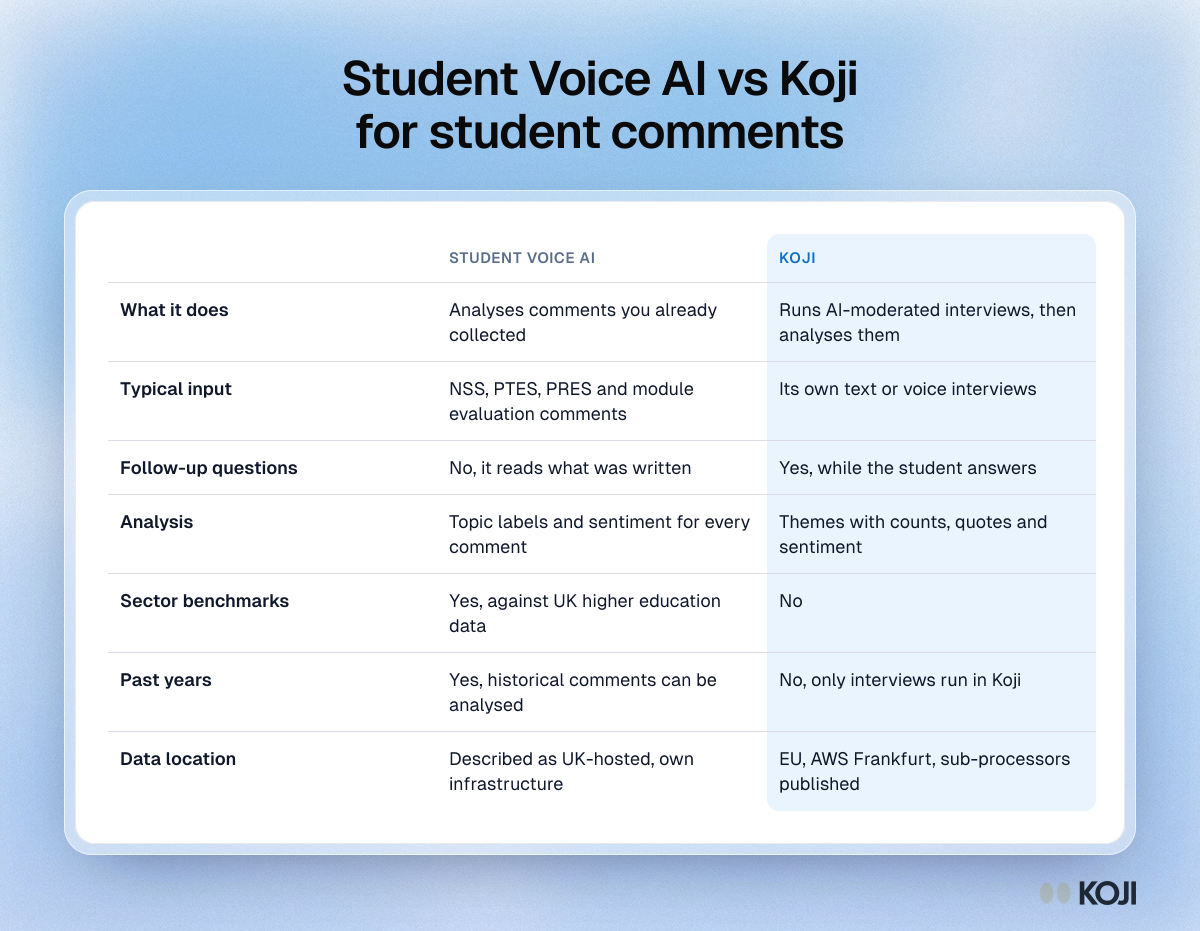
Table comparing Student Voice AI and Koji: what each does, inputs, follow-up questions, analysis, benchmarks, past data and data location.

Reference table

Student Voice AI vs Koji for student comments
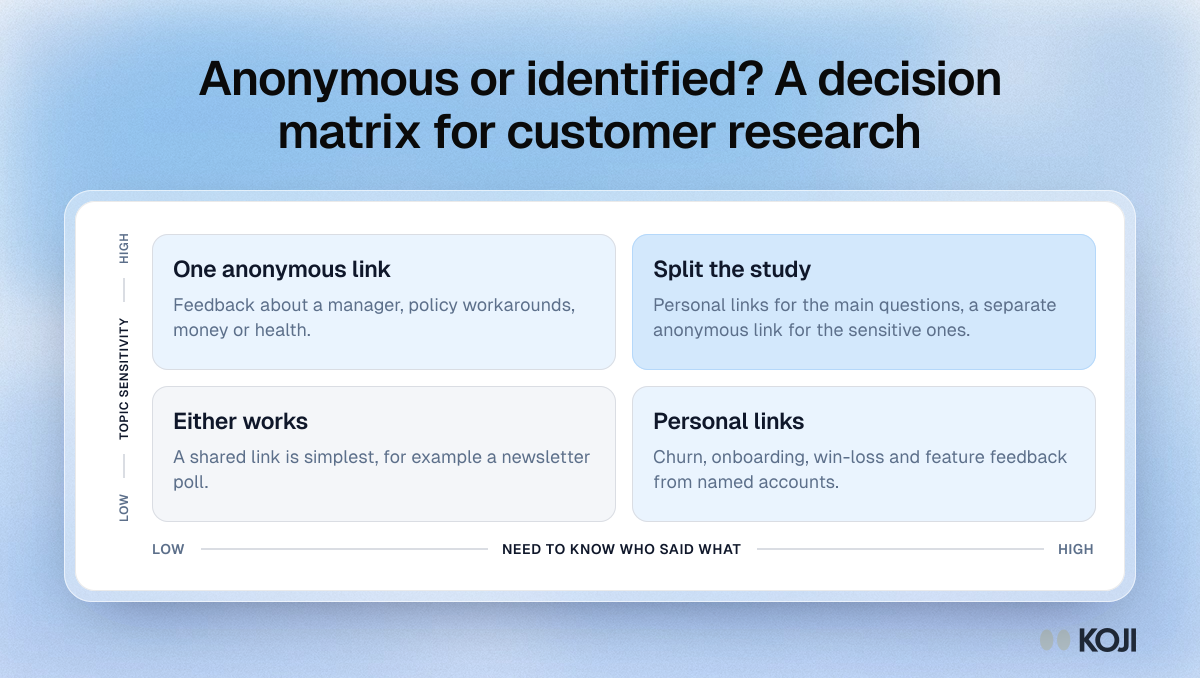
Matrix for choosing anonymous or identified customer research by topic sensitivity and the need to know who said what.

Matrix

Anonymous or identified? A decision matrix for customer research
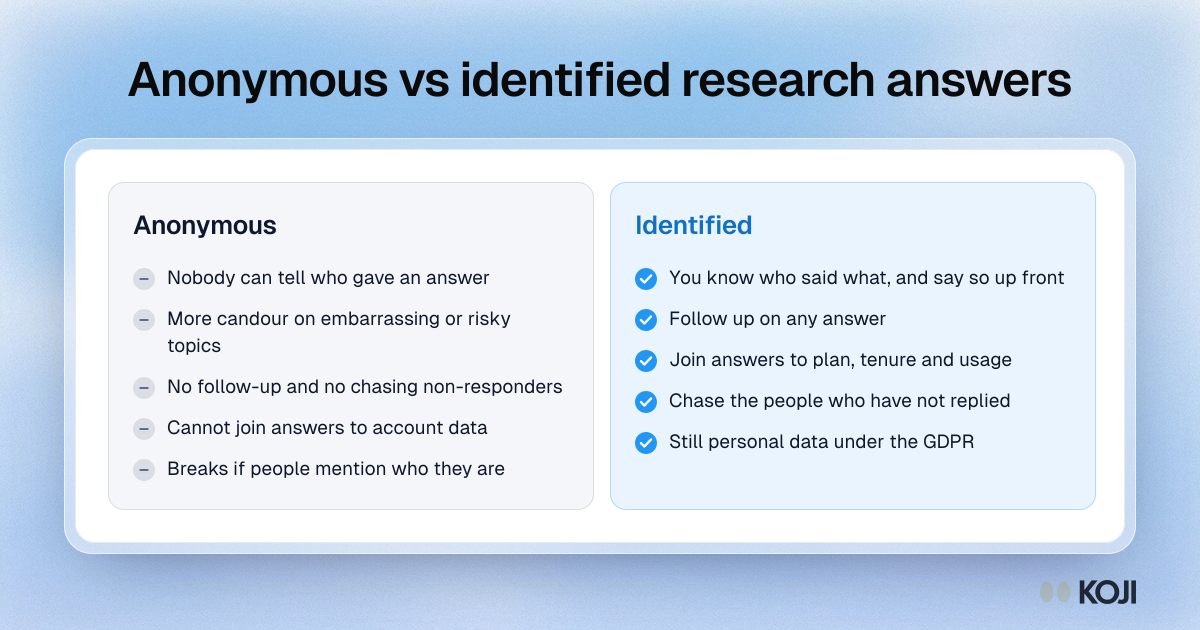
Comparison of anonymous and identified research answers: what each lets you do, what each costs and when to use it.

Comparison

Anonymous vs identified research answers
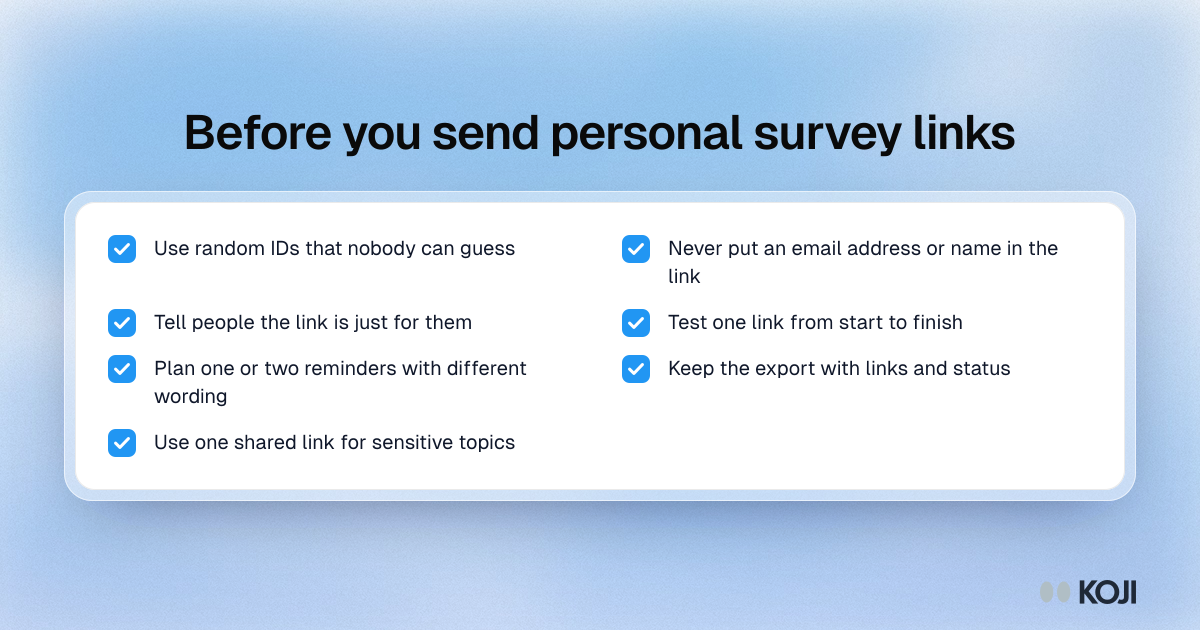
Checklist of seven things to do before sending personal survey or interview links, from random IDs to a shared link for sensitive topics.

Checklist

Before you send personal survey links
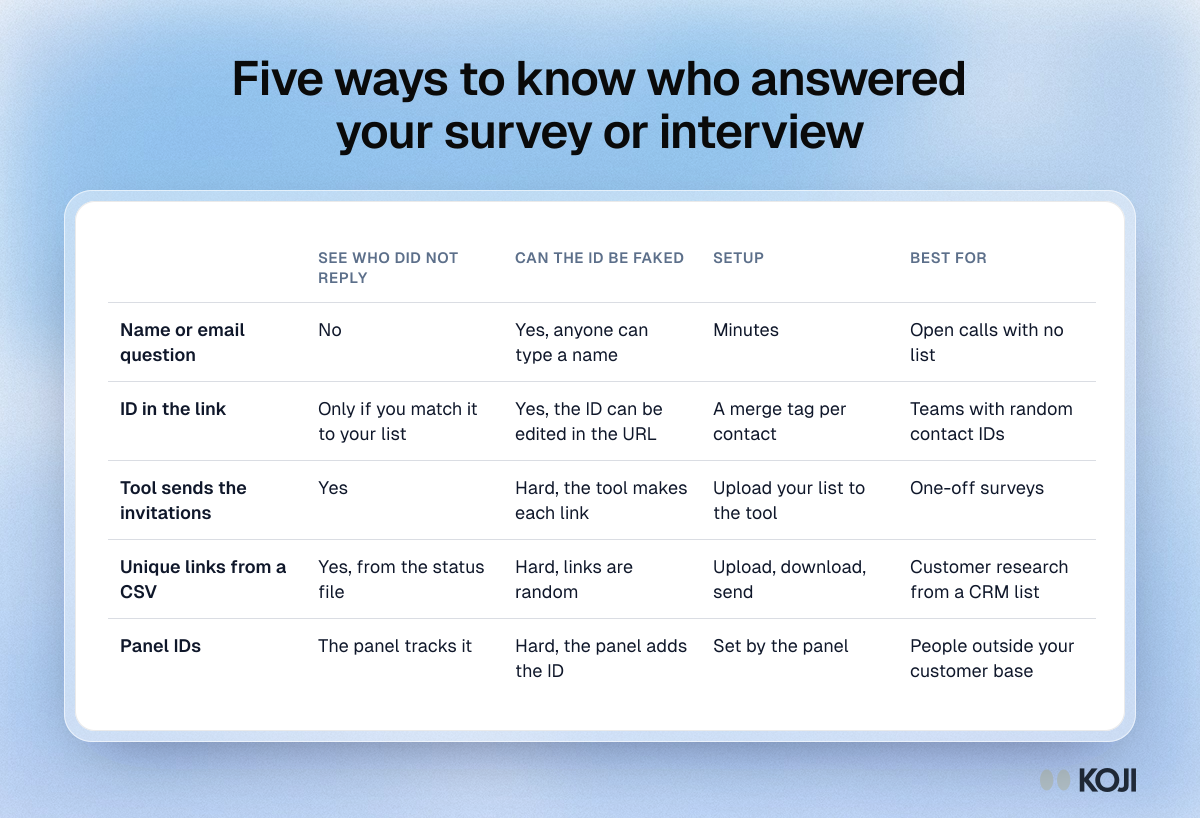
Table comparing five ways to tie survey or interview answers to people, by whether you see non-responders, whether IDs can be faked, setup and best use.

Reference table

Five ways to know who answered your survey or interview
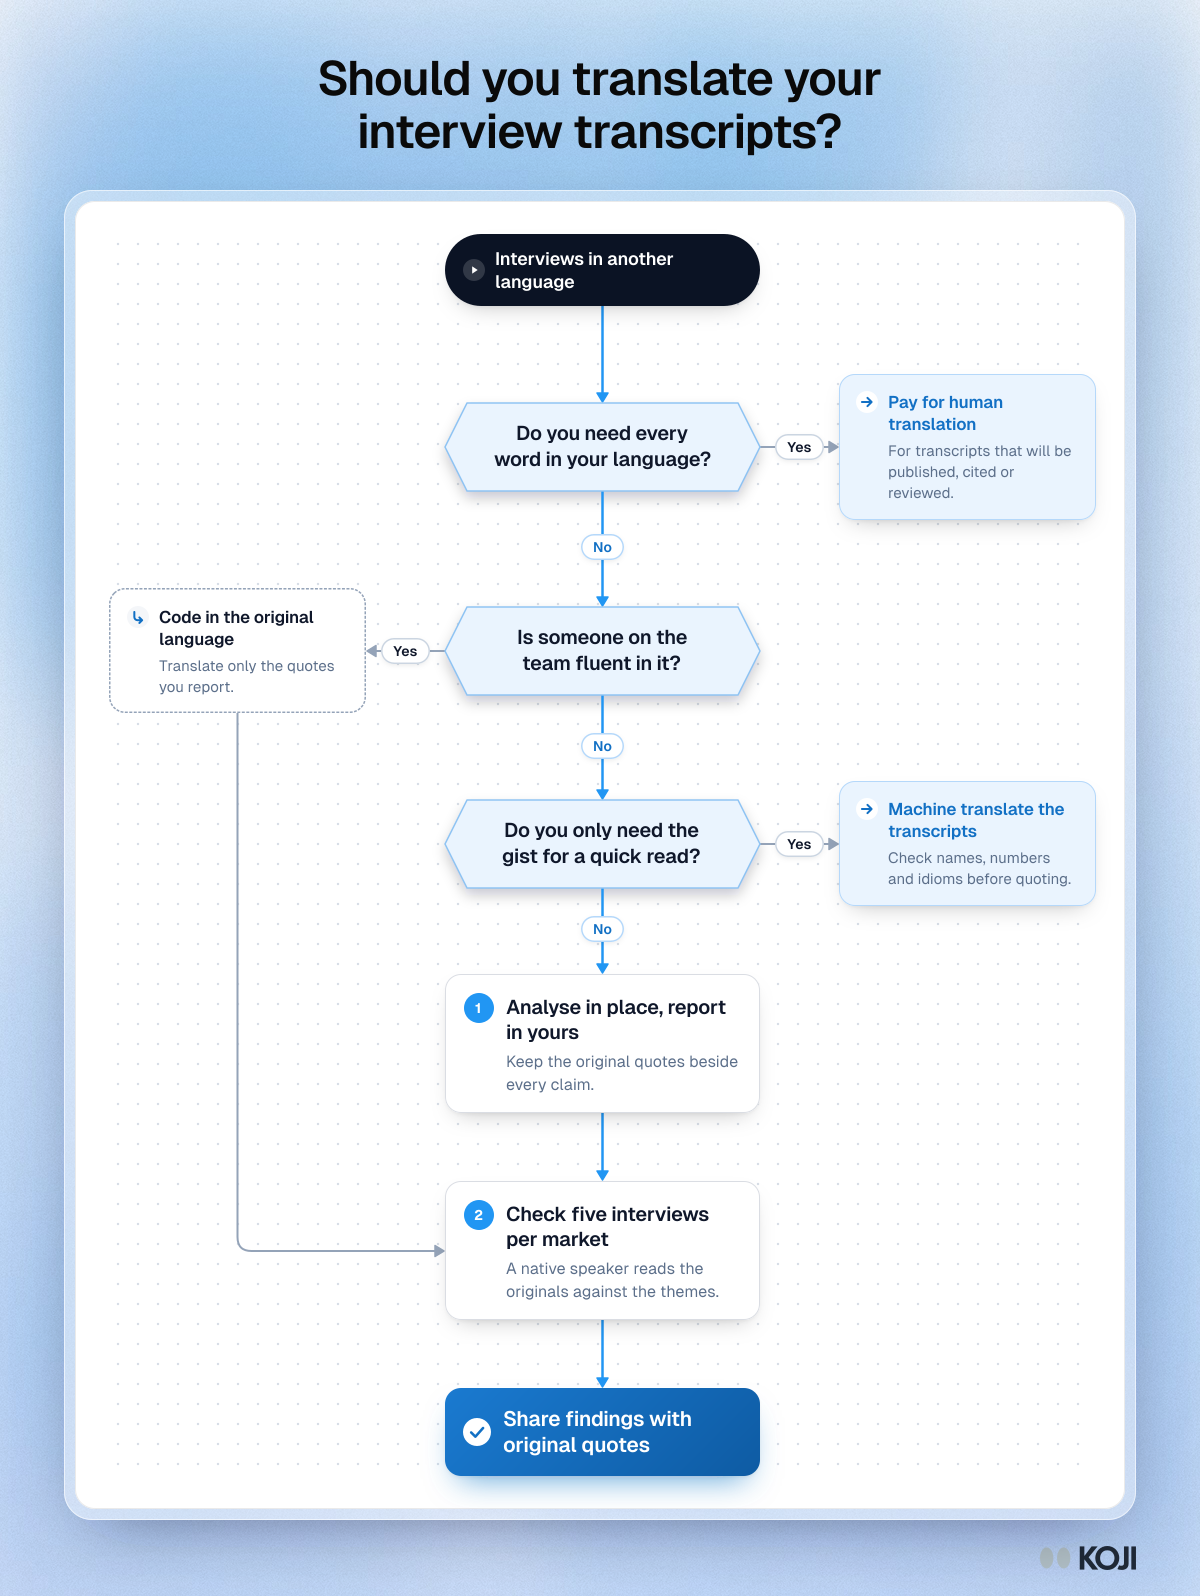
Flowchart for handling interview transcripts in another language: three questions leading to human translation, machine translation or analysis in place.

Flowchart

Should you translate your interview transcripts?
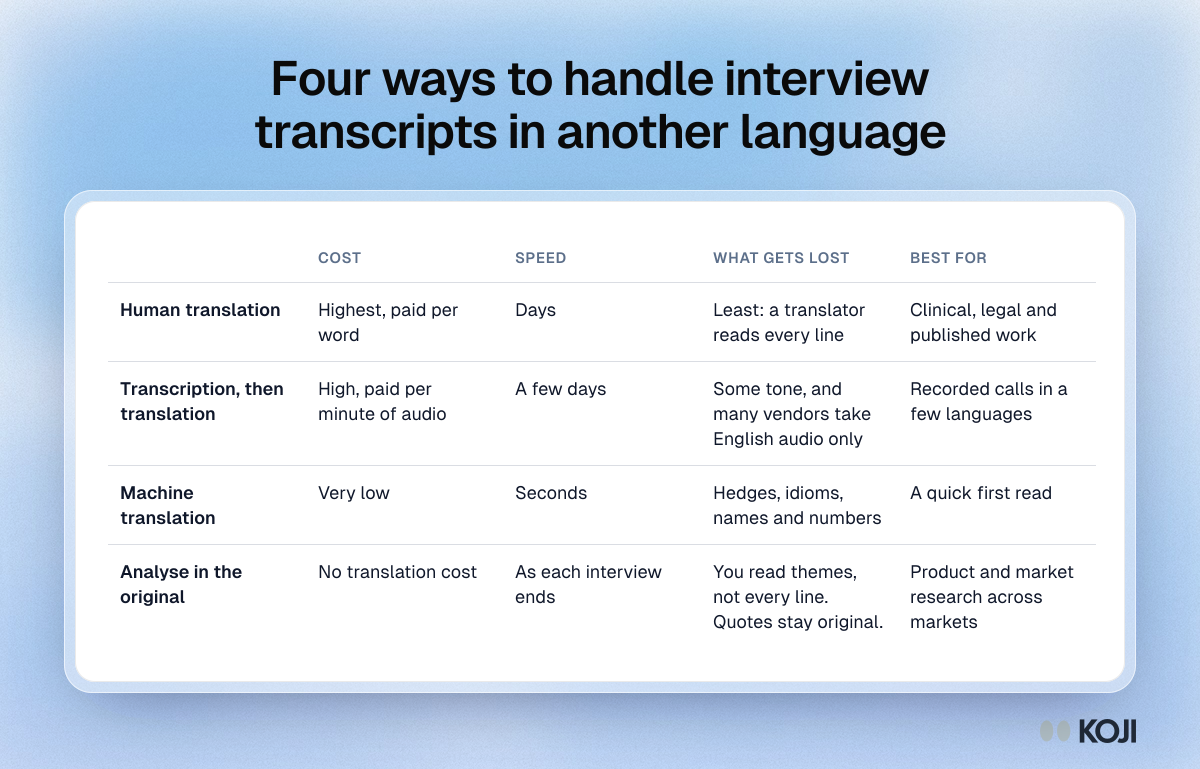
Table comparing four ways to handle interview transcripts in another language by cost, speed, what gets lost and who each suits.
Reference table

Four ways to handle interview transcripts in another language

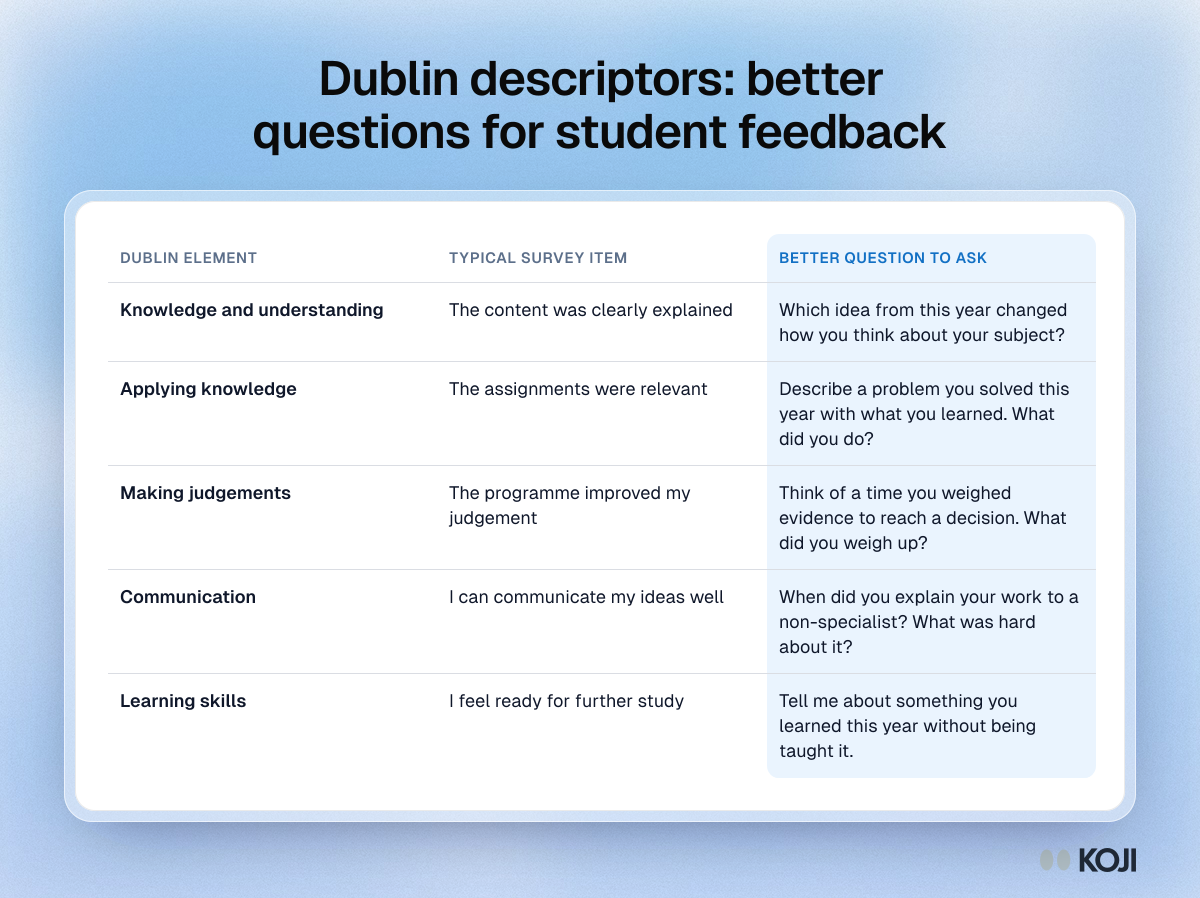
Table mapping the five Dublin descriptor elements to a typical course evaluation item and a better question that asks students for a concrete episode.

Reference table

Dublin descriptors: better questions for student feedback
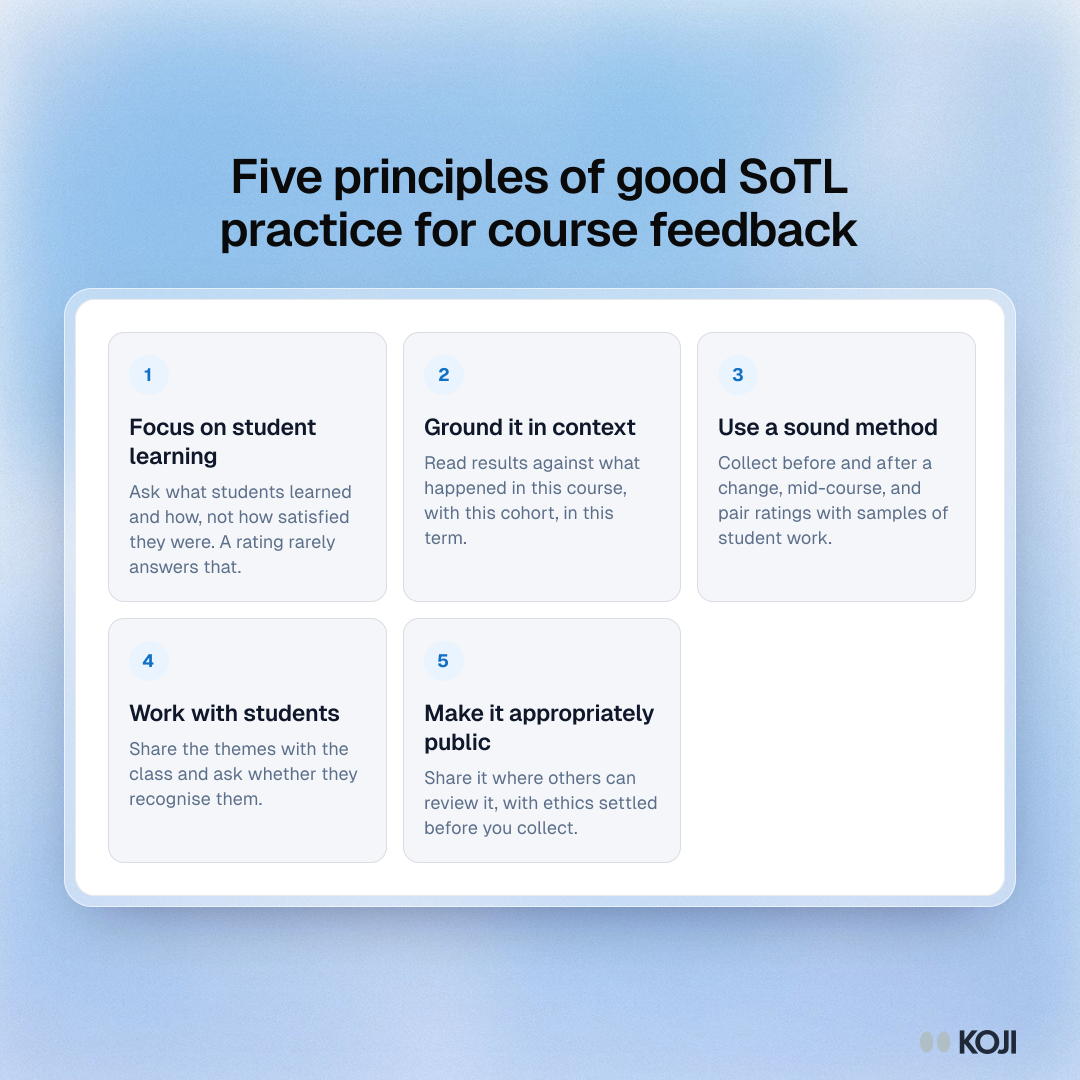
Framework applying Peter Felten's five principles of good SoTL practice to course evaluation data, from a learning question to appropriately public results.

Framework

Five principles of good SoTL practice for course feedback
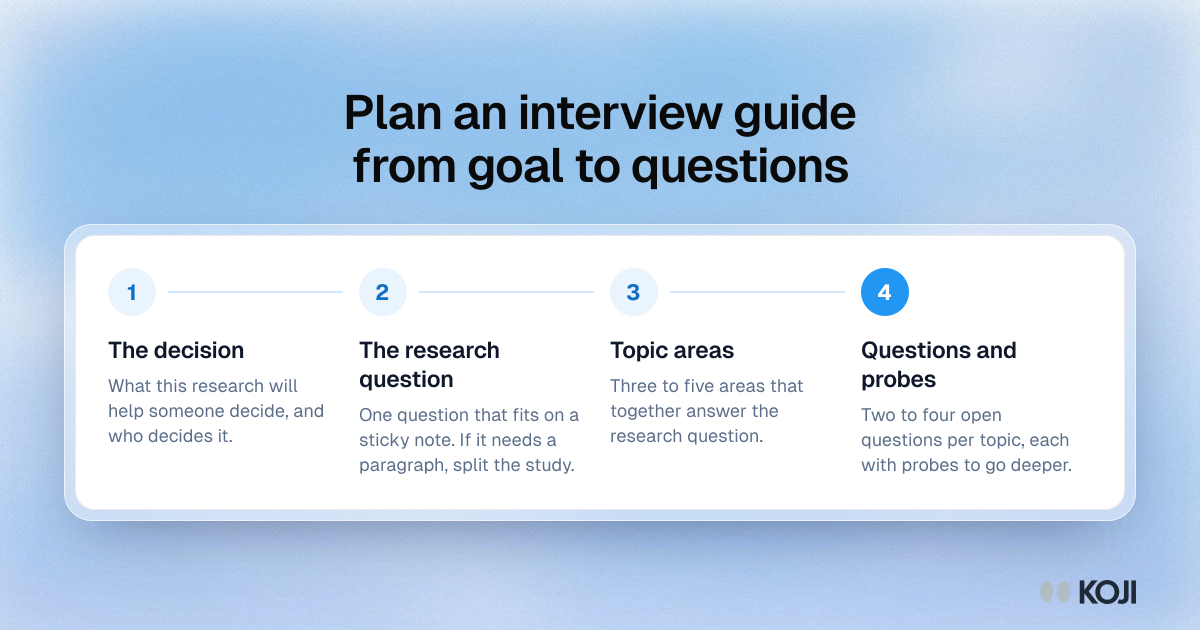
Process for planning a user interview guide in four layers: decision, research question, three to five topic areas, then questions and probes.

Process

Plan an interview guide from goal to questions
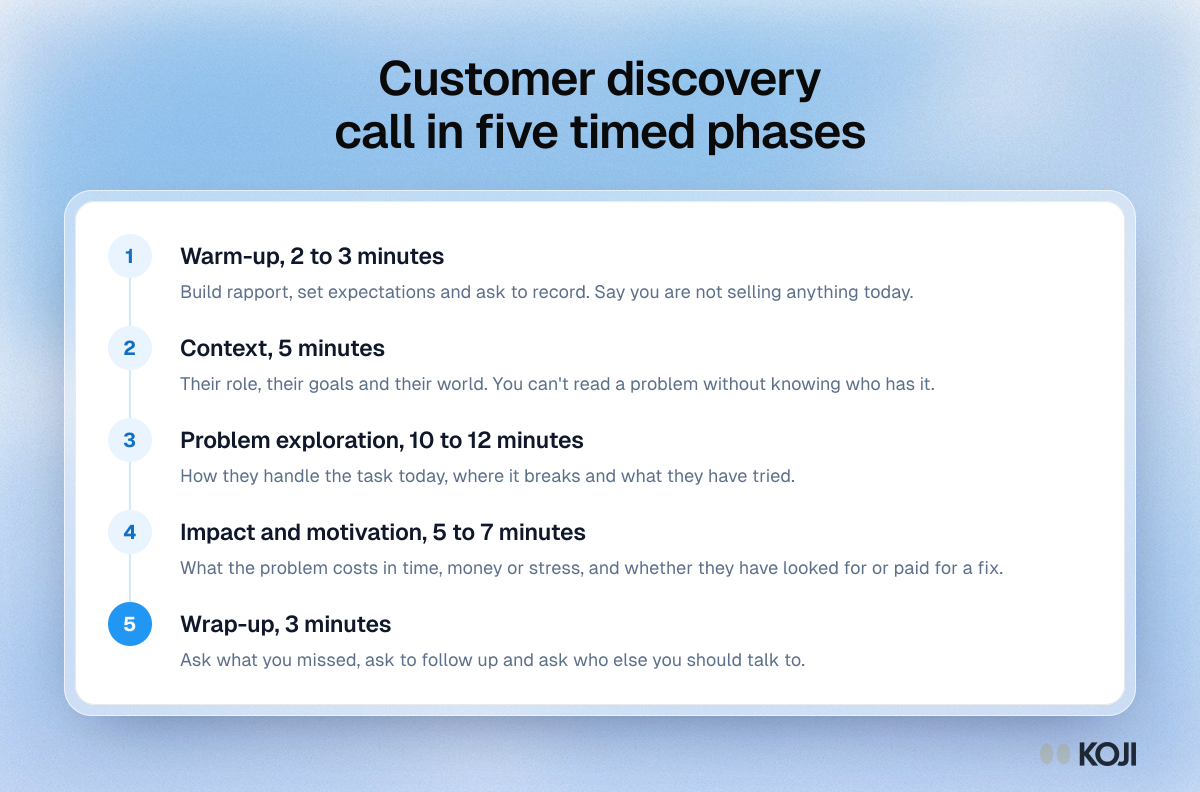
Process of a 30 minute customer discovery call in five timed phases: warm-up, context, problem exploration, impact and motivation, and wrap-up.

Process

Customer discovery call in five timed phases
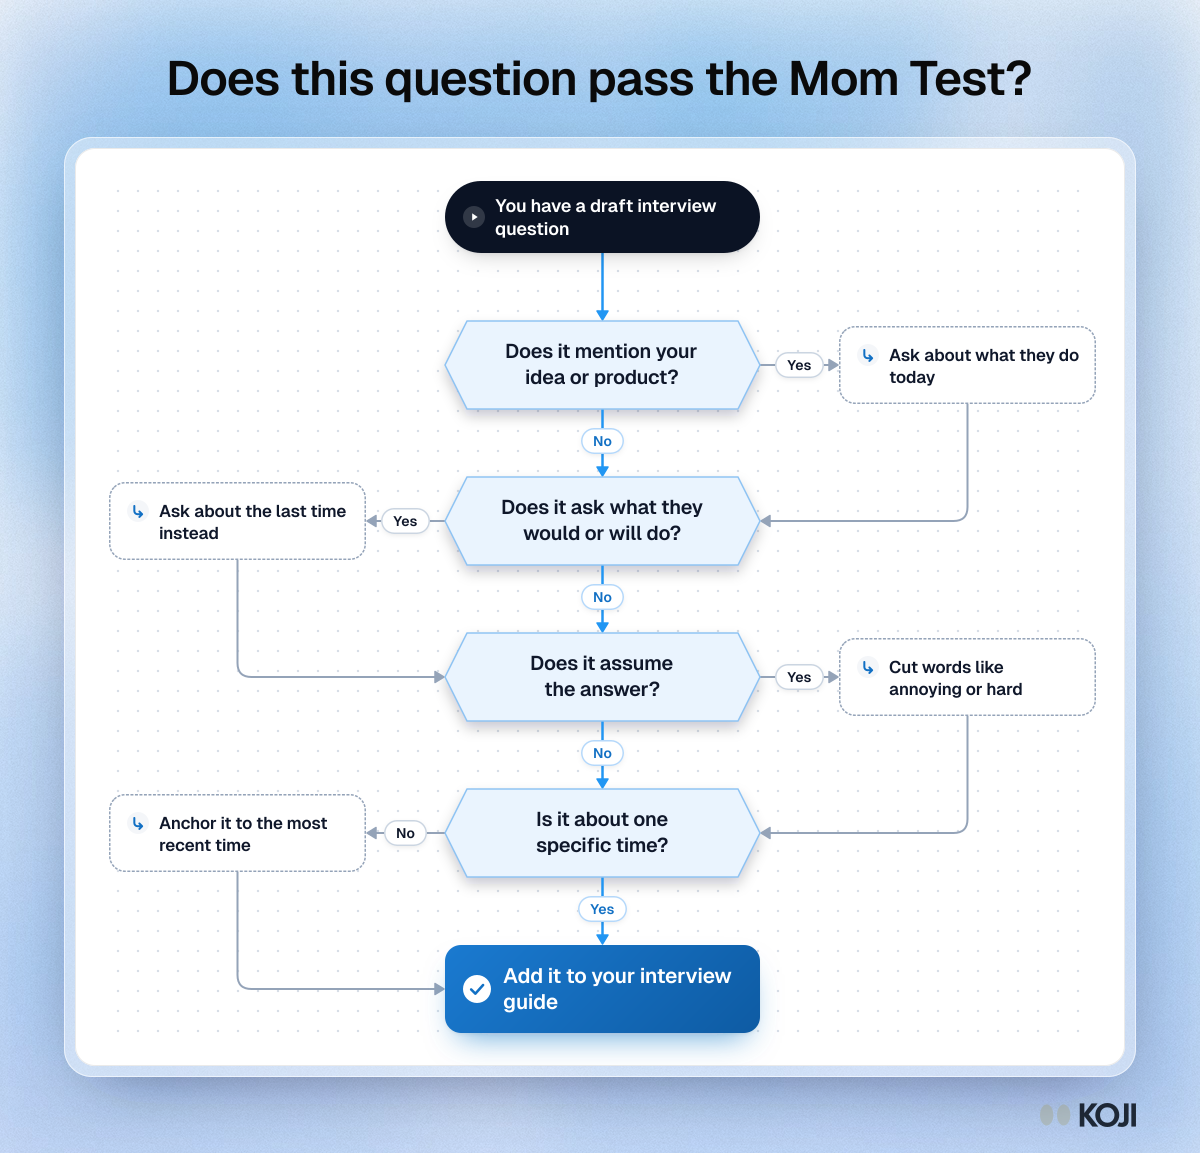
Flowchart for checking a draft interview question against the Mom Test: four yes or no questions, each with a rewrite, ending in a question ready for the guide.

Flowchart

Does this question pass the Mom Test?
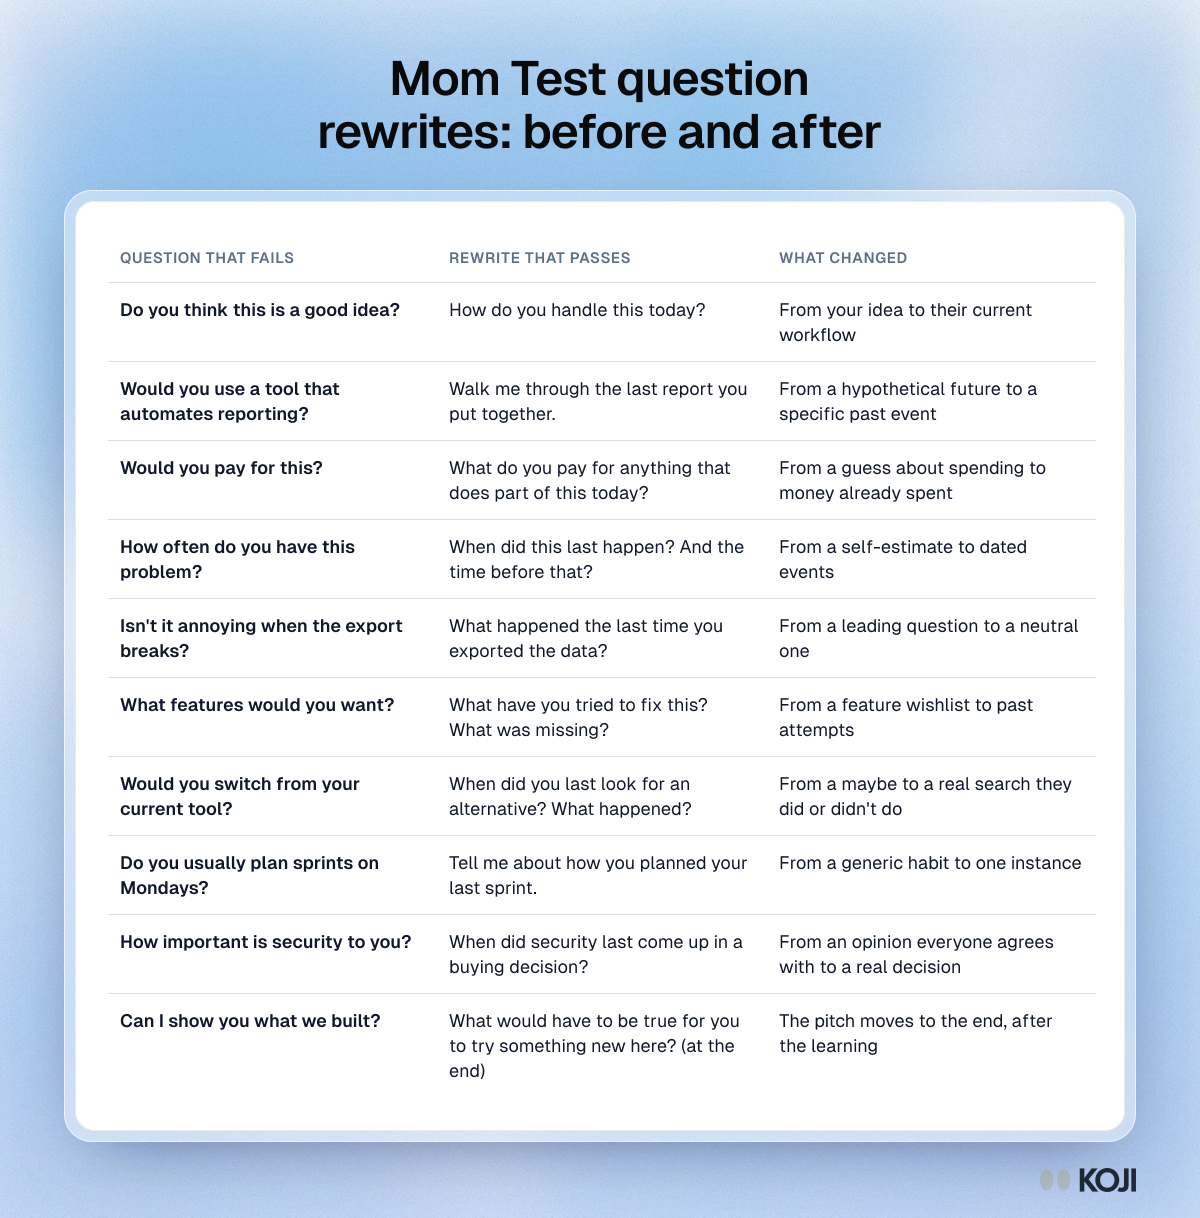
Table of ten customer interview questions that fail the Mom Test, each with a rewrite that asks about a specific past event instead.

Reference table

Mom Test question rewrites: before and after
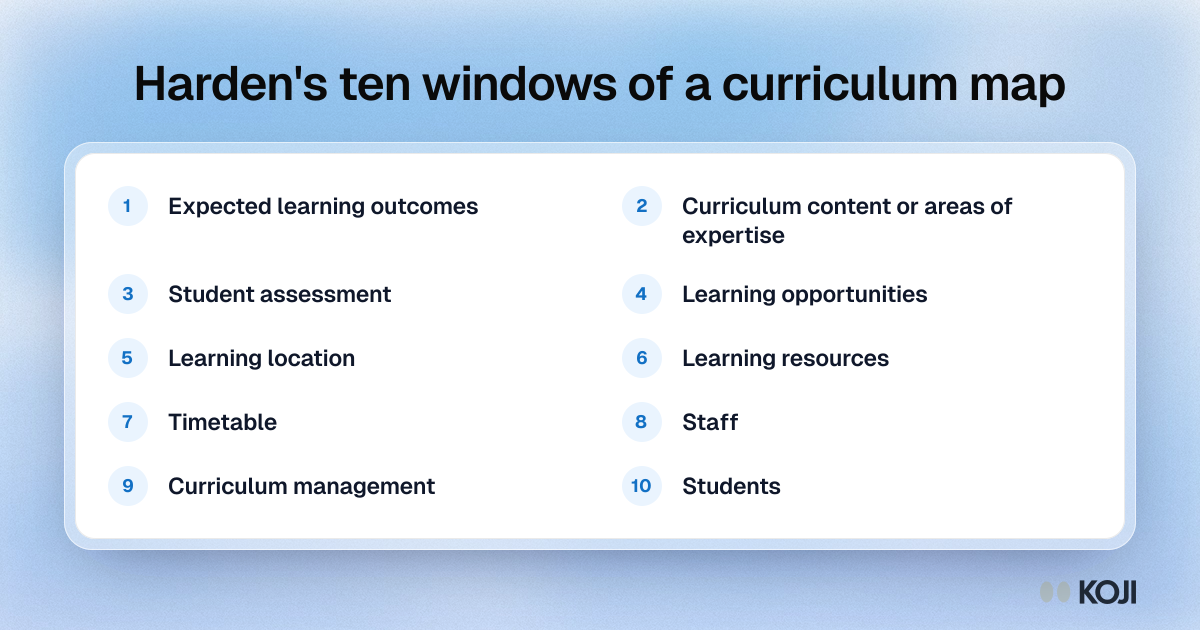
List of the ten windows of a curriculum map in Harden's model, from expected learning outcomes to students.

Guide

Harden's ten windows of a curriculum map
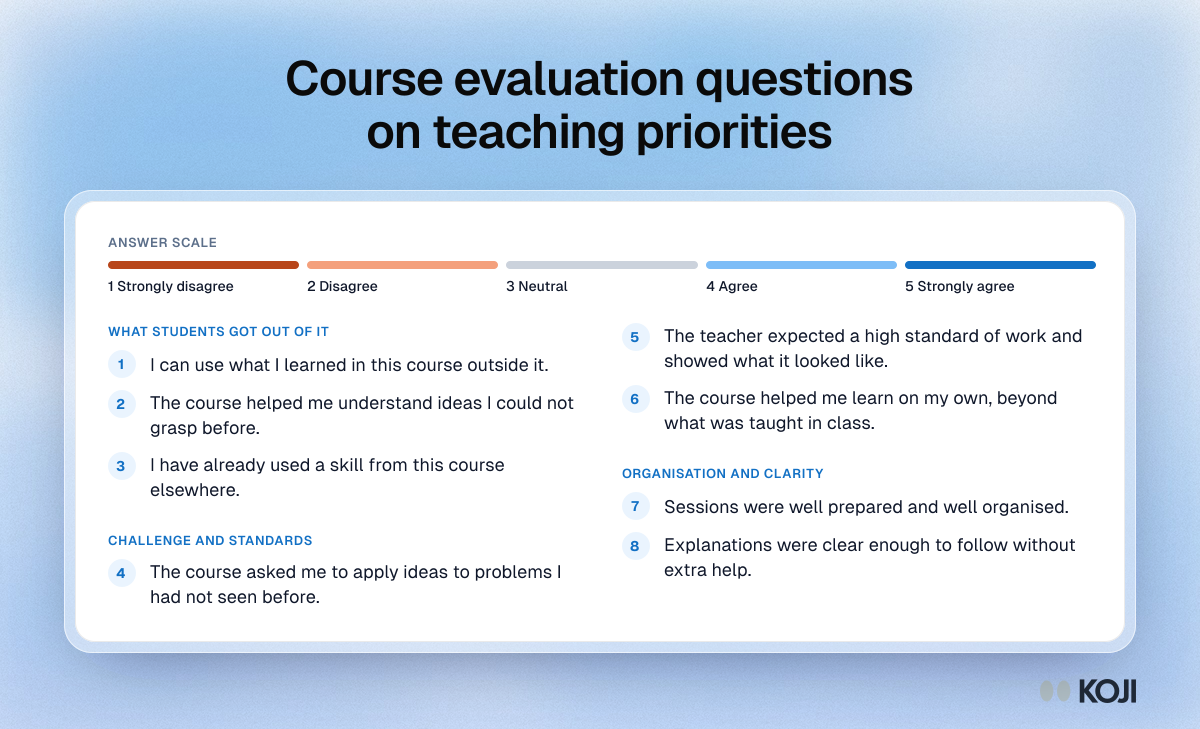
Question bank in three sections covering the outcomes students value, the challenge faculty value, and organisation and clarity.

Question bank

Course evaluation questions on teaching priorities
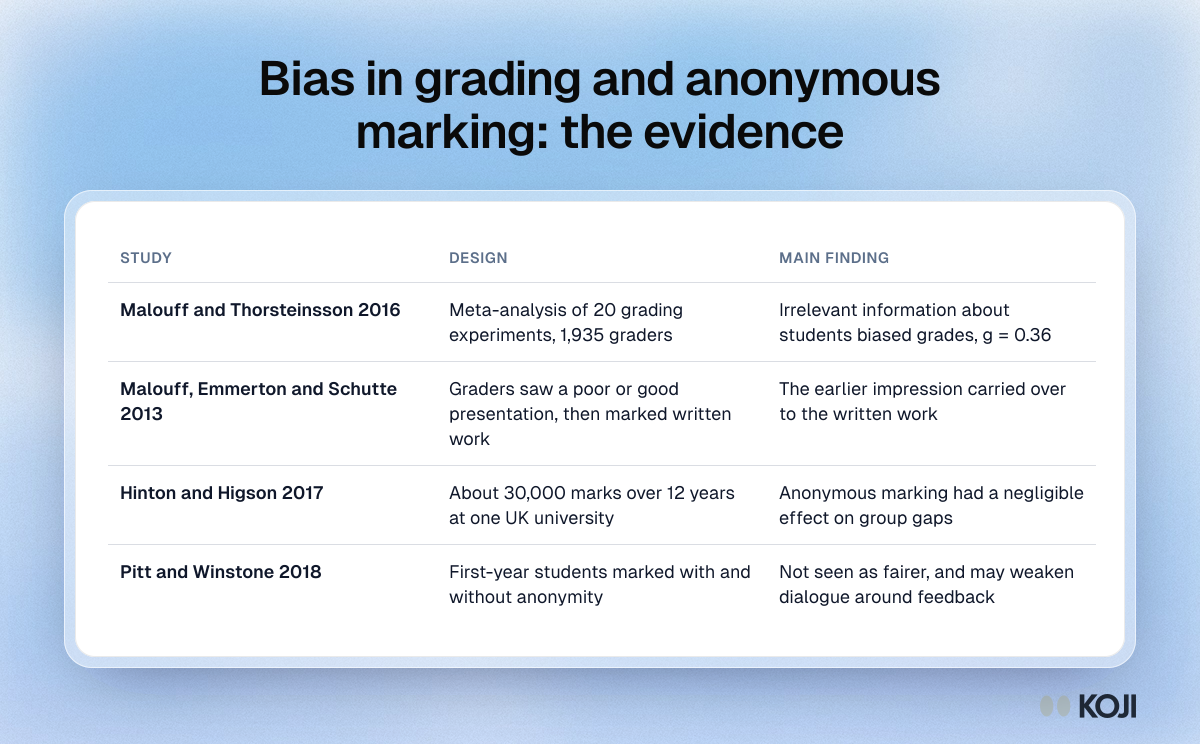
Table of four studies on bias in grading and anonymous marking, with each study's design and main finding.

Reference table

Bias in grading and anonymous marking: the evidence
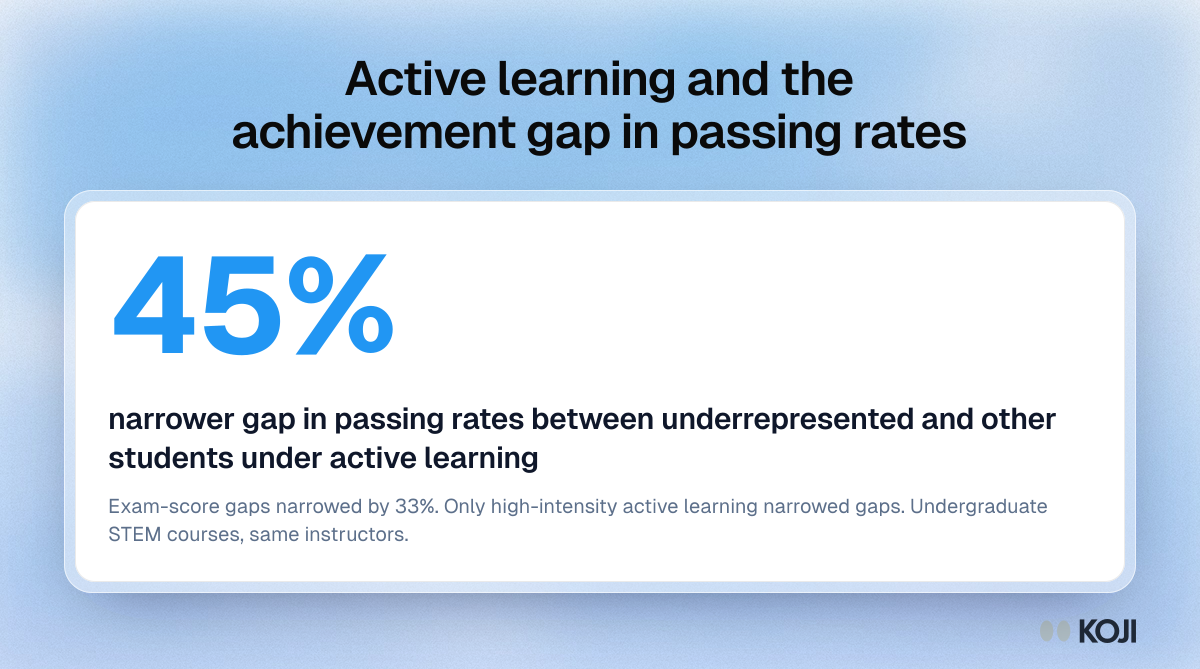
Stat card: active learning narrowed the gap in passing rates between underrepresented and other STEM students by 45 percent.

Key figure

Active learning and the achievement gap in passing rates
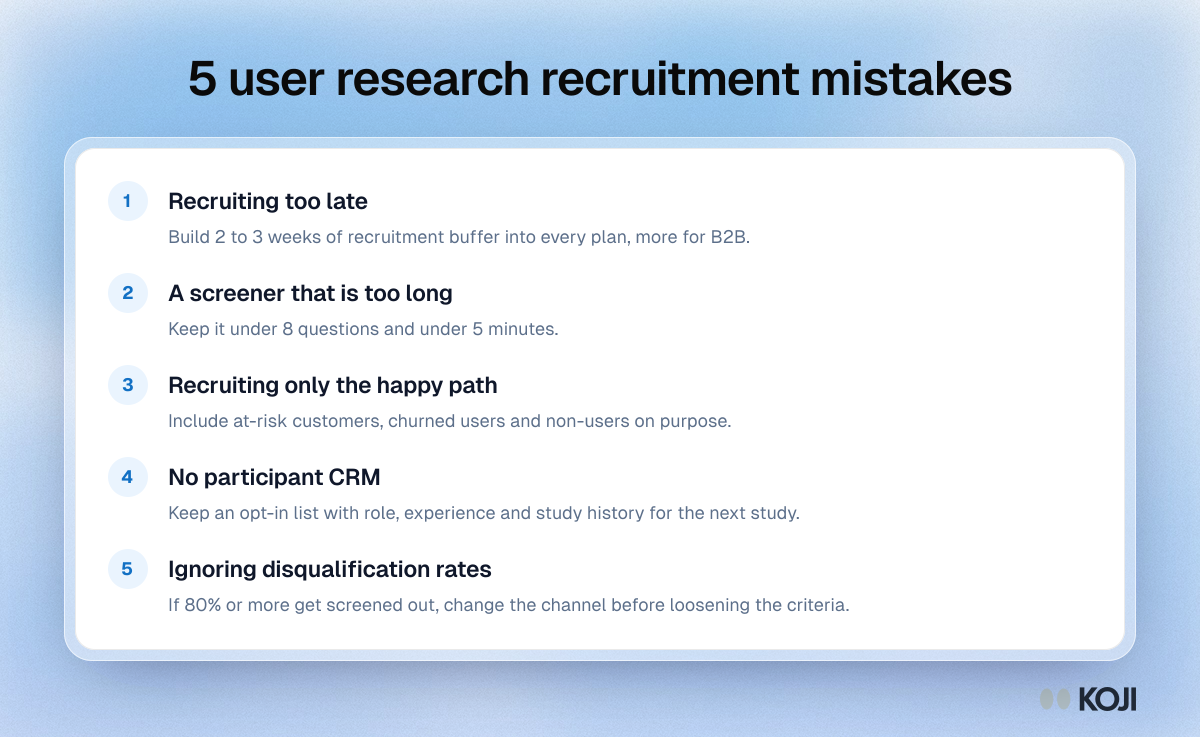
List of five recruitment mistakes: starting too late, long screeners, only happy users, no participant CRM and ignoring screener disqualification rates.

Guide

5 user research recruitment mistakes
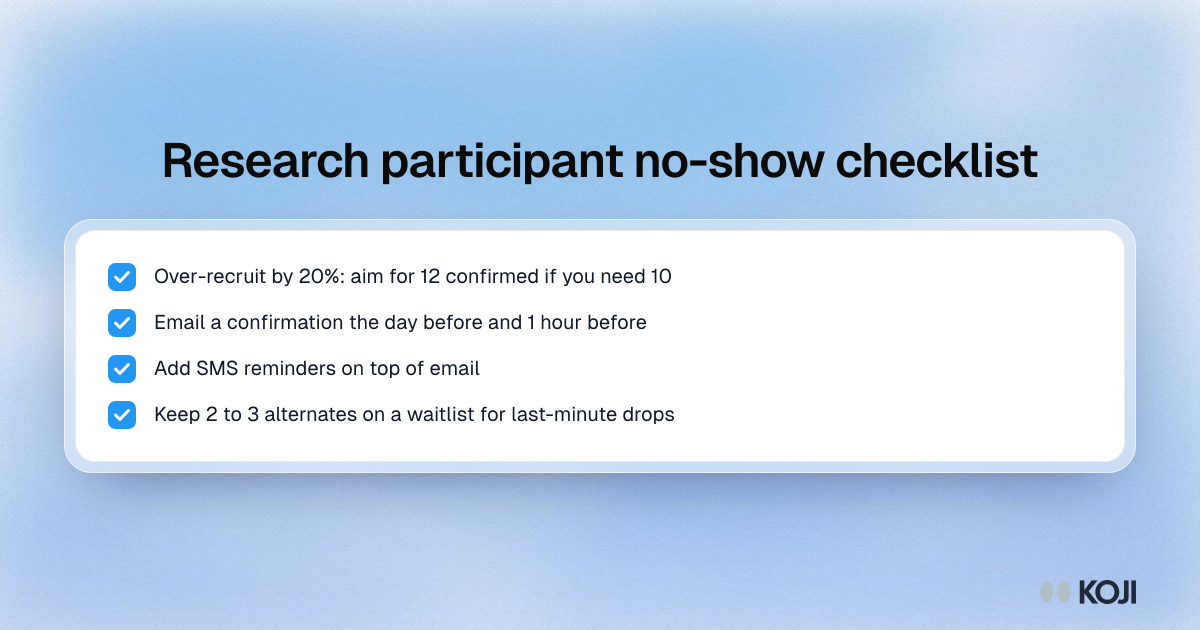
Checklist for reducing research no-shows: over-recruit by 20%, confirm the day before and an hour before, send SMS reminders and keep a waitlist.

Checklist

Research participant no-show checklist
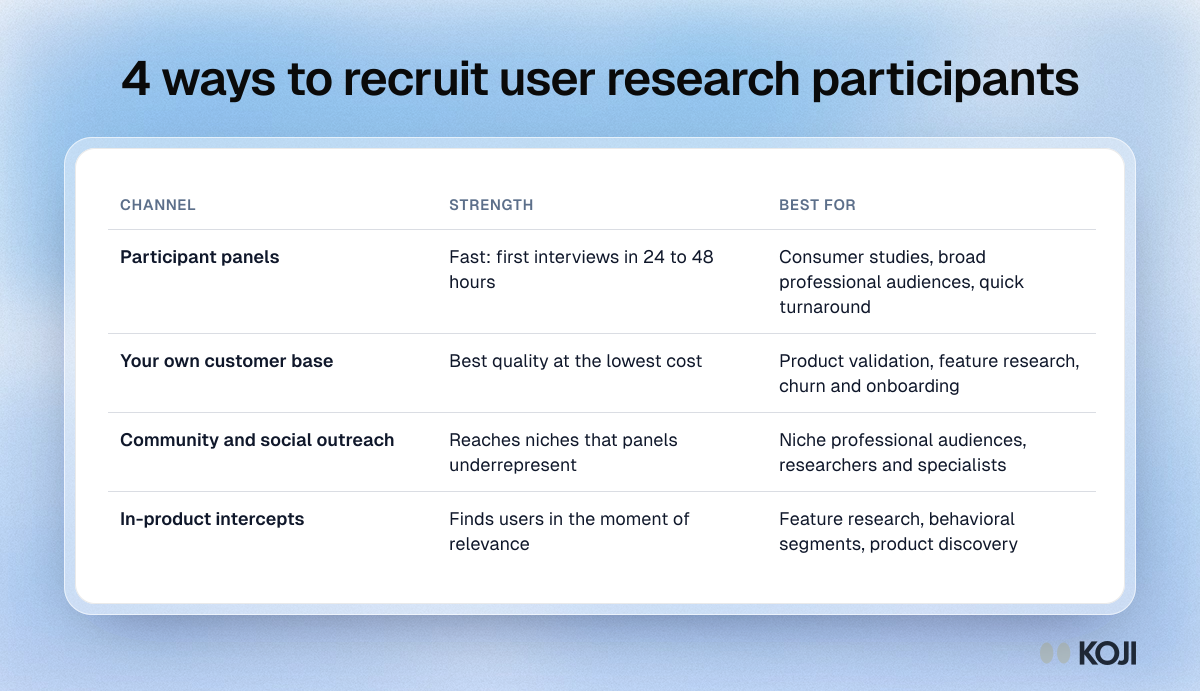
Table comparing four user research recruitment channels: participant panels, your customer base, community outreach and in-product intercepts.

Reference table

4 ways to recruit user research participants
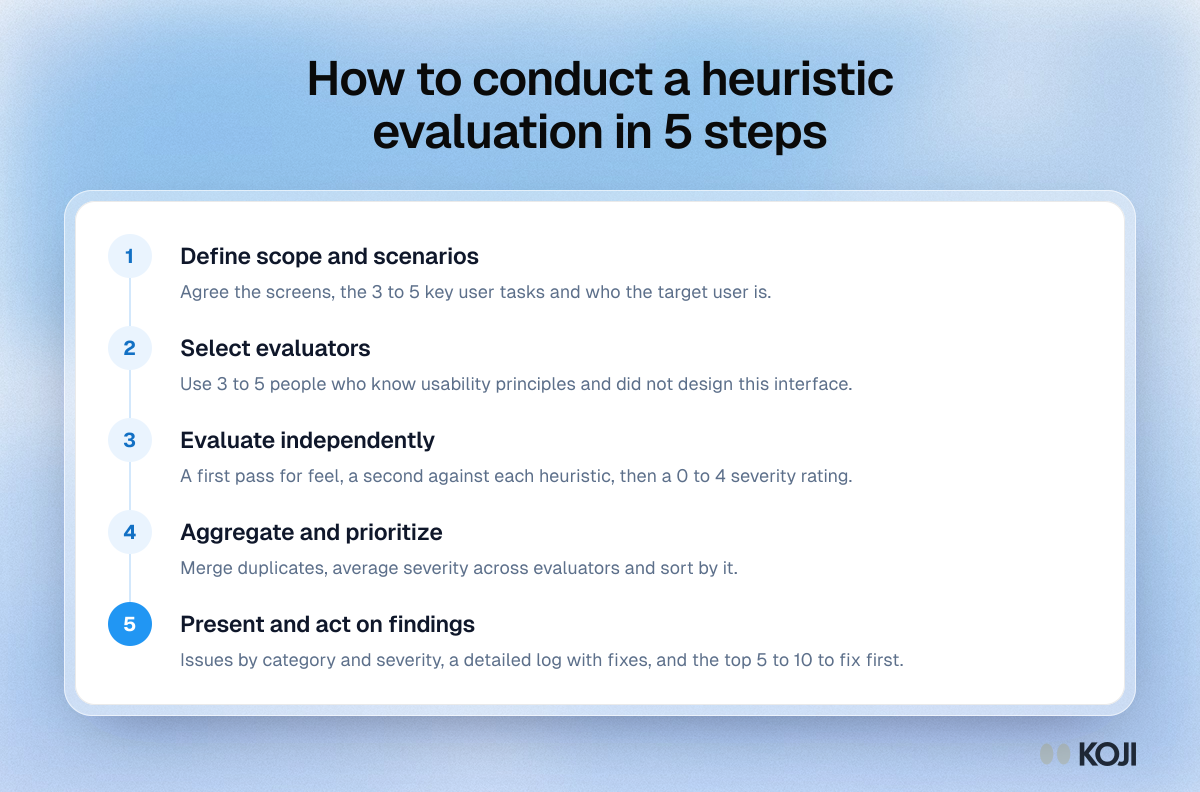
Process showing five steps of a heuristic evaluation: define scope, select 3 to 5 evaluators, evaluate independently, aggregate findings and present fixes.

Process

How to conduct a heuristic evaluation in 5 steps
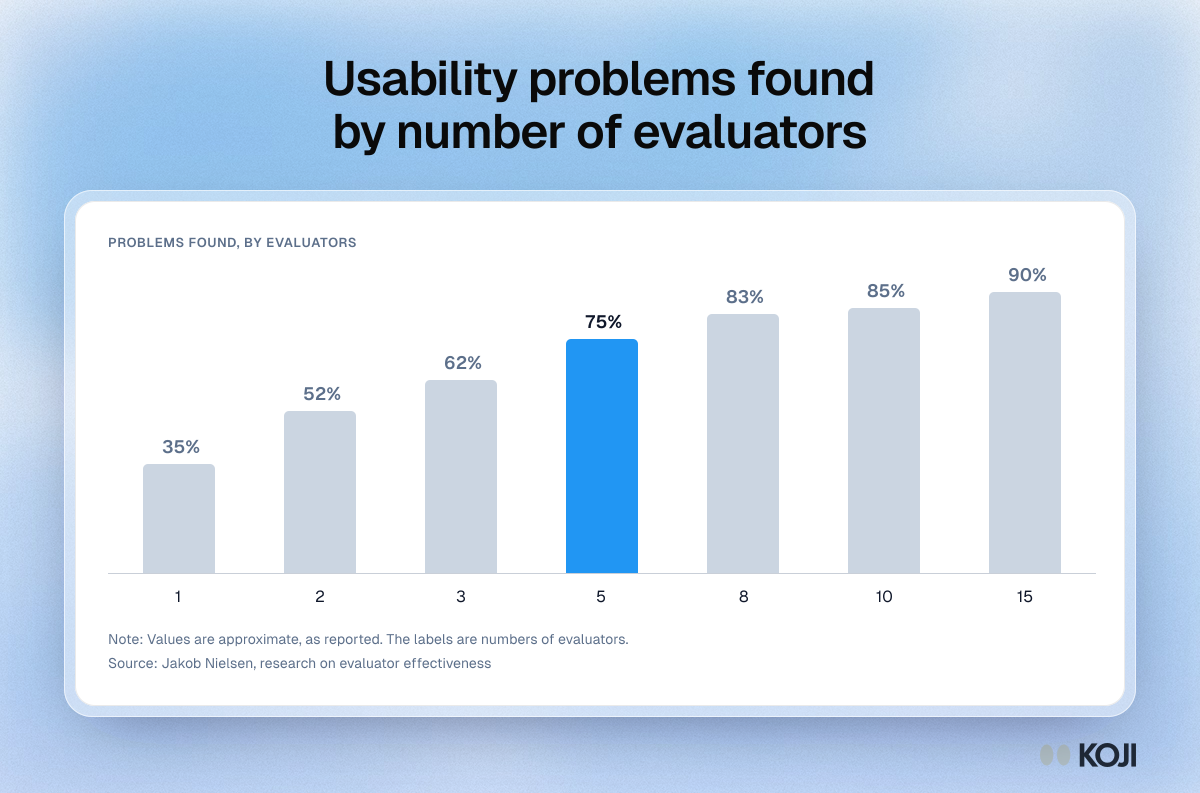
Column chart of usability problems found by number of evaluators: about 35% with 1, 62% with 3, 75% with 5, 85% with 10 and 90% with 15.

Column chart

Usability problems found by number of evaluators
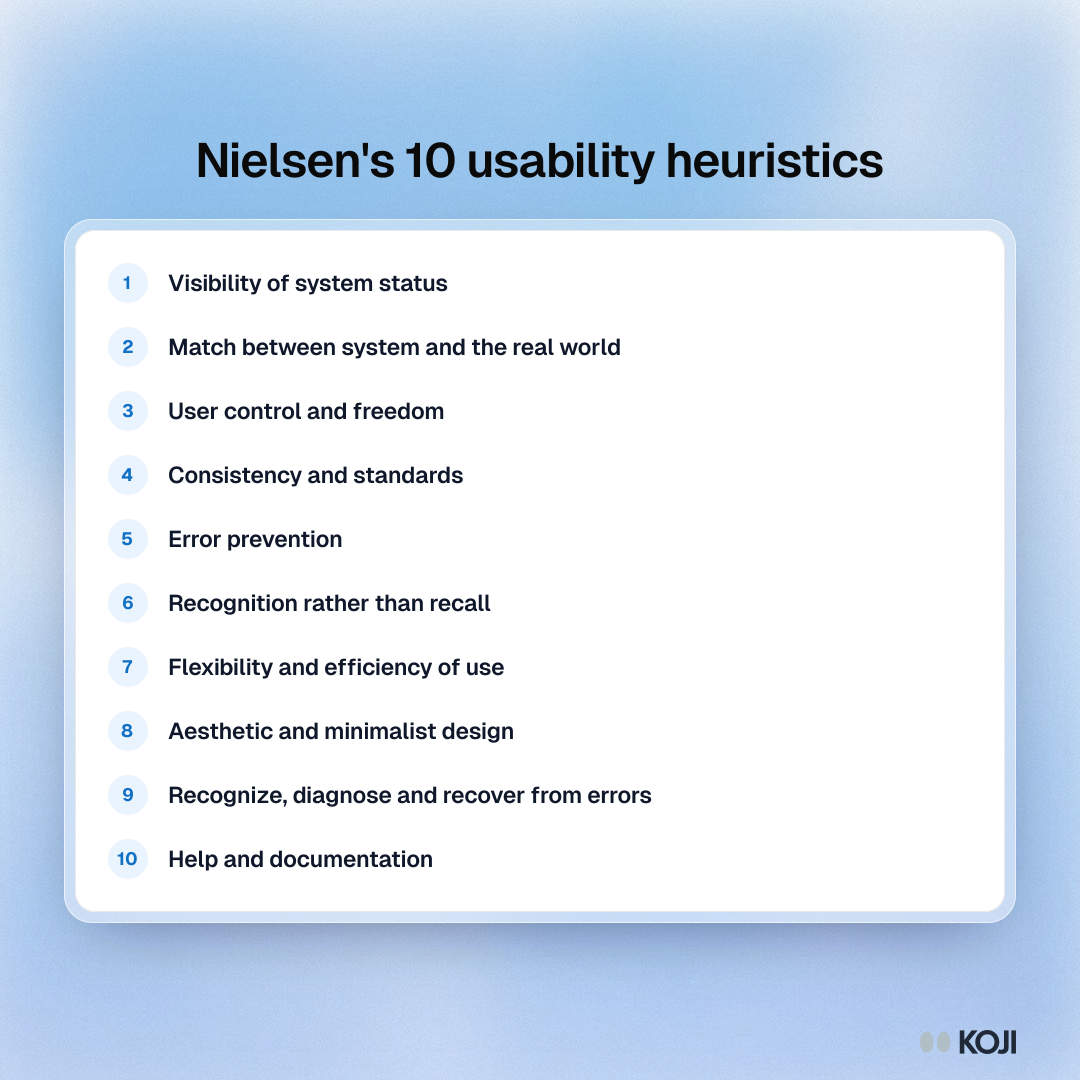
List of Nielsen's 10 usability heuristics, from visibility of system status and match with the real world to error recovery and help and documentation.

Guide

Nielsen's 10 usability heuristics
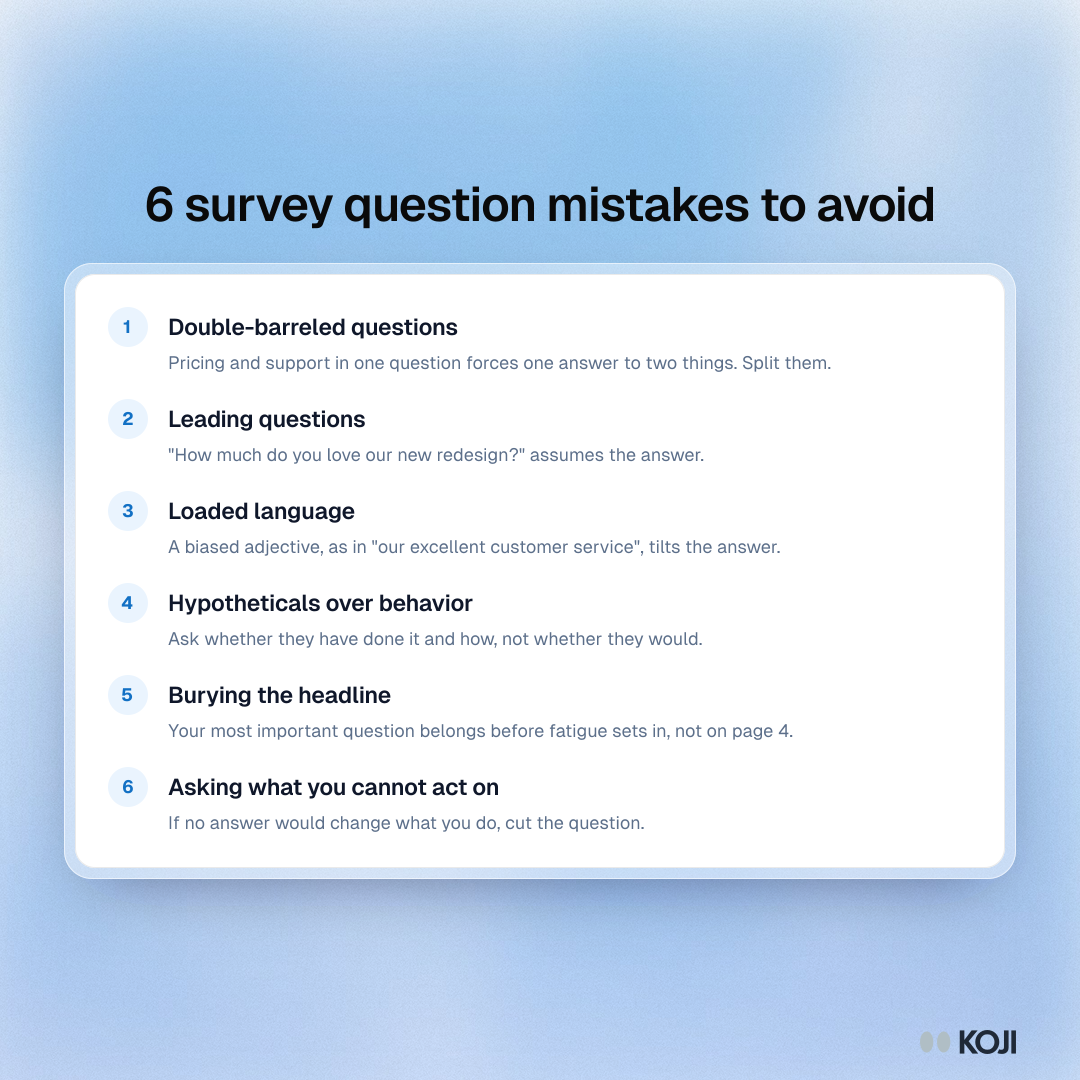
List of six survey question mistakes: double-barreled, leading and loaded questions, hypotheticals, burying the key question and asking what you cannot act on.

Guide

6 survey question mistakes to avoid
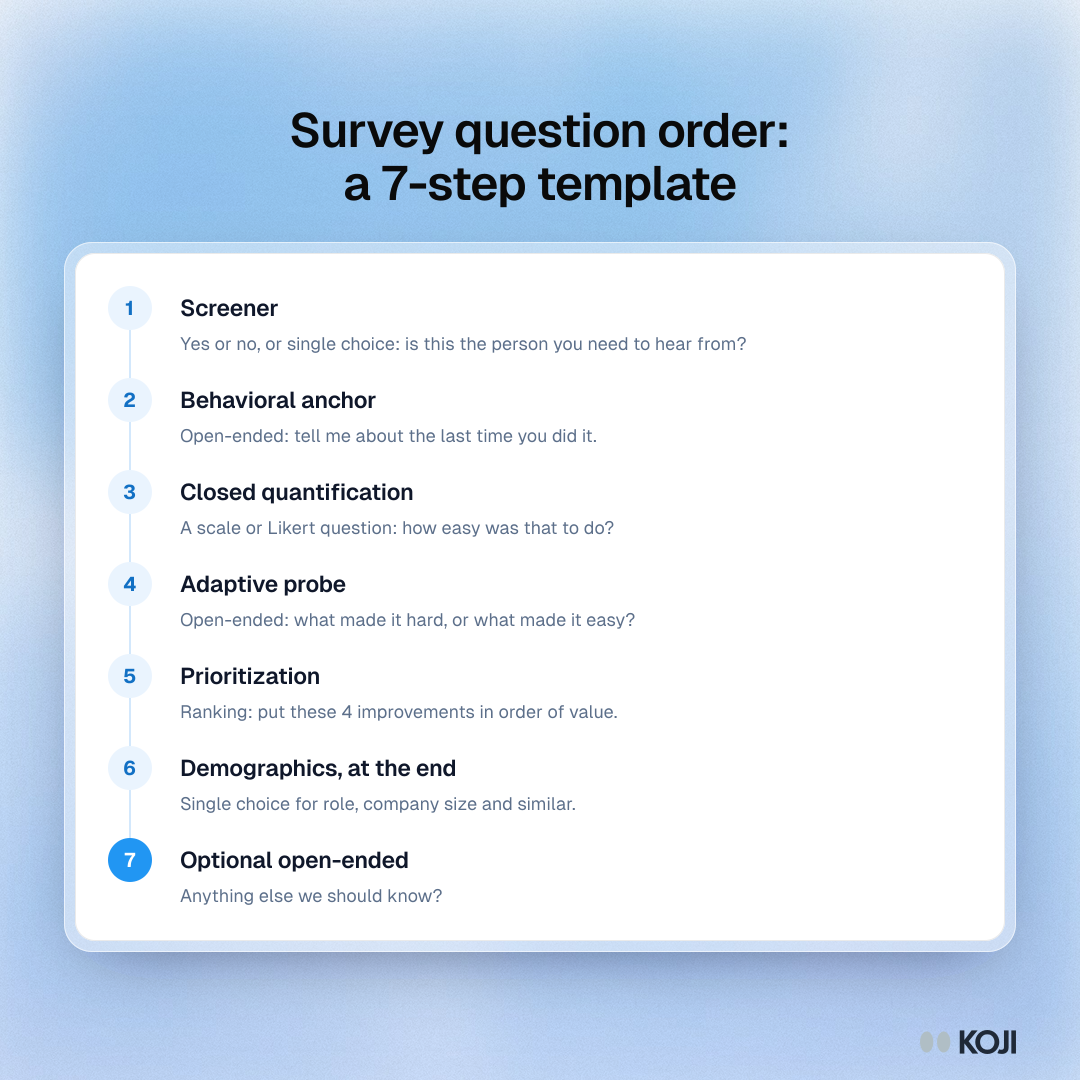
Process showing a seven-step survey question order: screener, behavioral anchor, scale, adaptive probe, ranking, demographics and an optional open question.

Process

Survey question order: a 7-step template
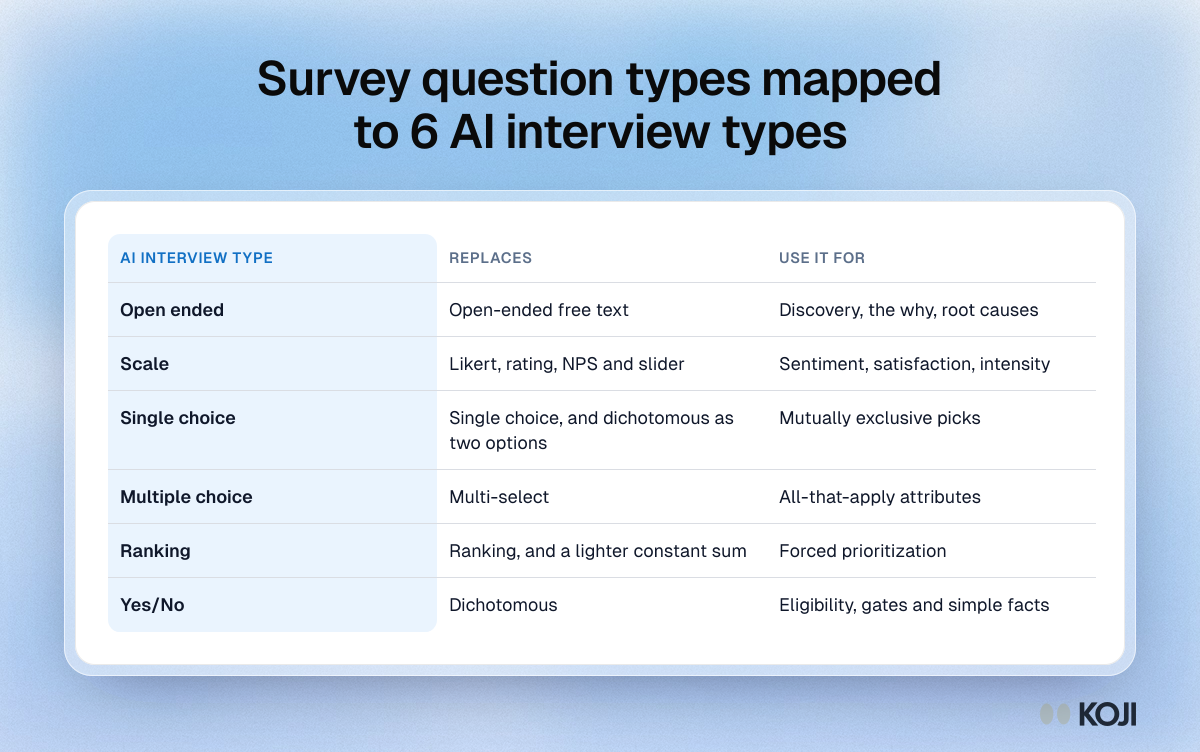
Table mapping classic survey question types to six AI interview types: open ended, scale, single choice, multiple choice, ranking and yes or no.

Reference table

Survey question types mapped to 6 AI interview types
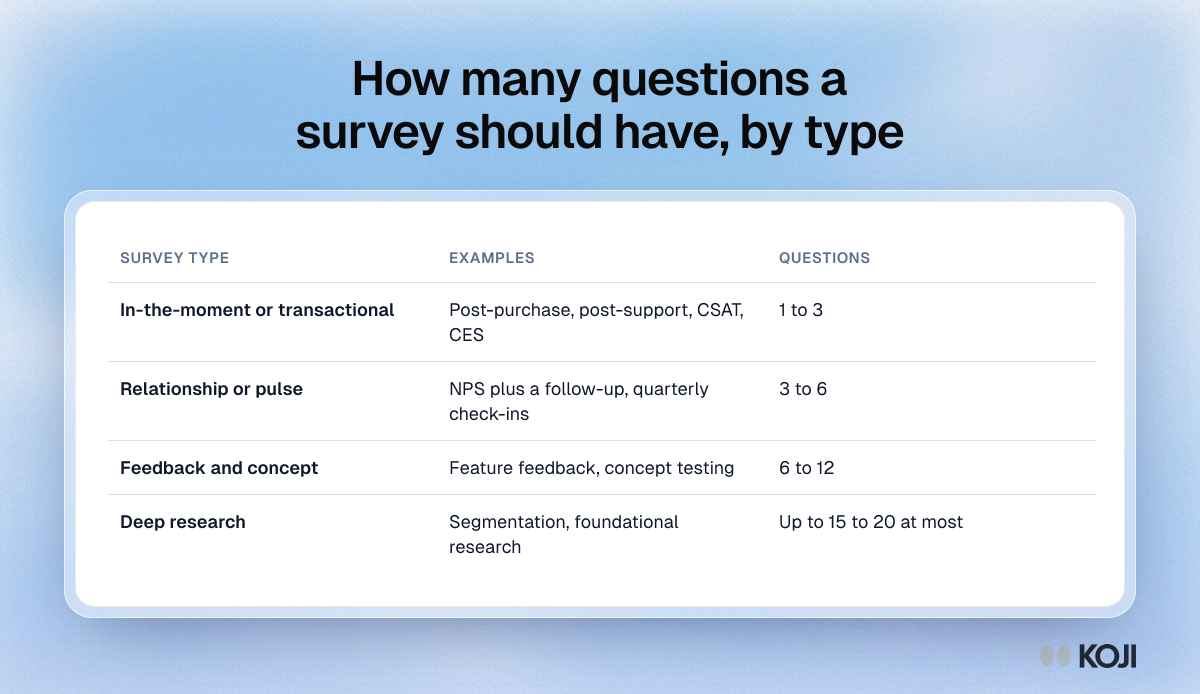
Table of survey length by type: 1 to 3 questions for transactional, 3 to 6 for pulse, 6 to 12 for concept and up to 15 to 20 for deep research.

Reference table

How many questions a survey should have, by type
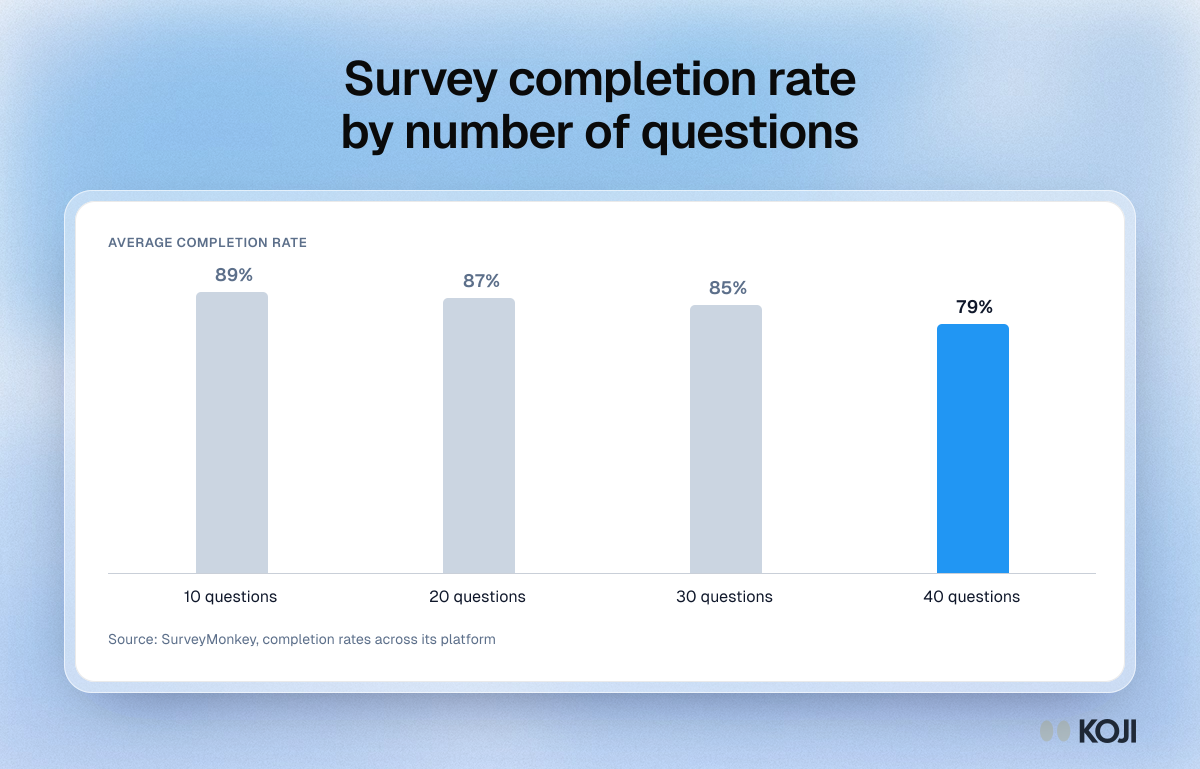
Column chart of average survey completion rate by length: 89% at 10 questions, 87% at 20, 85% at 30 and 79% at 40 questions.

Column chart

Survey completion rate by number of questions
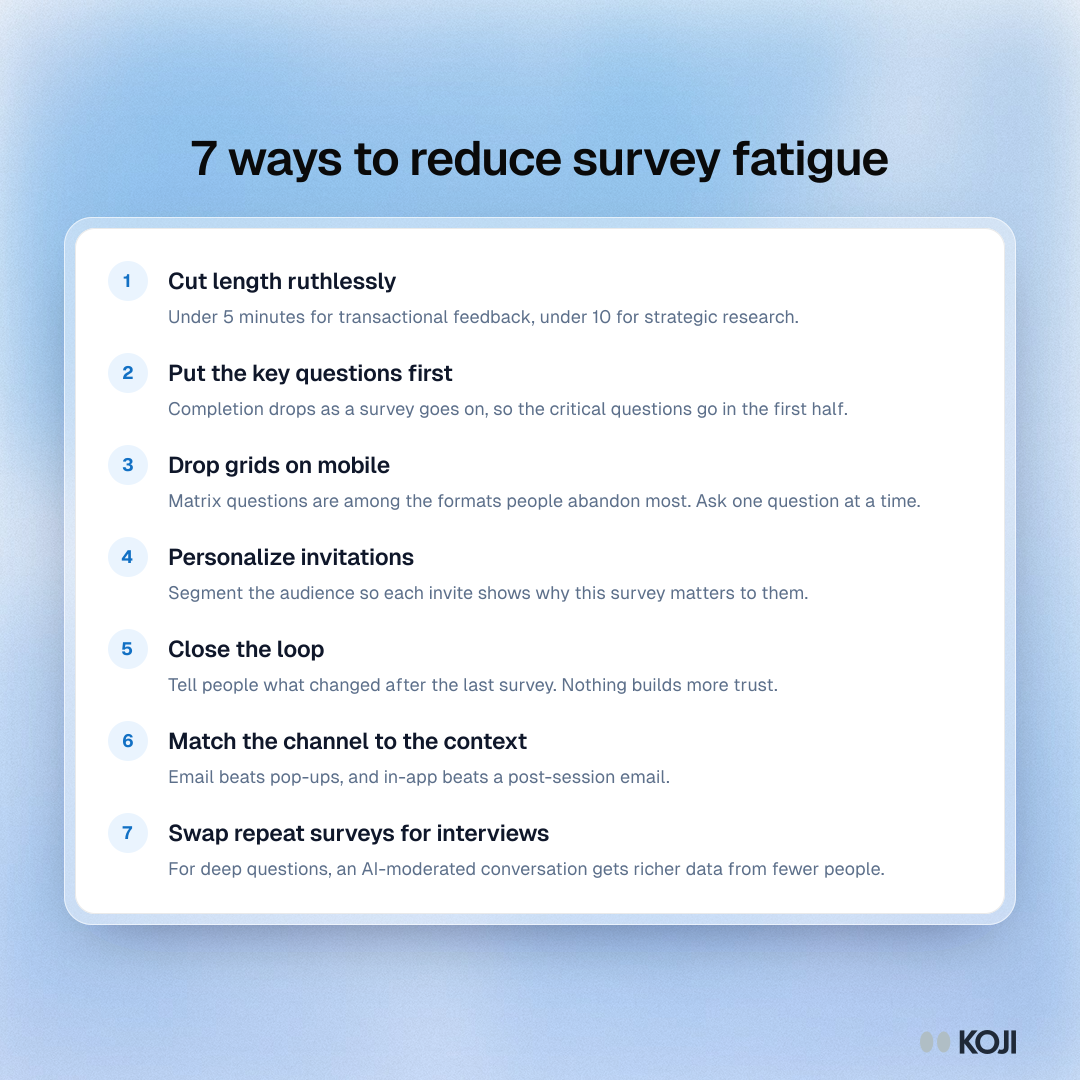
List of seven ways to reduce survey fatigue: shorter surveys, key questions first, no grids on mobile, personal invites, closing the loop, channel, interviews.

Guide

7 ways to reduce survey fatigue
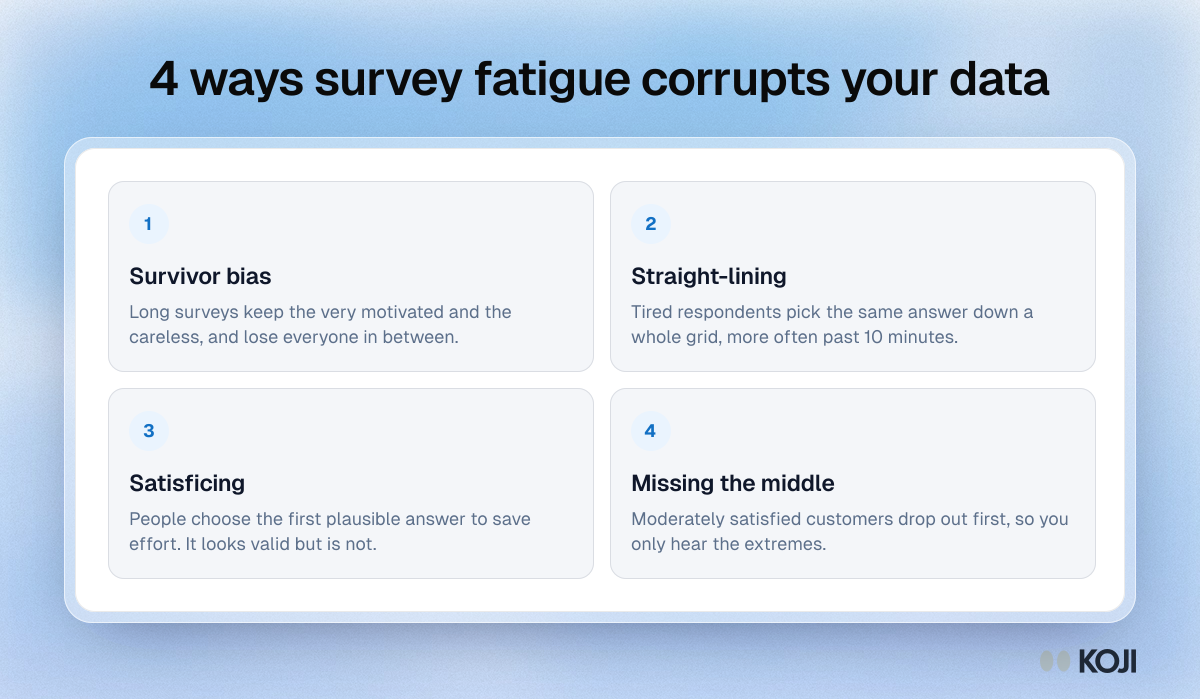
Framework of four ways survey fatigue distorts results: survivor bias, straight-lining, satisficing and losing the moderately satisfied middle.

Framework

4 ways survey fatigue corrupts your data
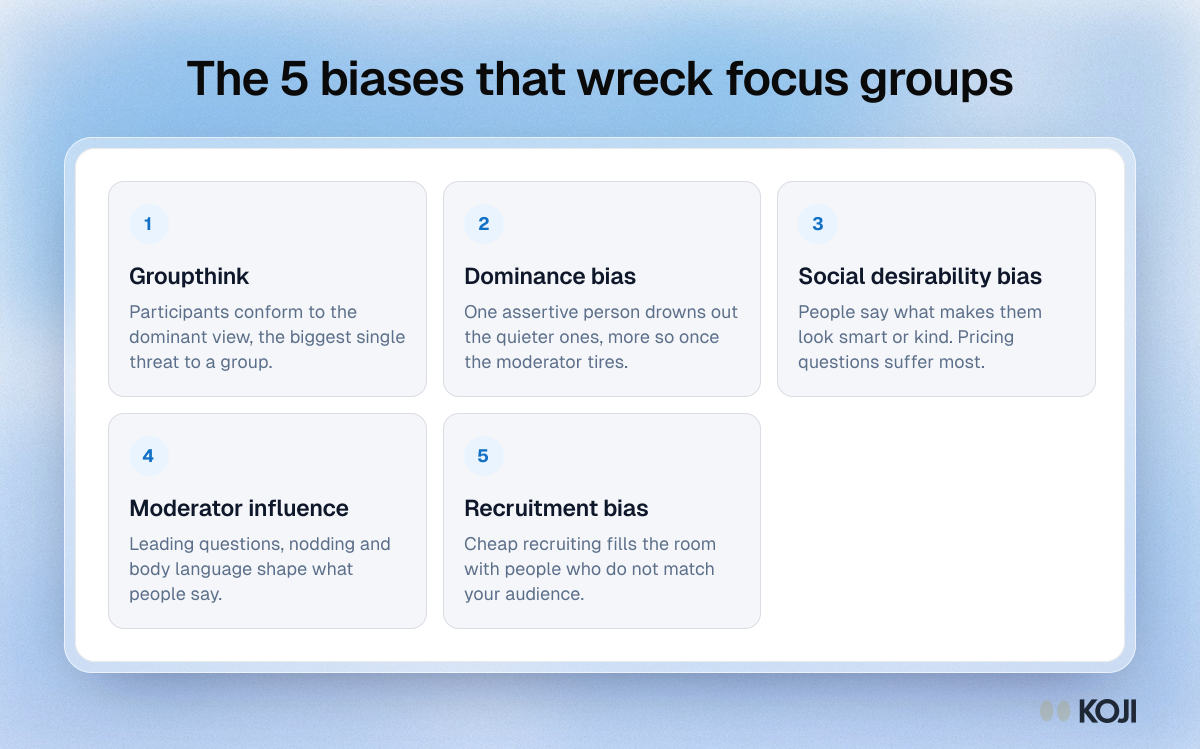
Framework of five focus group biases: groupthink, dominance bias, social desirability bias, moderator influence and recruitment bias, with what each does.

Framework

The 5 biases that wreck focus groups
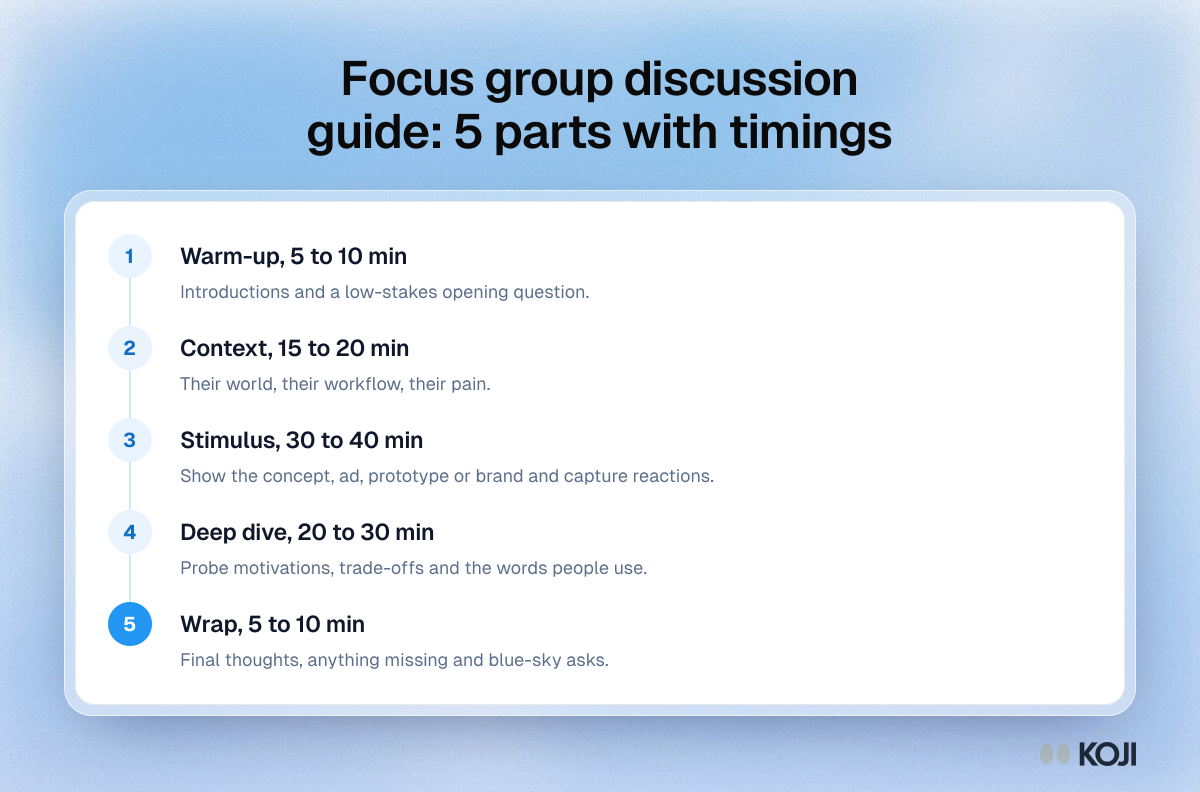
Process showing the five parts of a focus group discussion guide with timings: warm-up, context, stimulus, deep dive and wrap, across about two hours.

Process

Focus group discussion guide: 5 parts with timings
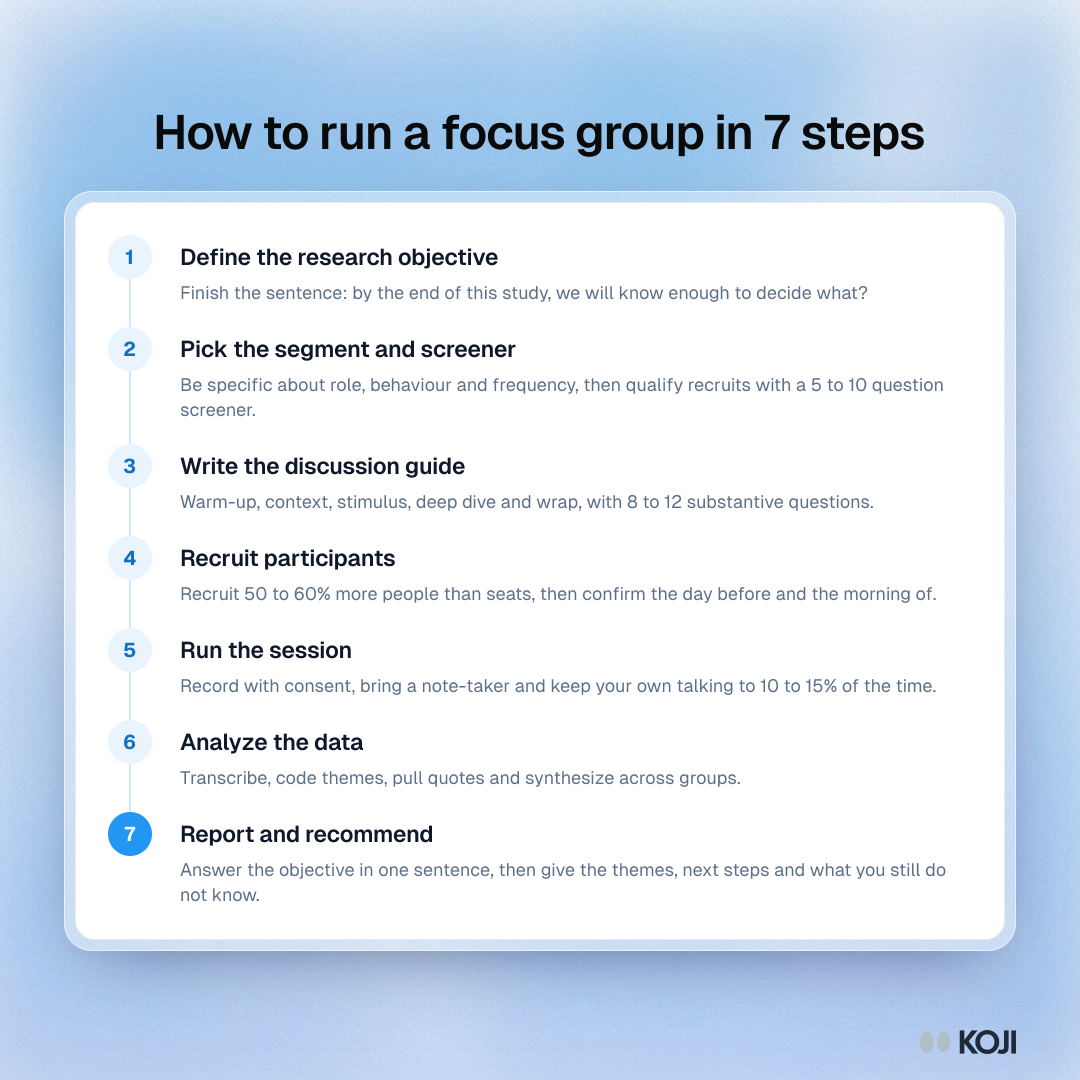
Process showing seven steps to run a focus group: set the objective, screen the segment, write the guide, recruit, run, analyze and report a decision.

Process

How to run a focus group in 7 steps
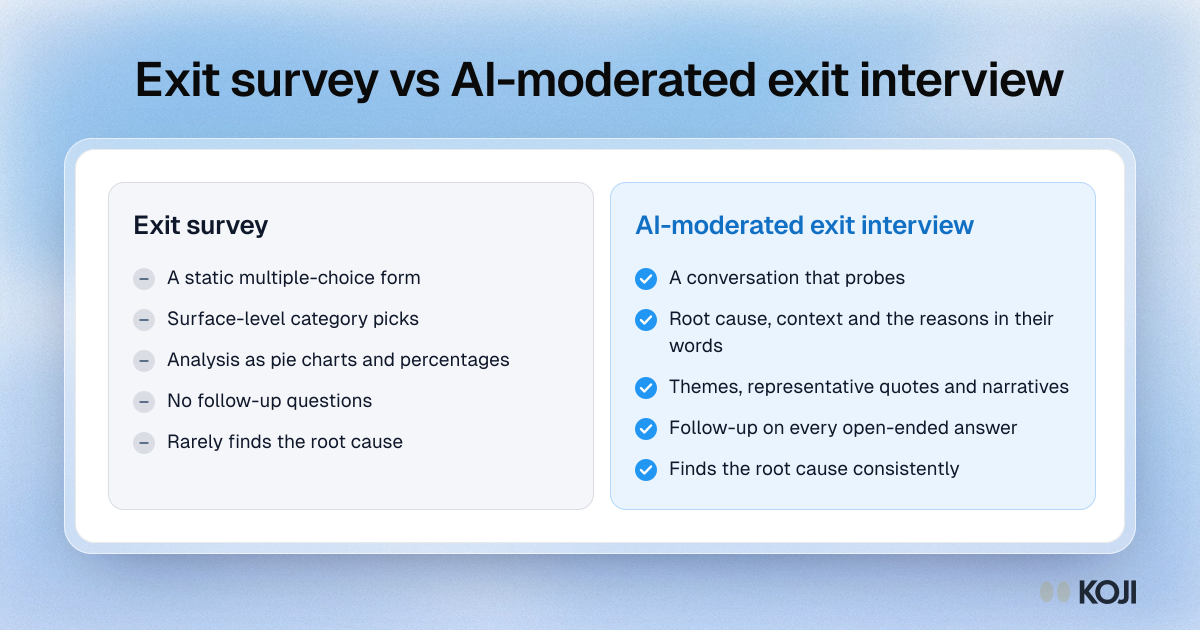
Comparison of an exit survey and an AI-moderated exit interview on format, depth, analysis, follow-up questions and how often each finds the root cause.

Comparison

Exit survey vs AI-moderated exit interview
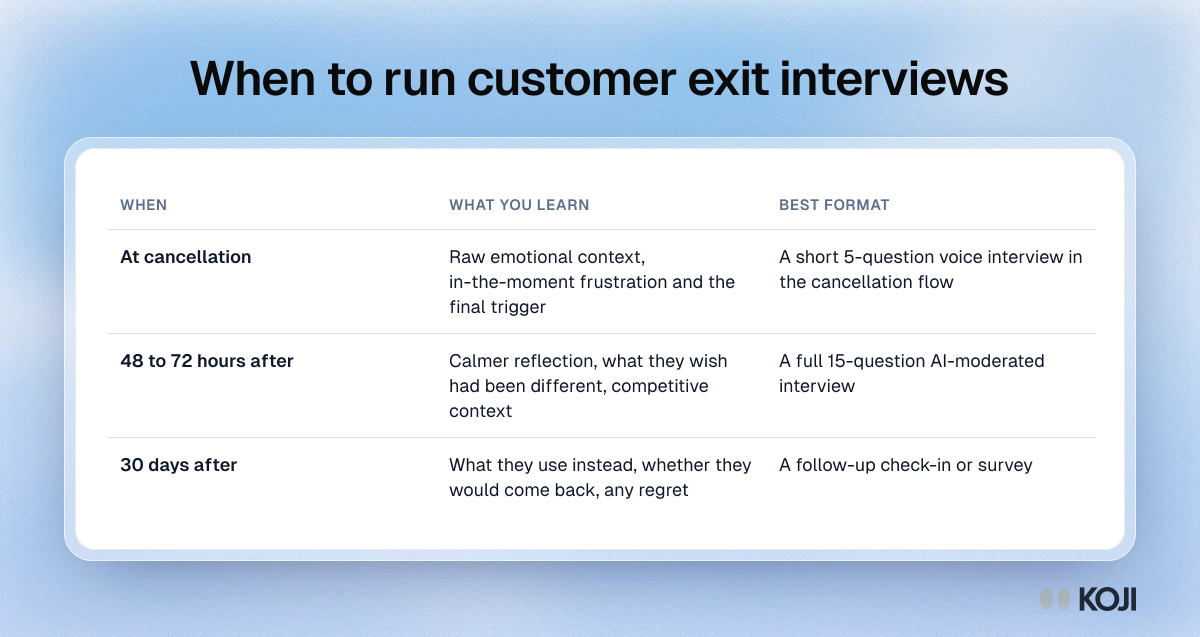
Table of three times to run a customer exit interview: at cancellation, 48 to 72 hours after and 30 days after, with what each teaches and its format.

Reference table

When to run customer exit interviews
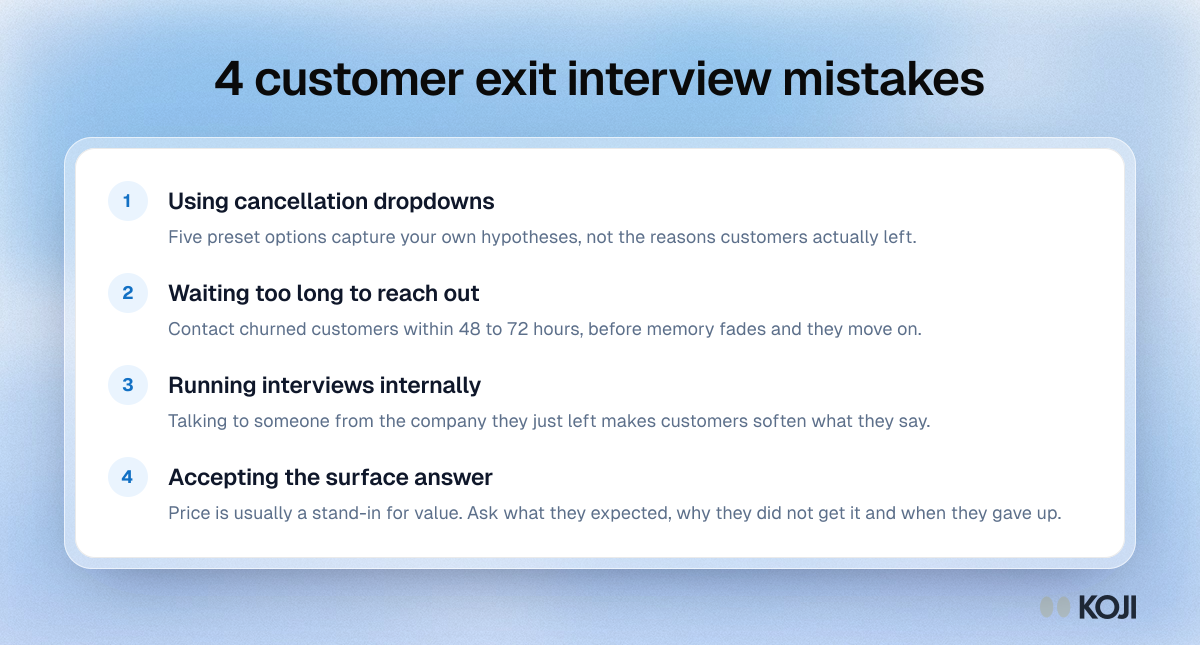
List of four exit research mistakes: relying on cancellation dropdowns, waiting too long, interviewing in-house and accepting price as the reason.

Guide

4 customer exit interview mistakes
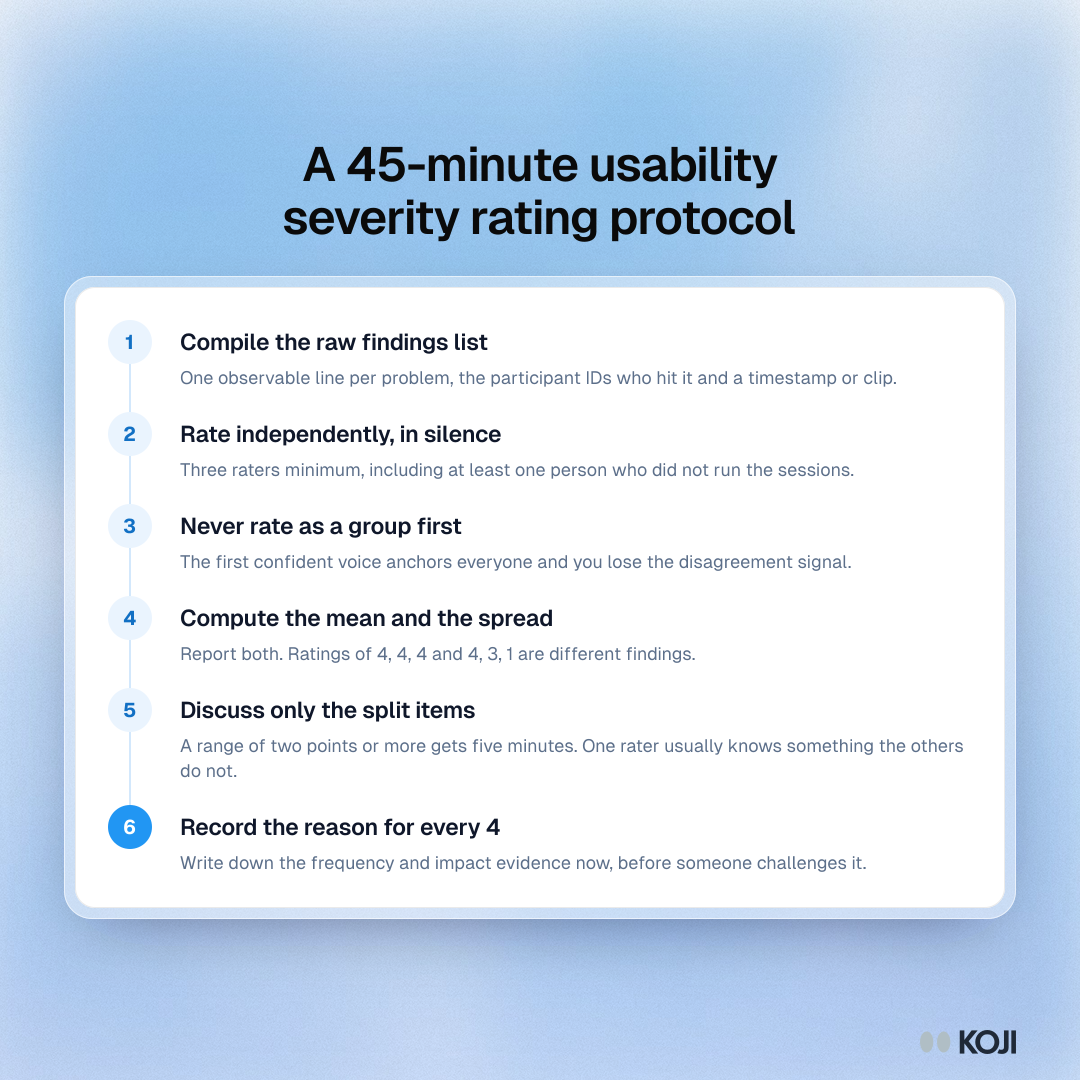
Process showing six steps to rate usability problem severity: list findings, rate alone, avoid group rating, report mean and spread, discuss splits, justify 4s.

Process

A 45-minute usability severity rating protocol
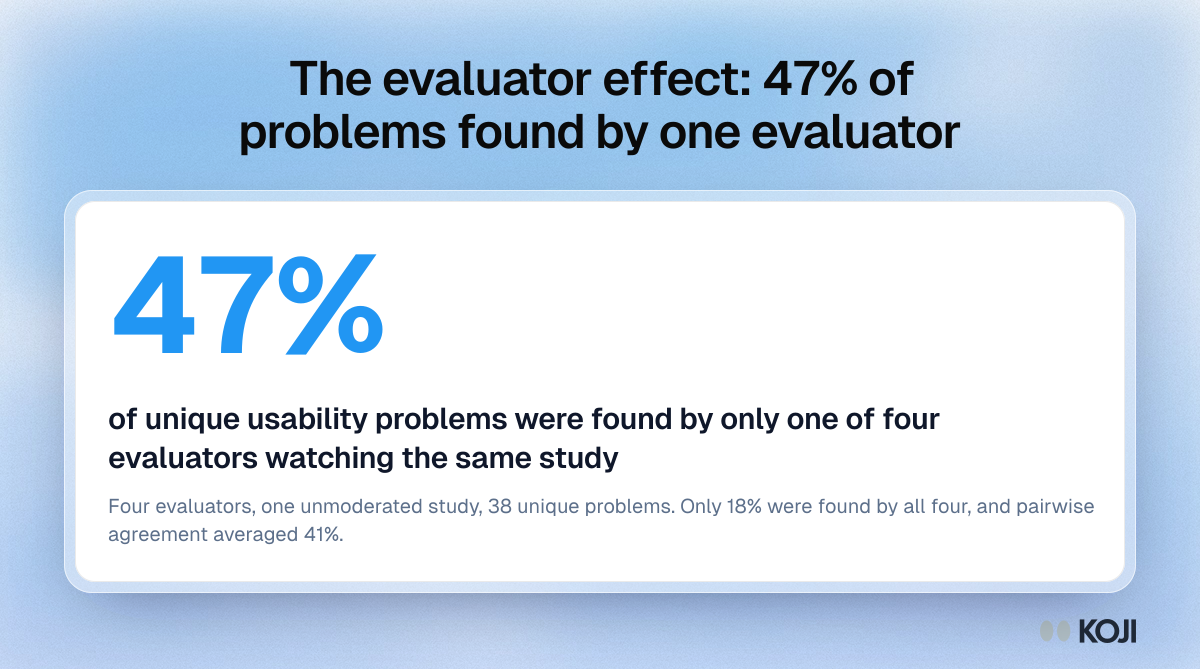
Stat card: 47% of unique usability problems were found by only one of four evaluators who analysed the same unmoderated study.

Key figure

The evaluator effect: 47% of problems found by one evaluator
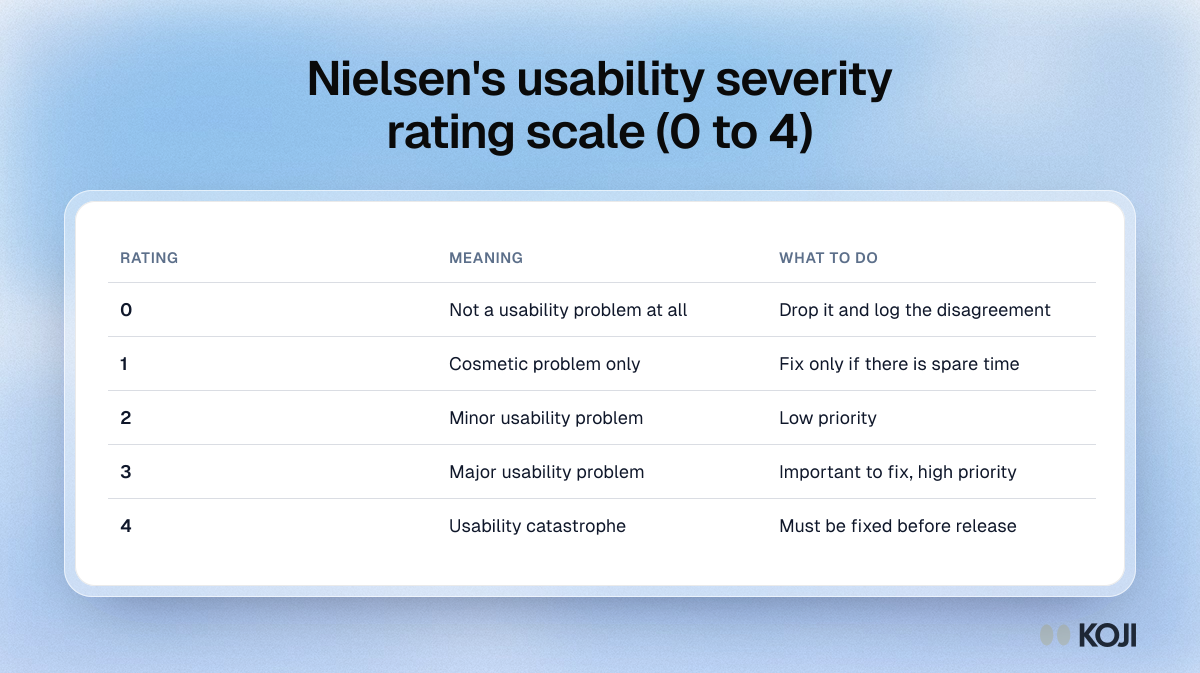
Table of the Nielsen 0 to 4 usability severity scale, from 0 not a problem and 1 cosmetic to 4 usability catastrophe, with the action for each rating.

Reference table

Nielsen's usability severity rating scale (0 to 4)
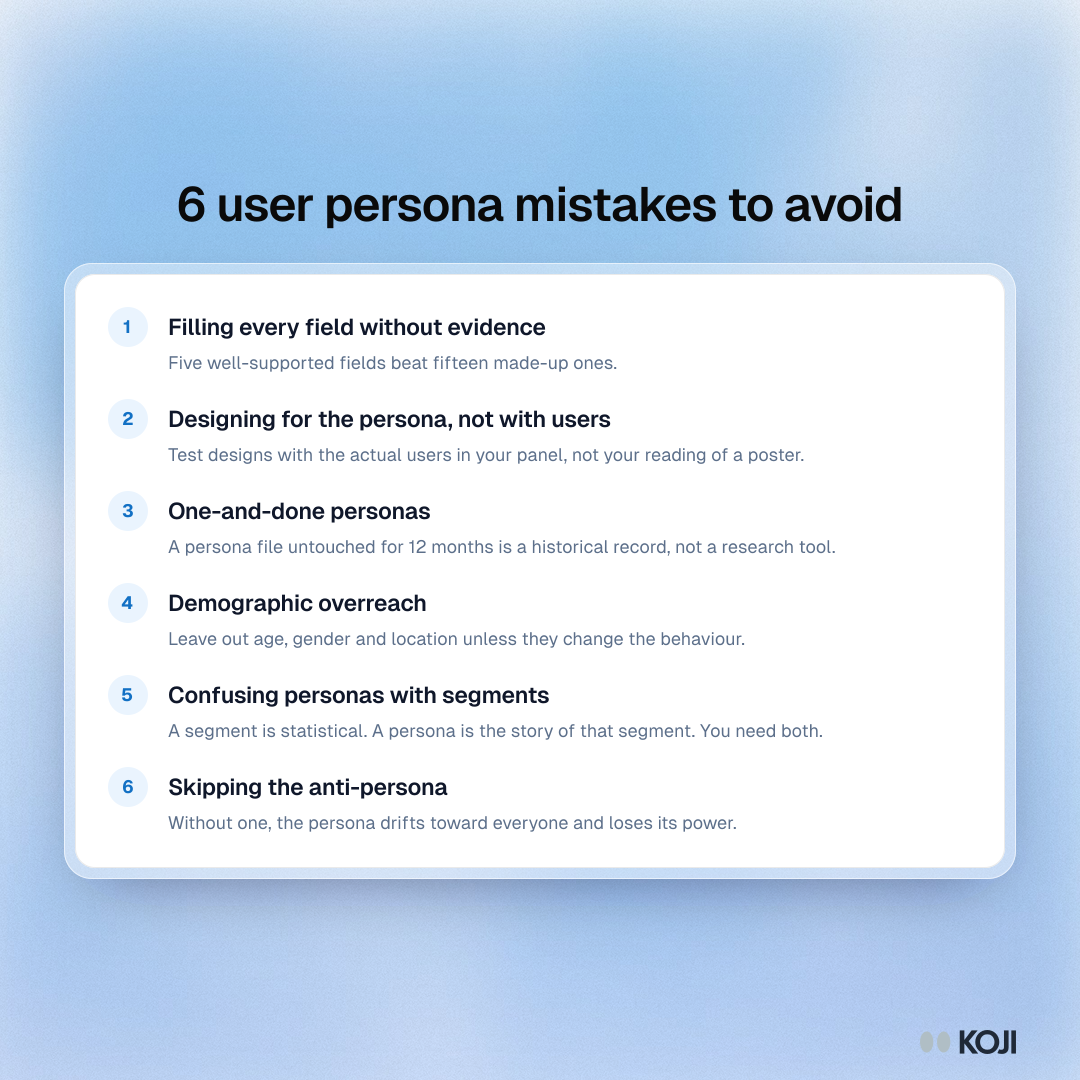
List of six user persona mistakes: unsupported fields, designing for a poster, one-off personas, demographic overreach, persona vs segment, no anti-persona.

Guide

6 user persona mistakes to avoid
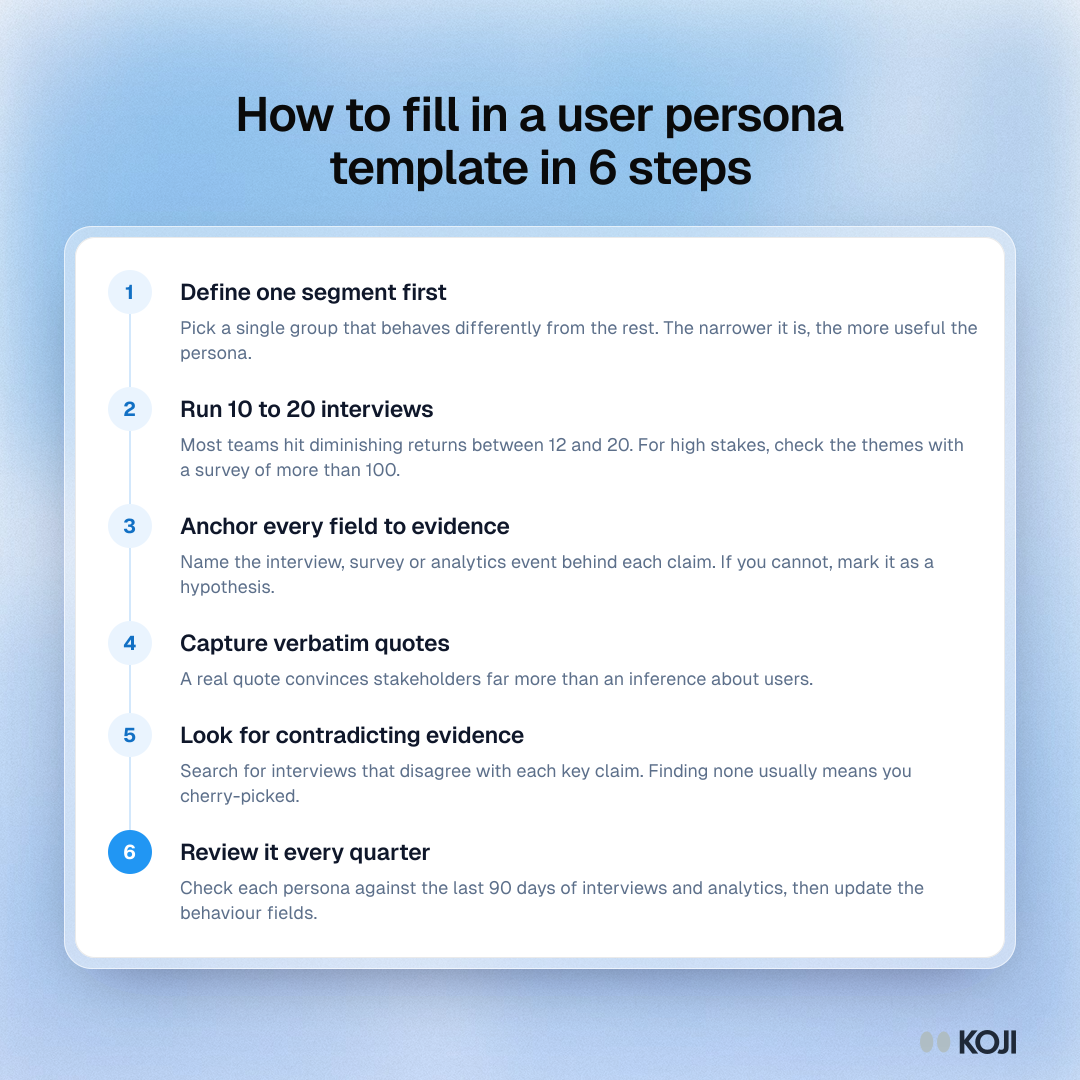
Process showing six steps to fill in a persona template: define a segment, run 10 to 20 interviews, cite evidence, quote, test and review quarterly.

Process

How to fill in a user persona template in 6 steps
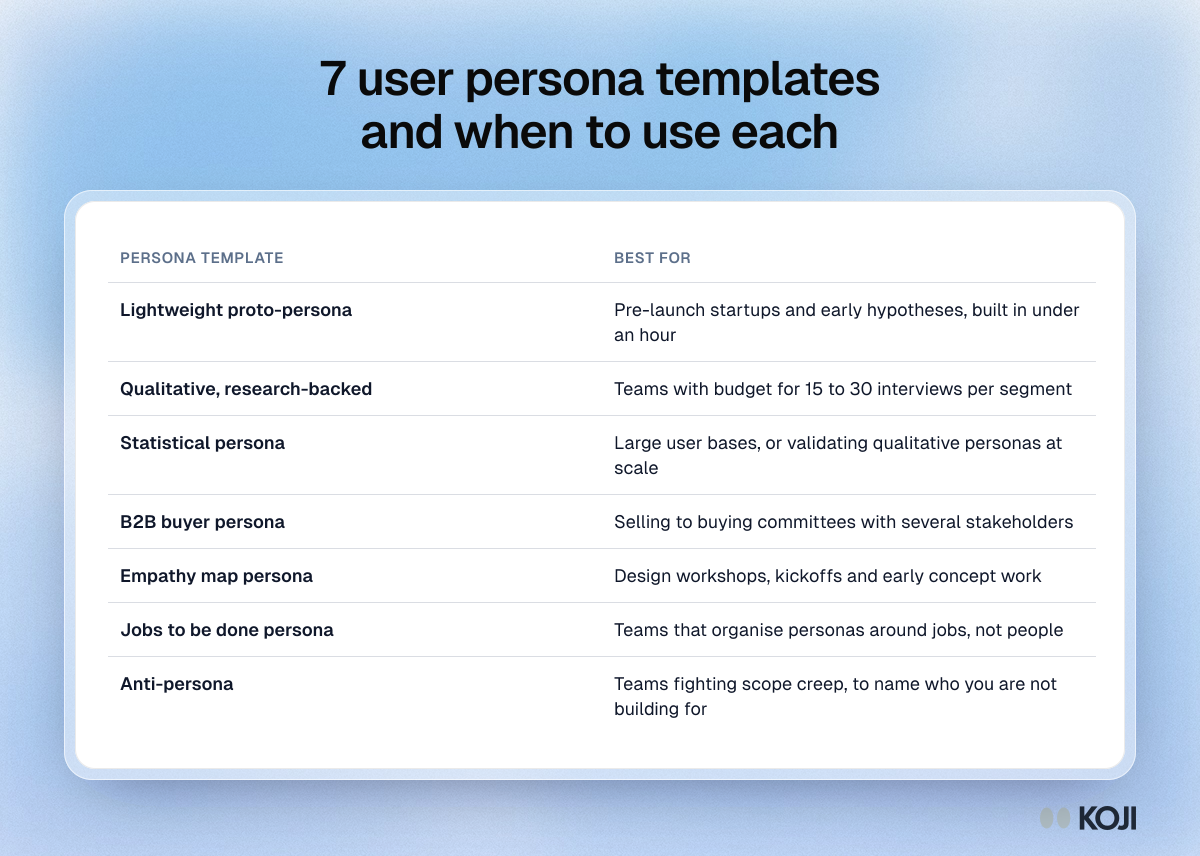
Table of seven user persona templates, from proto-persona and research-backed to statistical, buyer, empathy map, jobs to be done and anti-persona.

Reference table

7 user persona templates and when to use each
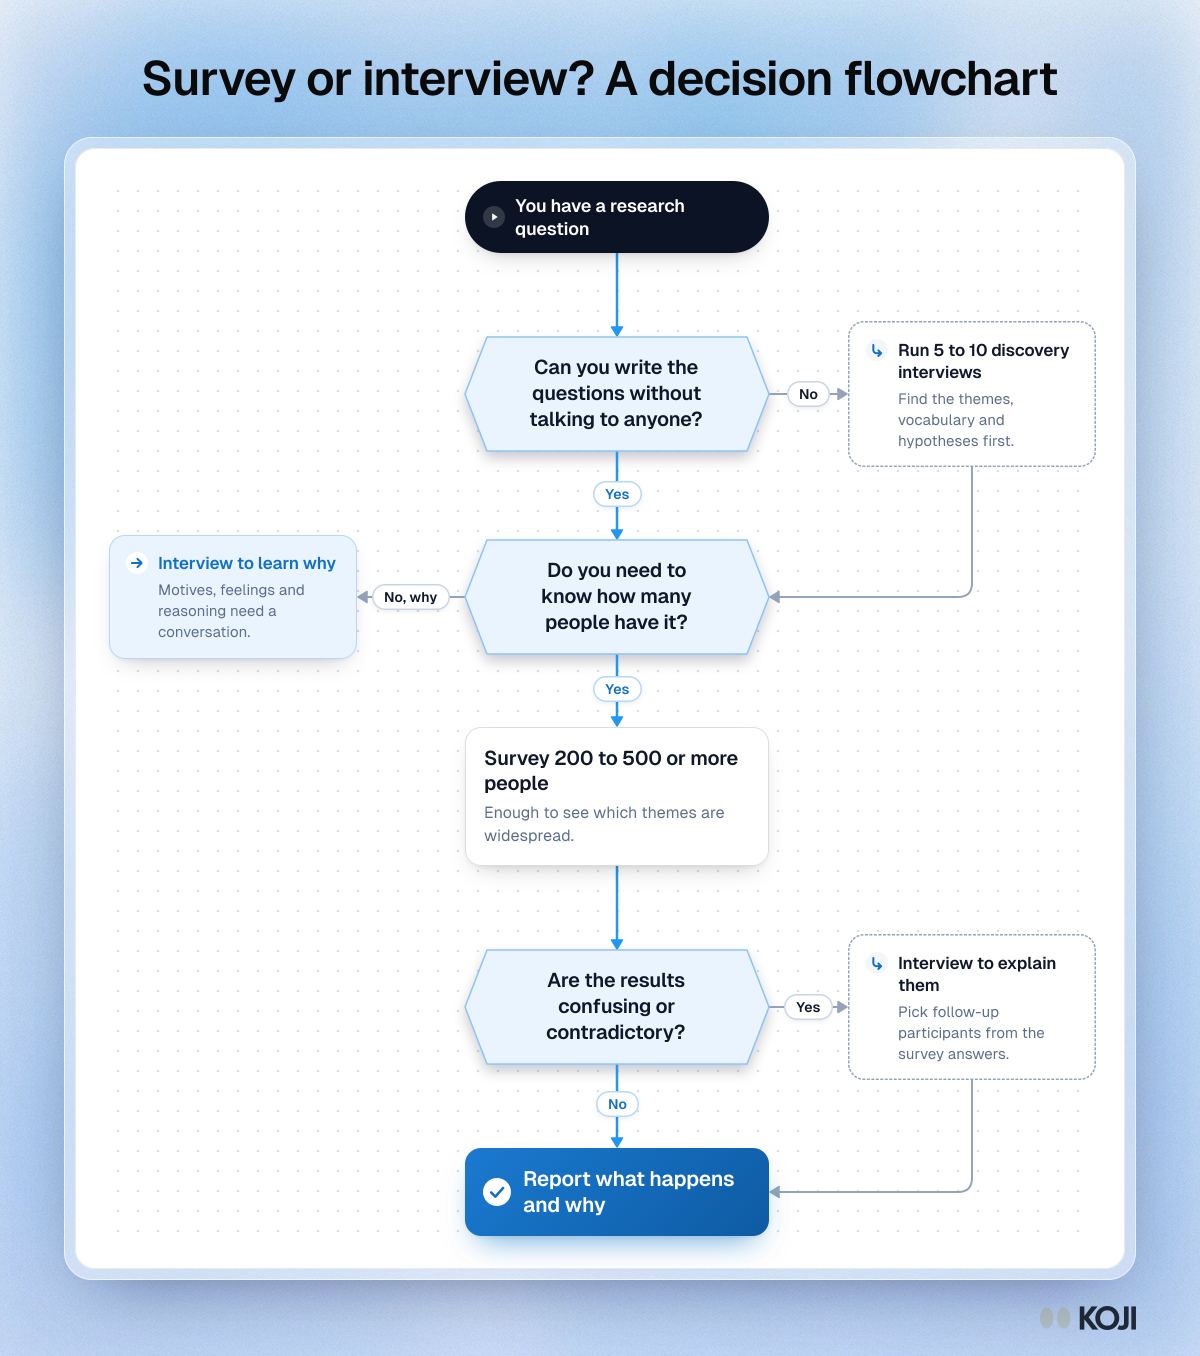
Flowchart for choosing a survey or an interview: three yes or no questions, two interview detours and one exit, ending in a report of what and why.

Flowchart

Survey or interview? A decision flowchart
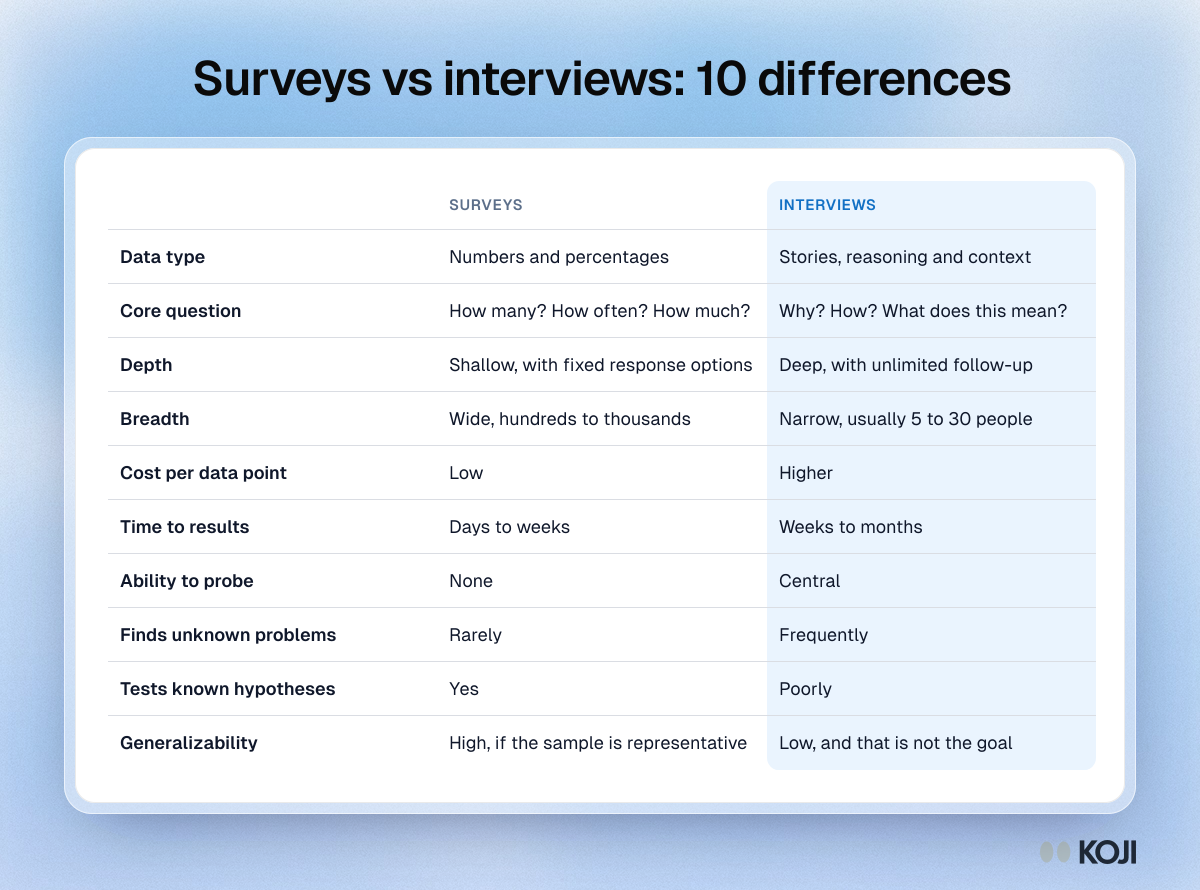
Table comparing surveys and interviews on ten points, from data type, depth and breadth to cost, speed and finding unknown problems.

Reference table

Surveys vs interviews: 10 differences
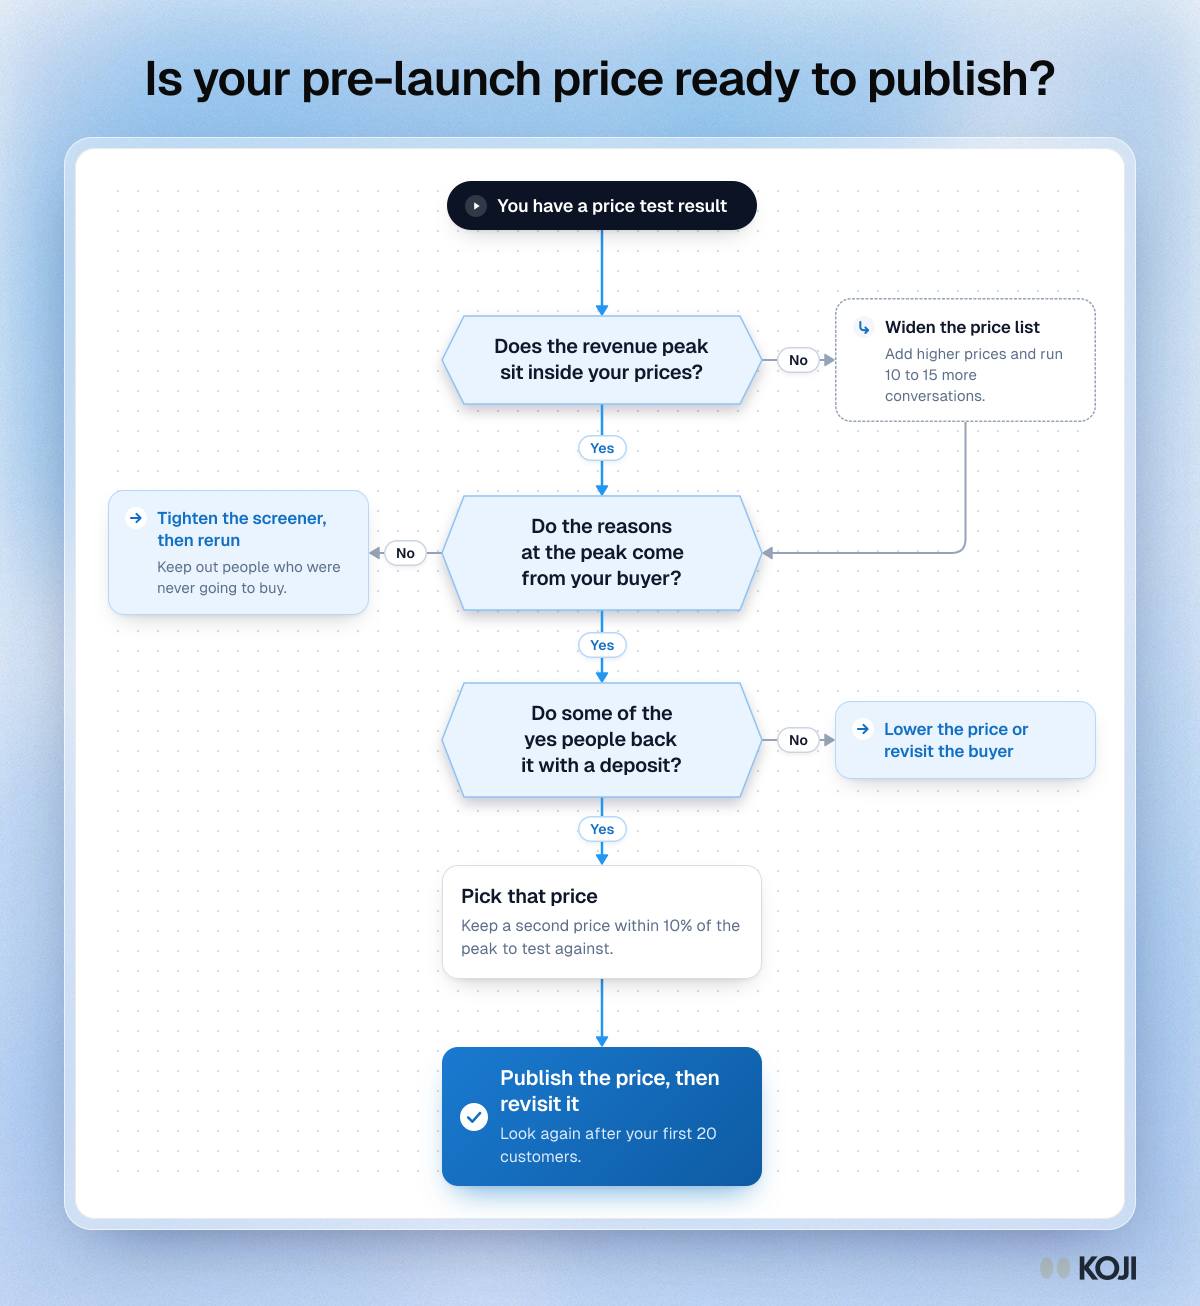
Flowchart for deciding whether a pre-launch price is ready to publish: three questions about the peak, the buyer and a deposit, with one side step.

Flowchart

Is your pre-launch price ready to publish?
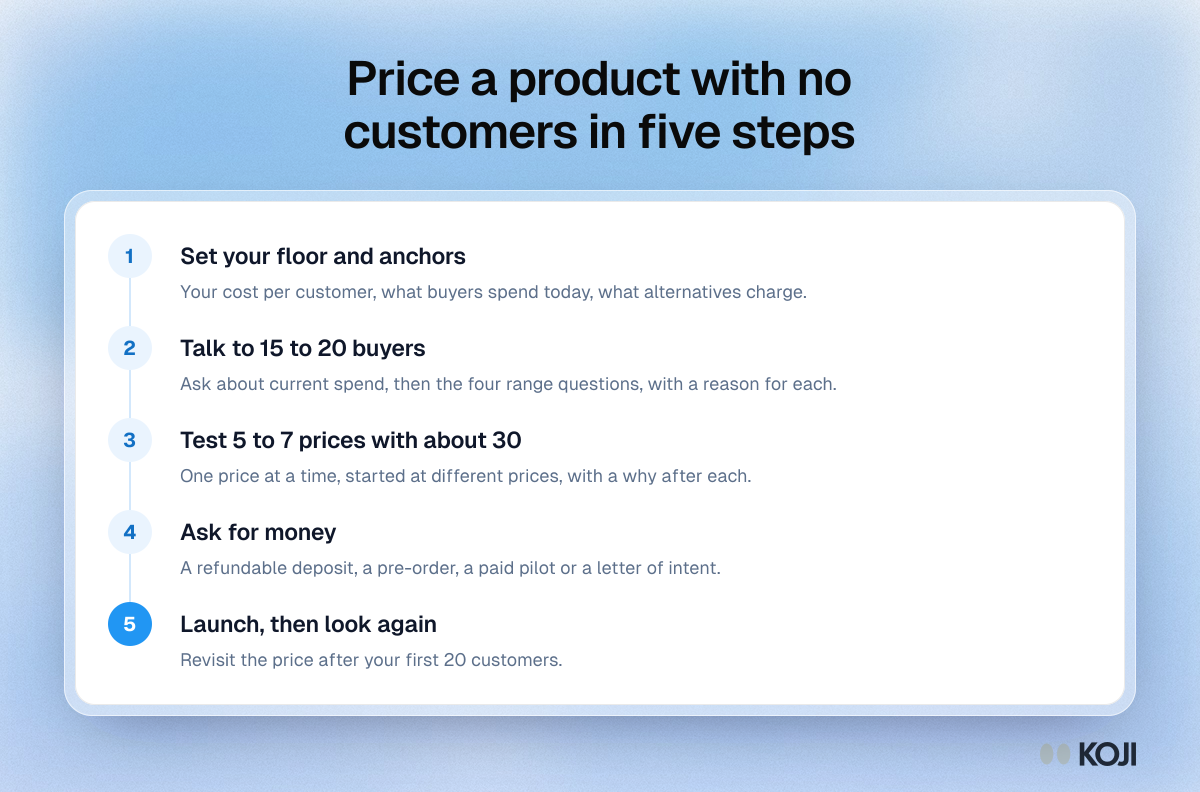
Process showing five steps to price a product with no customers: set anchors, talk to buyers, test prices, ask for money, launch and revisit.

Process

Price a product with no customers in five steps
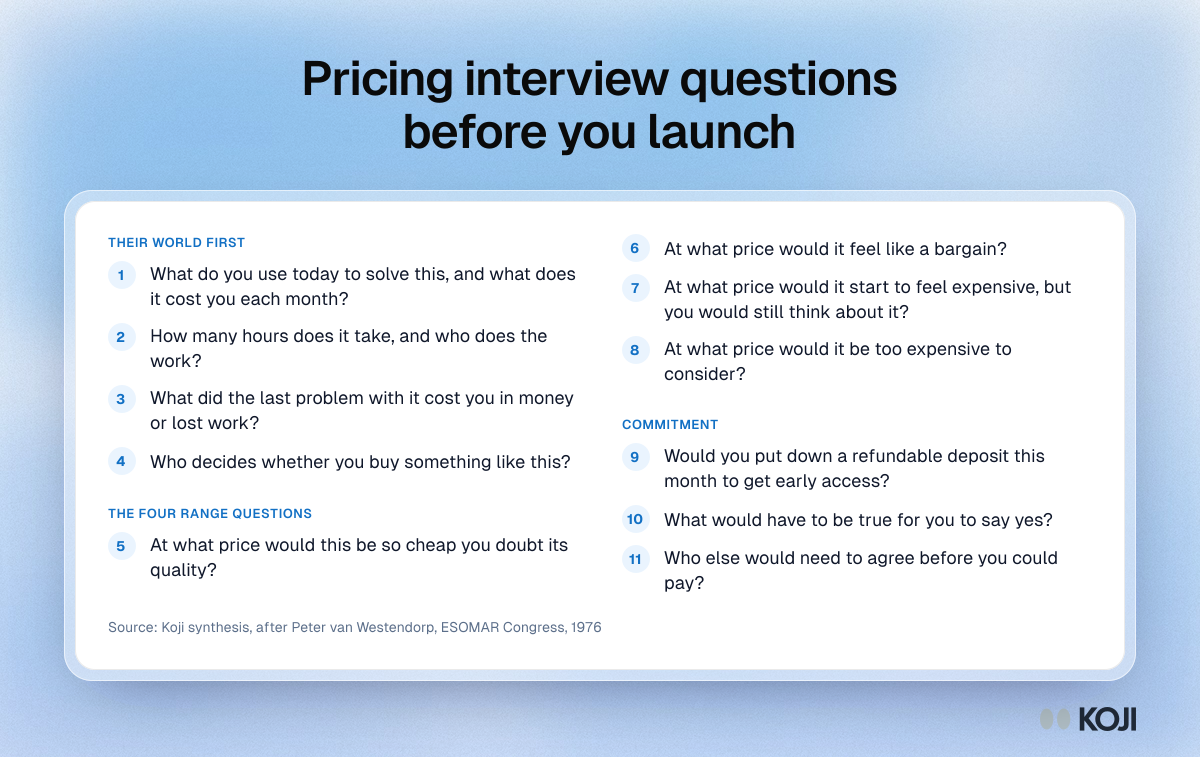
Question bank for pricing a product before launch, in three parts: their current spend, the four Van Westendorp range questions and commitment.

Question bank

Pricing interview questions before you launch
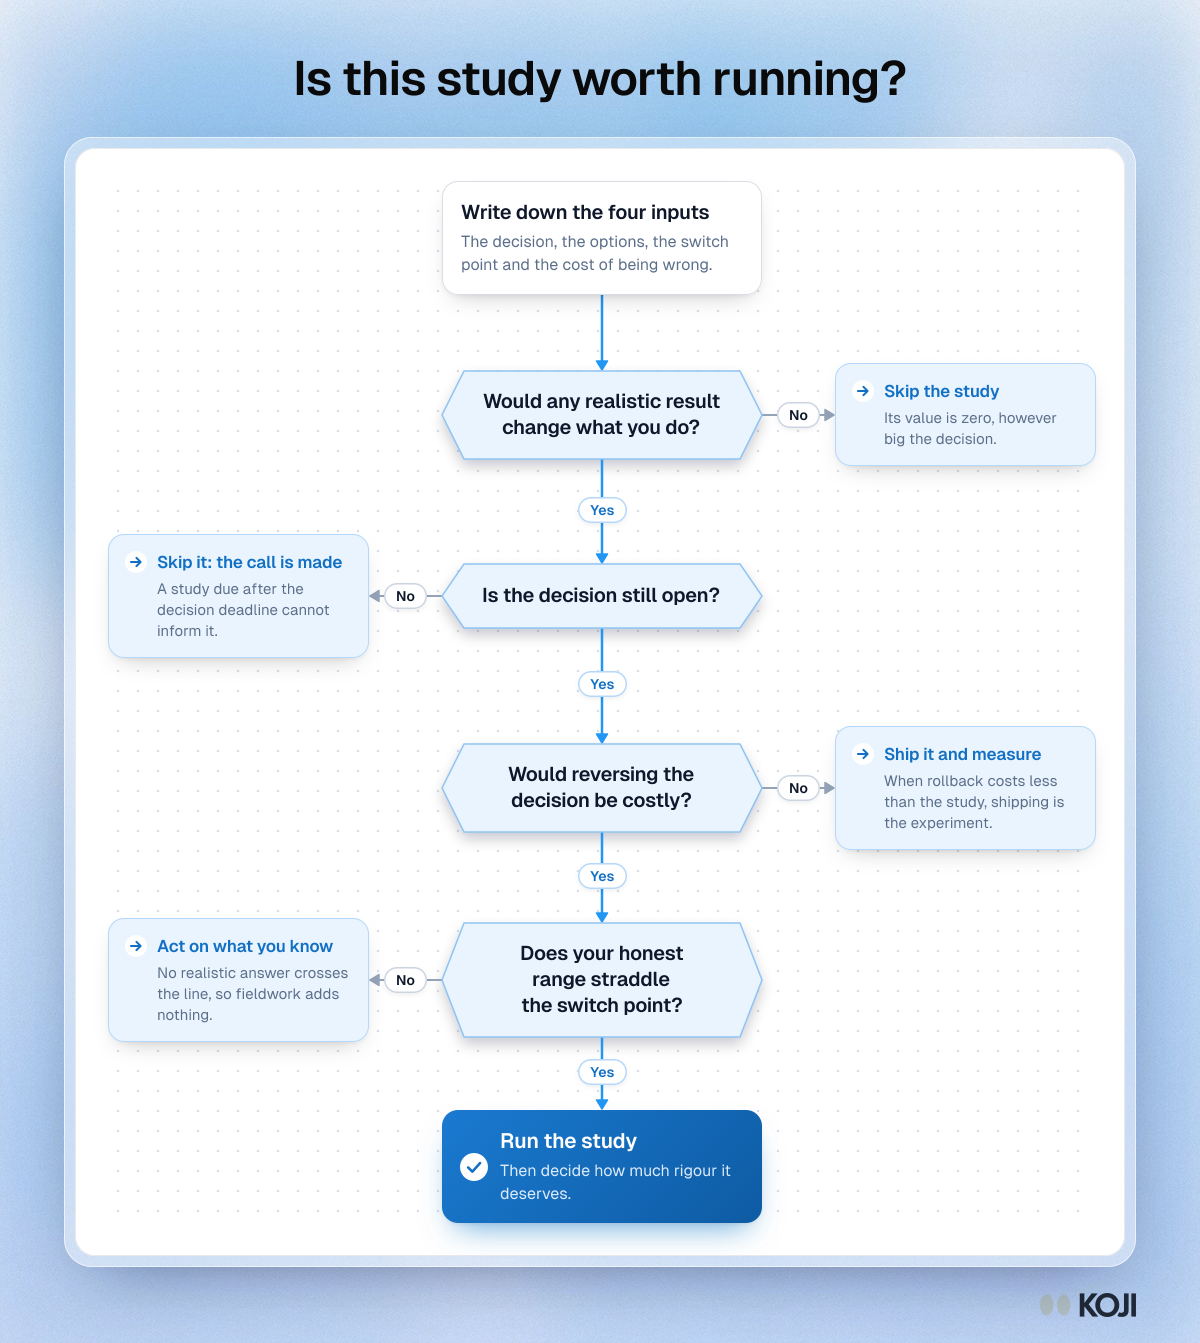
Flowchart for deciding whether a study is worth running: four yes or no questions on switch point, open decision, reversibility and range, then run it.

Flowchart

Is this study worth running?
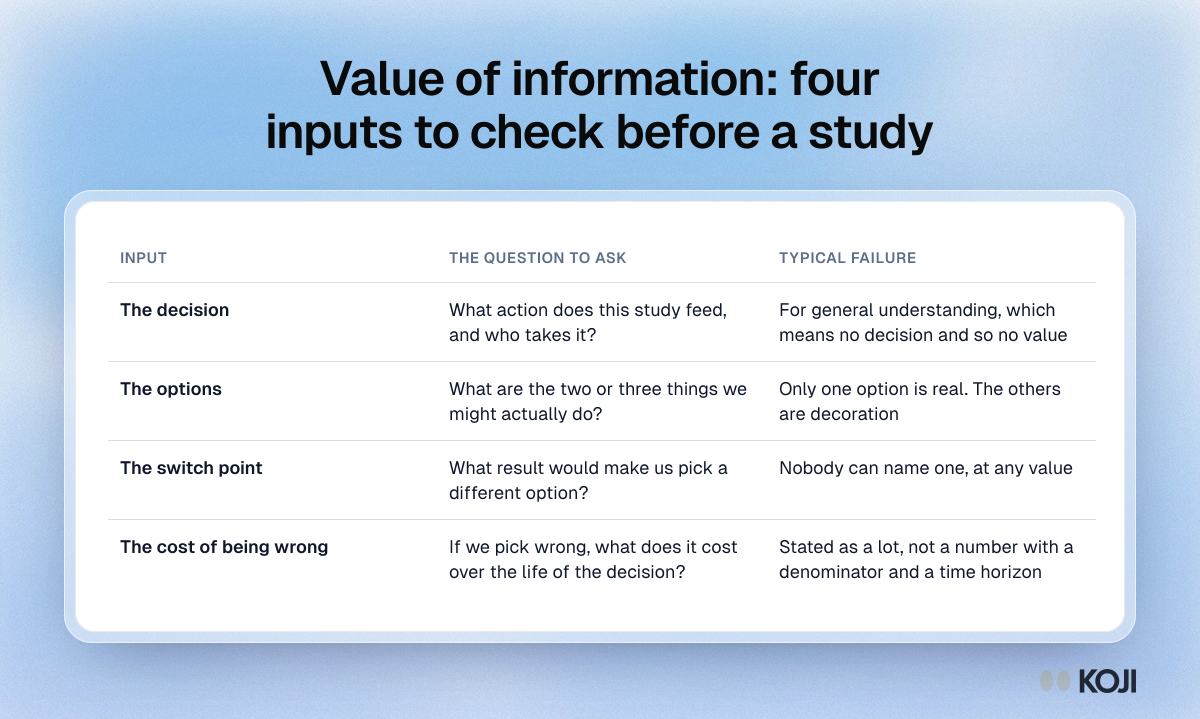
Table of the four inputs for a value of information check: the decision, the options, the switch point and the cost of being wrong, with how each one fails.

Reference table

Value of information: four inputs to check before a study
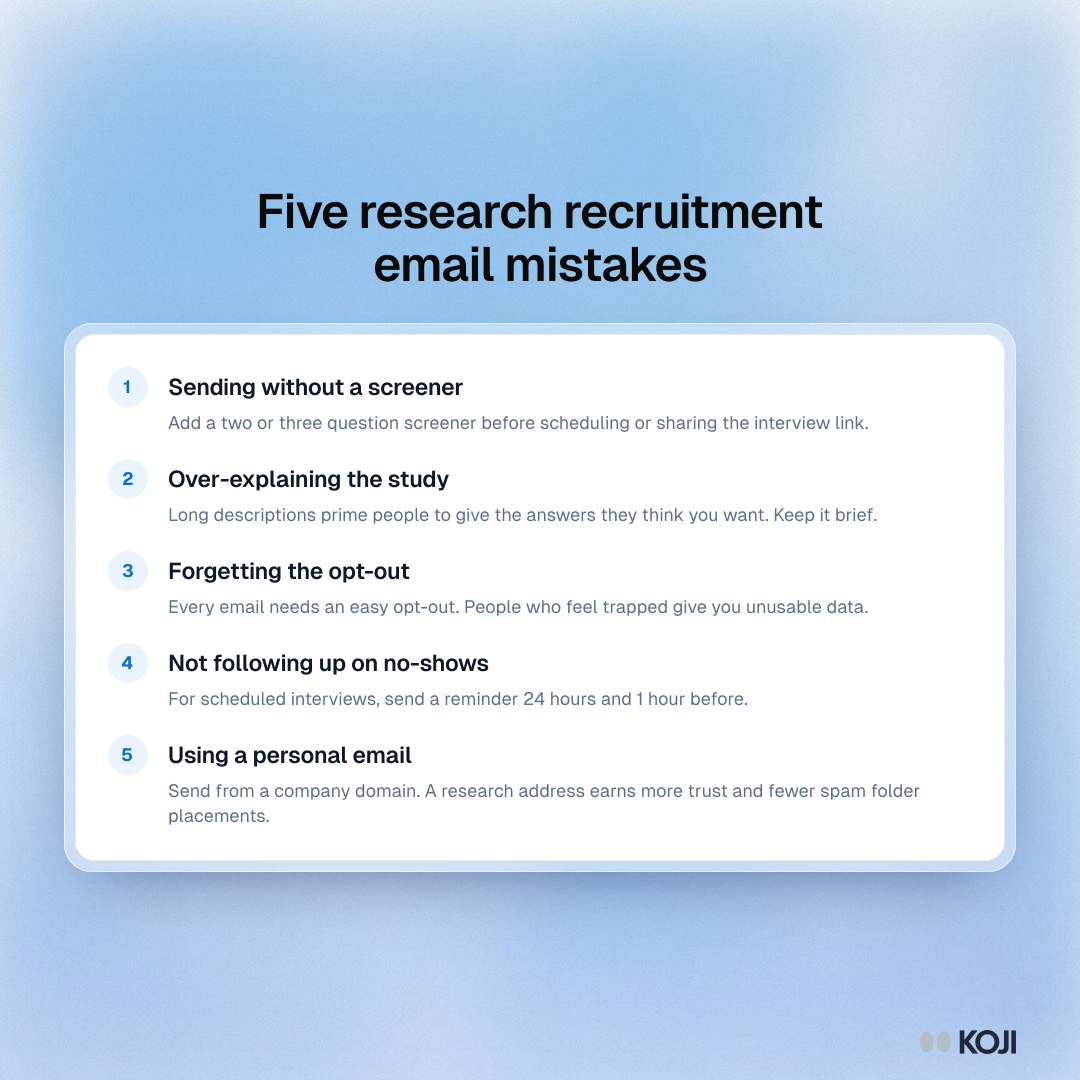
List of five research recruitment email mistakes: no screener, over-explaining the study, no opt-out, no reminders for no-shows and a personal sender address.

Guide

Five research recruitment email mistakes
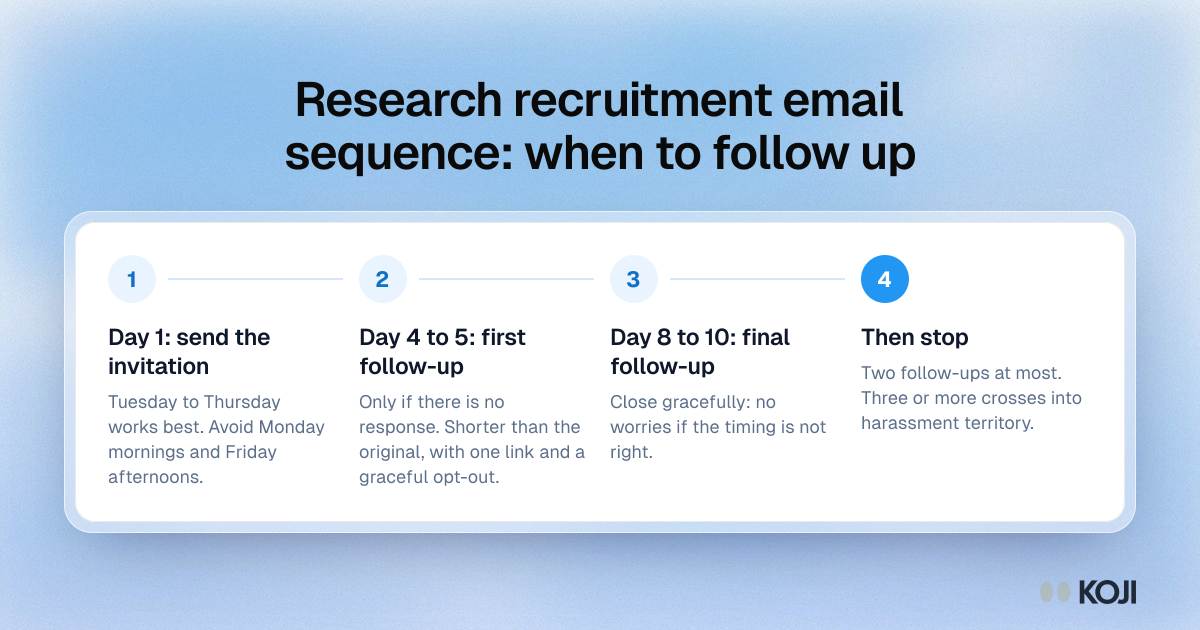
Process for a research recruitment email sequence: invitation on day 1, first follow-up on day 4 to 5, final follow-up on day 8 to 10, then stop.

Process

Research recruitment email sequence: when to follow up
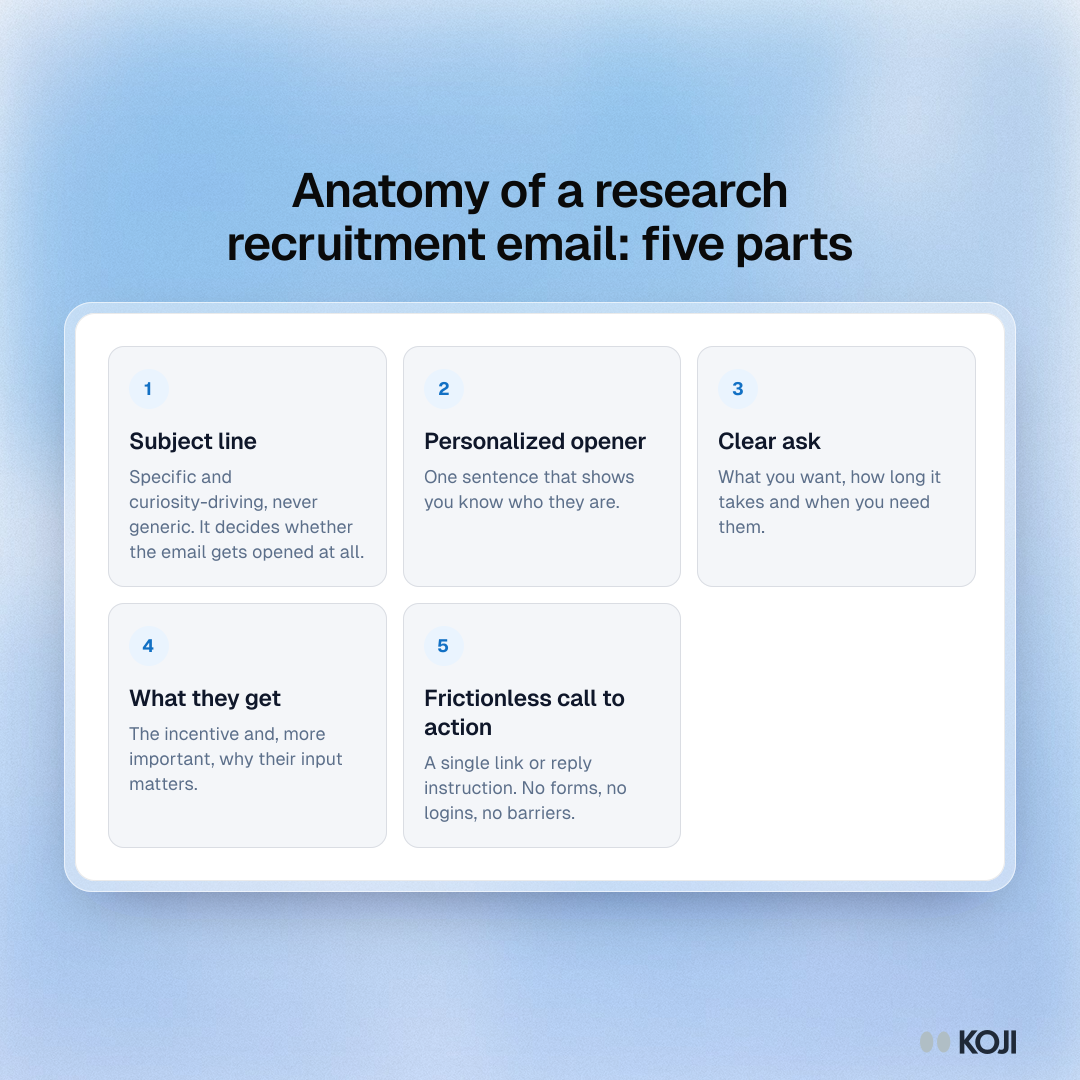
Framework of the five parts of a research recruitment email: subject line, personalized opener, clear ask, what they get and a frictionless call to action.

Framework

Anatomy of a research recruitment email: five parts
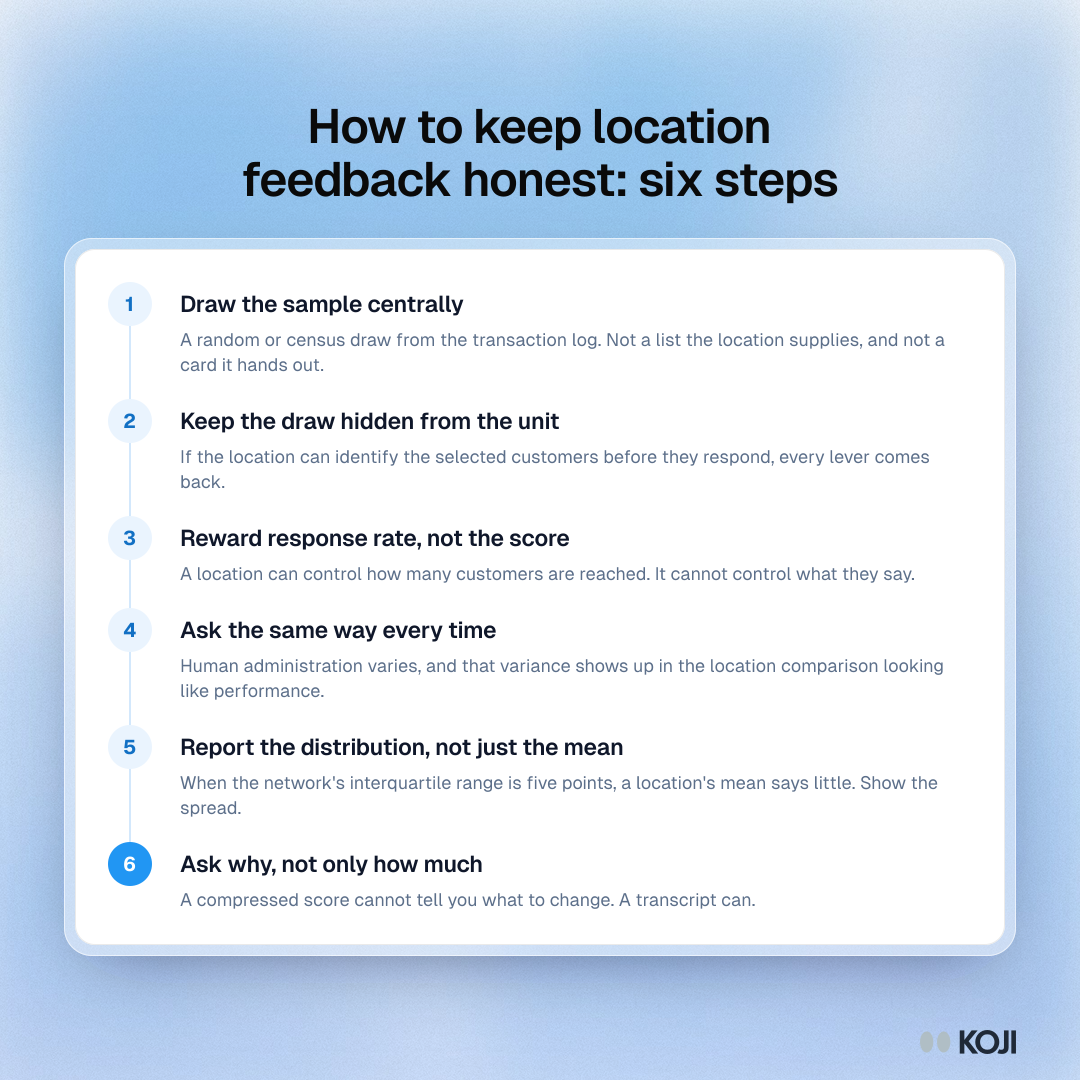
Process in six steps for multi-location feedback: draw the sample centrally, hide the draw, reward response rate, ask the same way, report the spread, ask why.

Process

How to keep location feedback honest: six steps
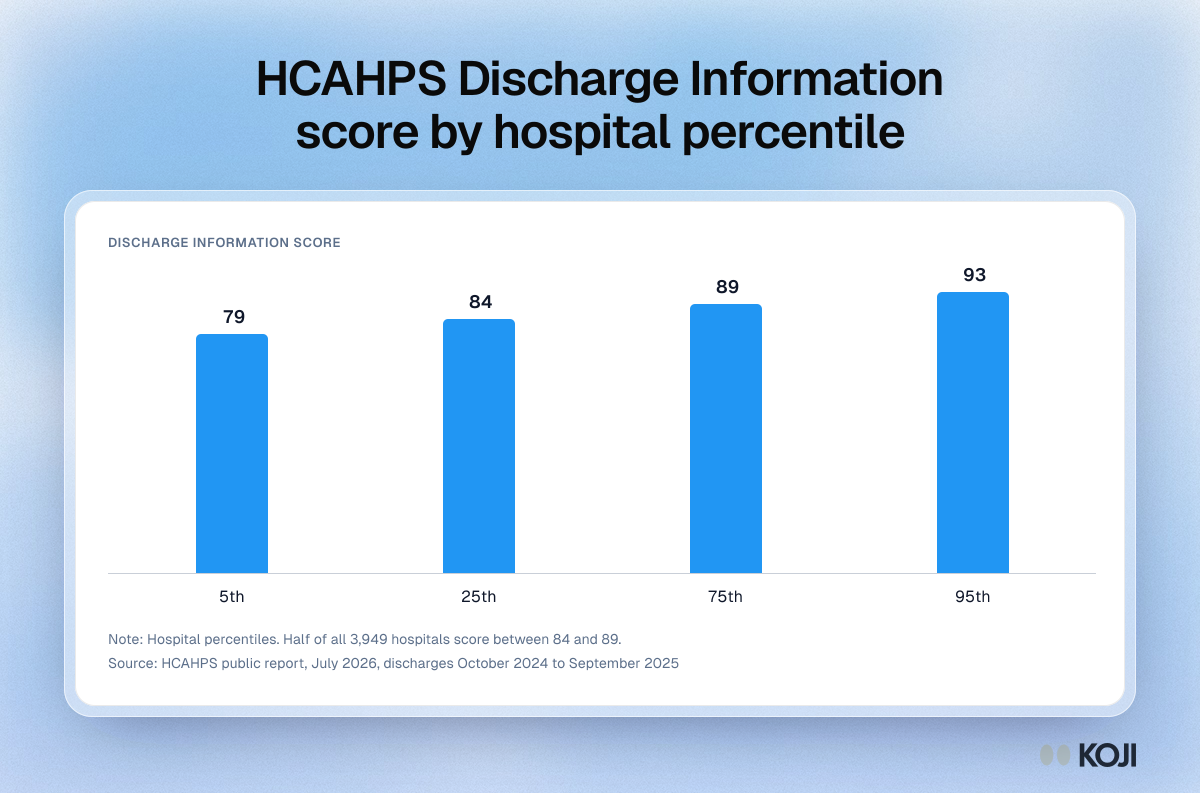
Column chart of HCAHPS Discharge Information scores by hospital percentile: 79 at the 5th, 84 at the 25th, 89 at the 75th and 93 at the 95th.

Column chart

HCAHPS Discharge Information score by hospital percentile
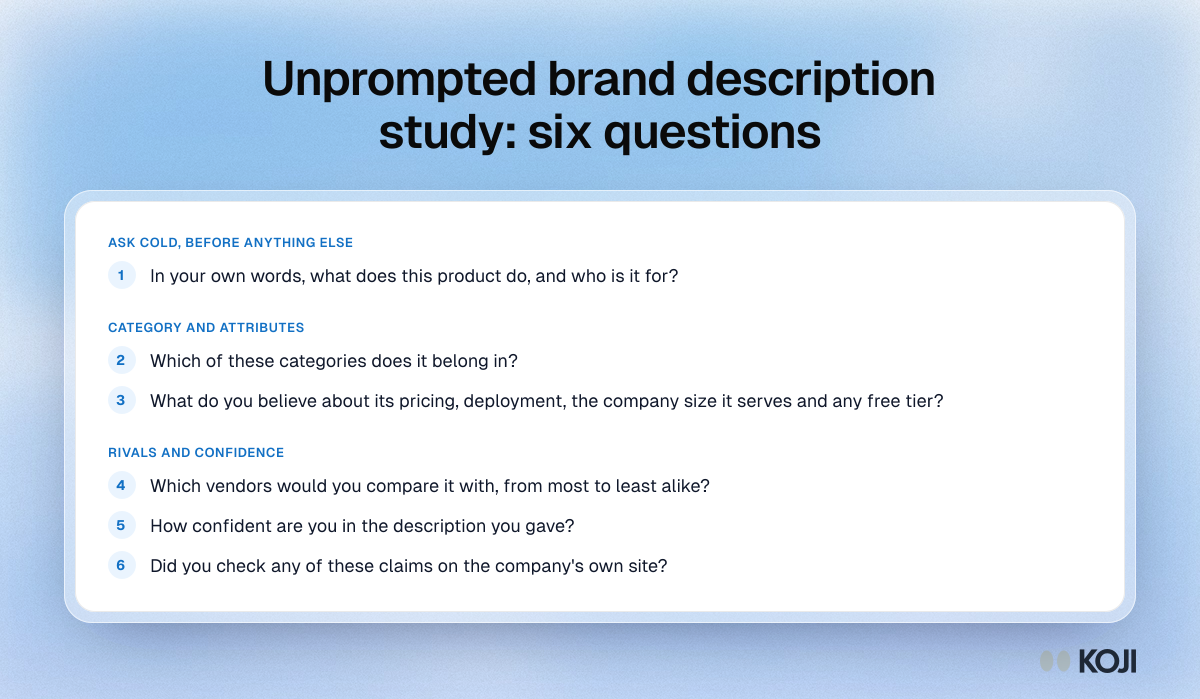
Question bank for an unprompted brand description study: an open description first, then category, attributes, comparable vendors, confidence and fact checking.

Question bank

Unprompted brand description study: six questions
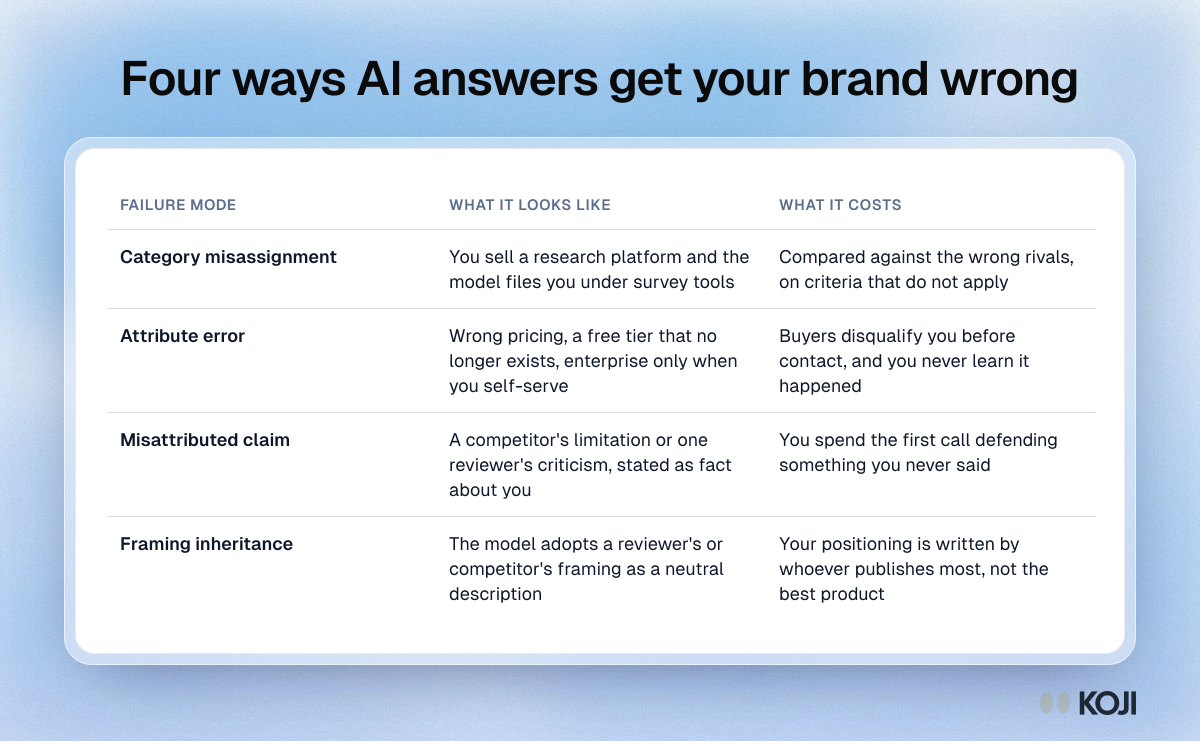
Table of four ways AI answers misdescribe a brand: category misassignment, attribute error, misattributed claim and framing inheritance, with what each costs.

Reference table

Four ways AI answers get your brand wrong
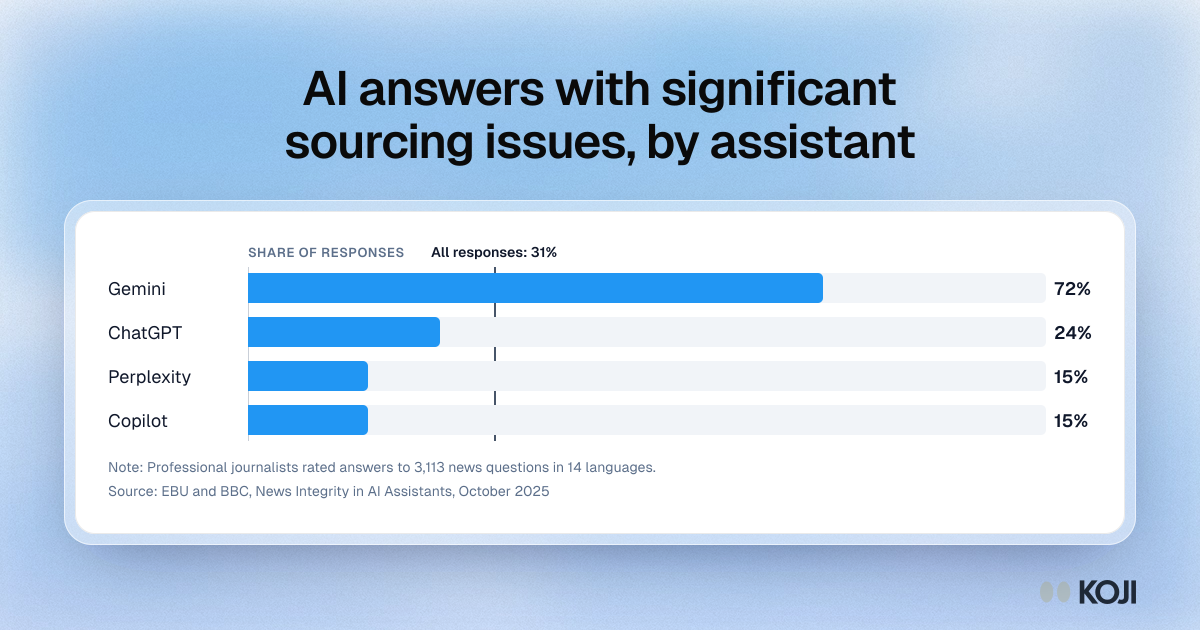
Bar chart of AI answers with significant sourcing issues: Gemini 72%, ChatGPT 24%, Perplexity 15% and Copilot 15%, against 31% across all responses.

Bar chart

AI answers with significant sourcing issues, by assistant
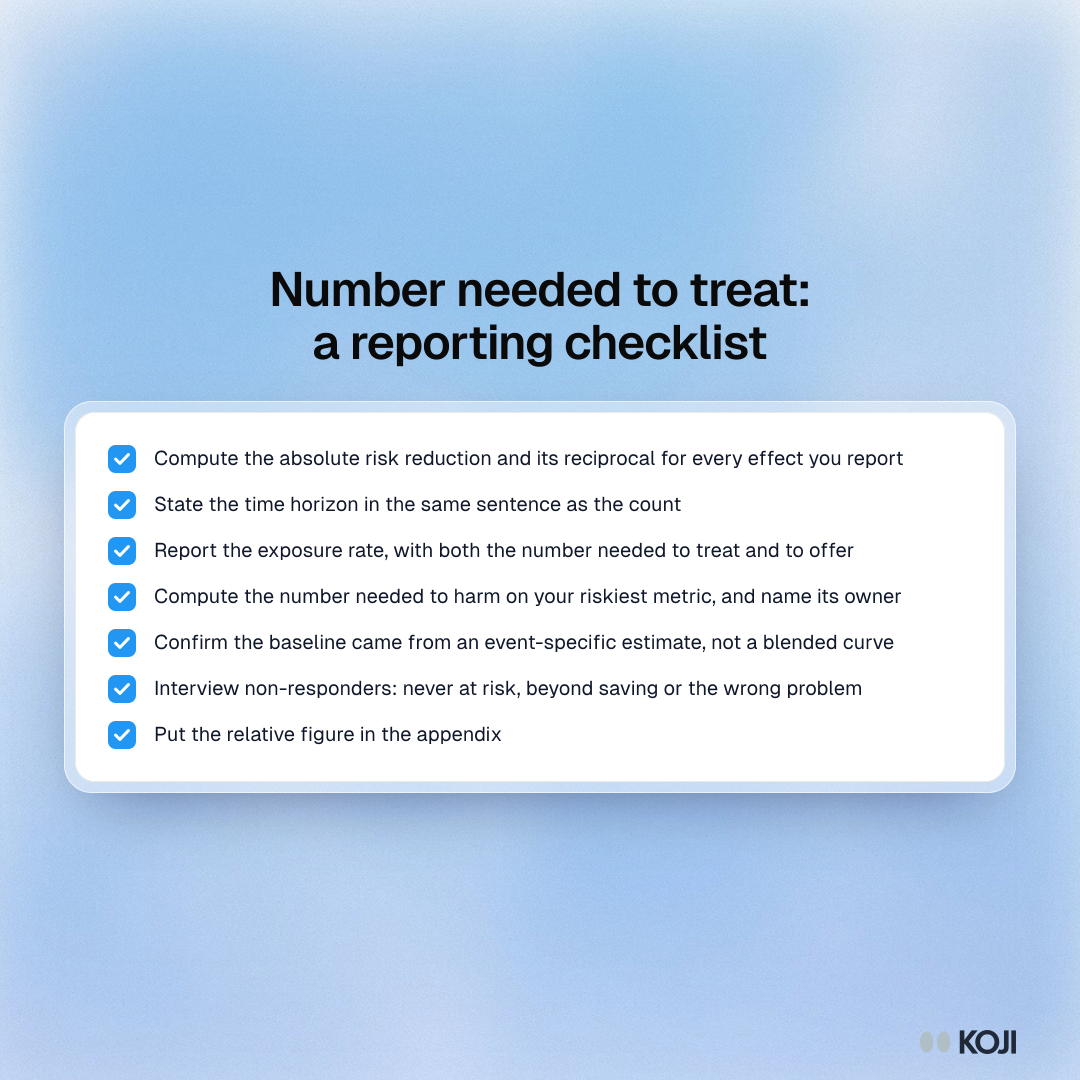
Checklist of seven steps for reporting a product effect as a number needed to treat, from computing the absolute reduction to interviewing non-responders.

Checklist

Number needed to treat: a reporting checklist
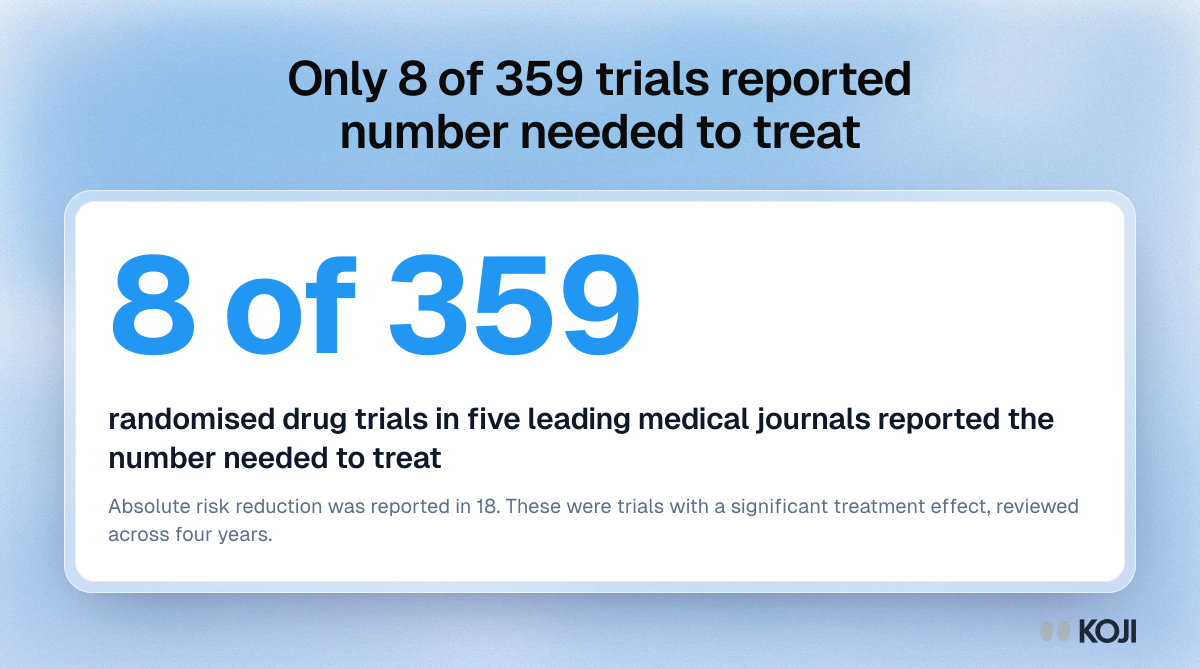
Stat card: 8 of 359 randomised drug trials in five leading medical journals reported the number needed to treat, and 18 reported absolute risk reduction.

Key figure

Only 8 of 359 trials reported number needed to treat
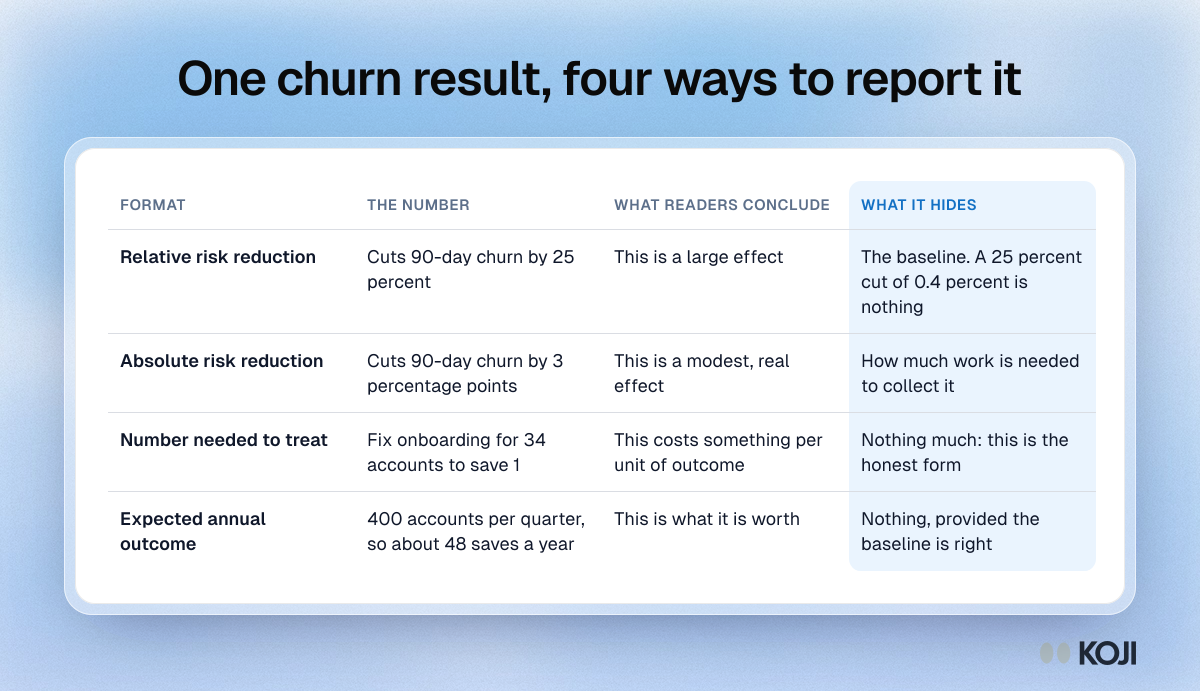
Table showing one onboarding result, churn down from 12% to 9%, as a relative reduction, an absolute reduction, a number needed to treat and an annual count.

Reference table

One churn result, four ways to report it