Free to save and share

Frameworks and cheat sheets for customer research

Every framework, checklist and comparison from our guides, as an image you can download, drop into a deck or share with your team.
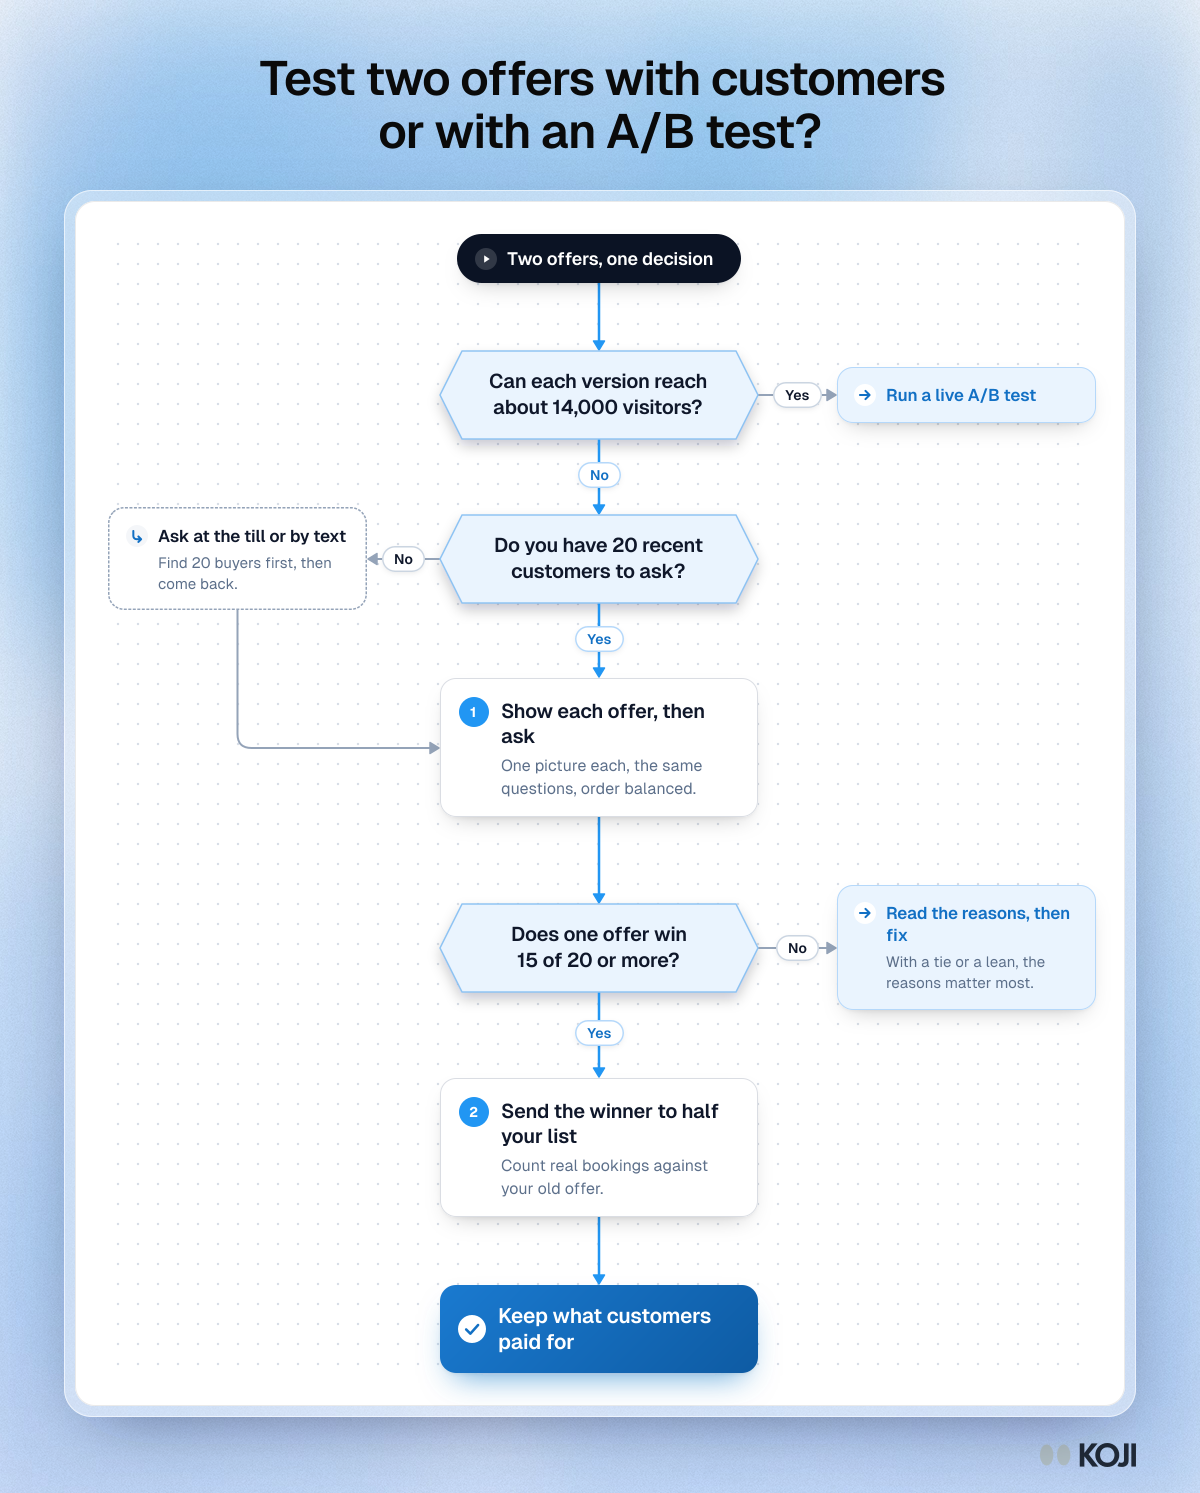
Flowchart for choosing between a live A/B test and asking 20 customers about two offers: three questions, one side step, ending in a split send.

Flowchart

Test two offers with customers or with an A/B test?
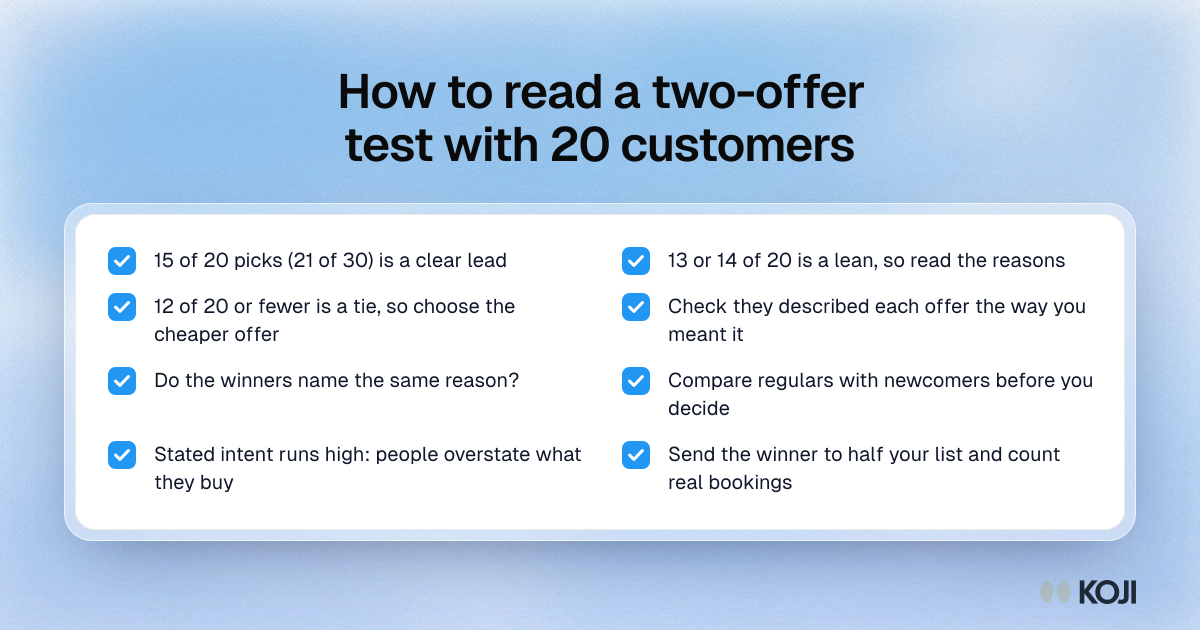
Checklist for reading a two-offer customer test: count the picks, read the reasons, compare regulars with newcomers and confirm with a real send.

Checklist

How to read a two-offer test with 20 customers
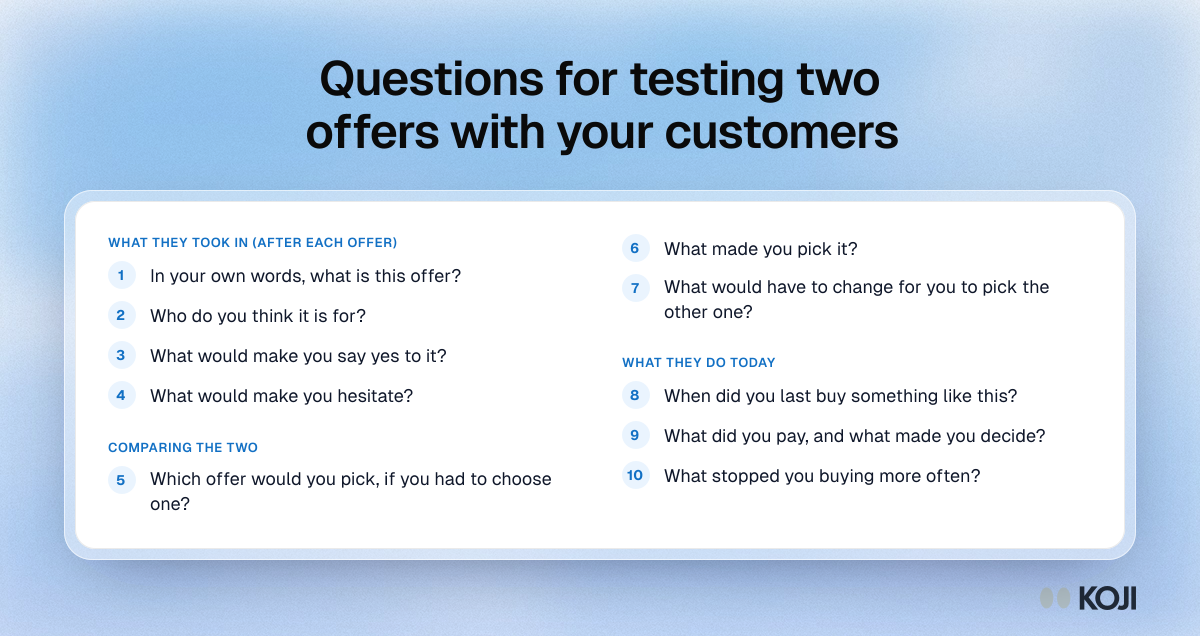
Question bank for testing two offers with customers: what they took in, a head-to-head choice, and what they do today. Ten questions in three sections.

Question bank

Questions for testing two offers with your customers
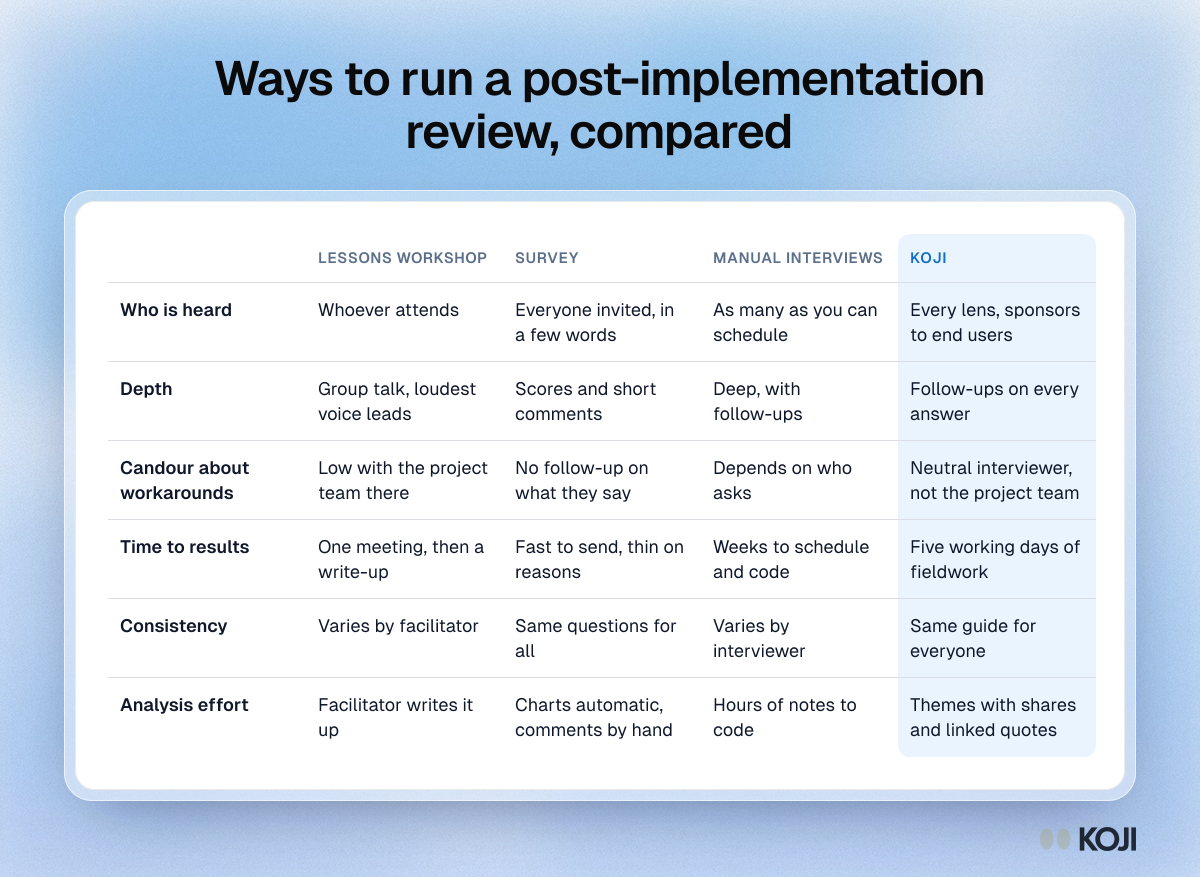
Table comparing a lessons-learned workshop, a survey, manual interviews and Koji for a post-implementation review on reach, depth, candour and analysis effort.

Reference table

Ways to run a post-implementation review, compared
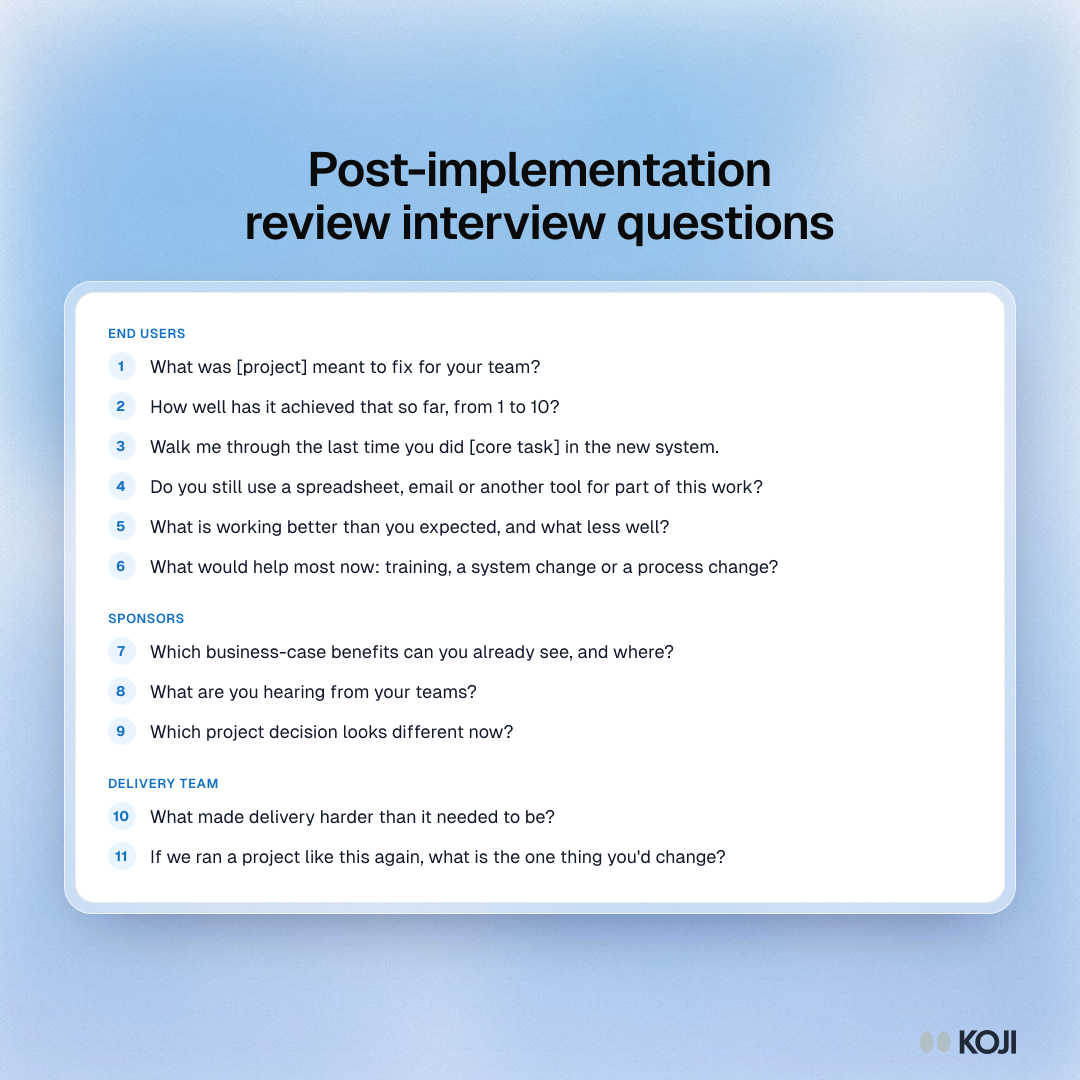
Question bank for a post-implementation review interview with end users, sponsors and the delivery team, in three themed sections.

Question bank

Post-implementation review interview questions
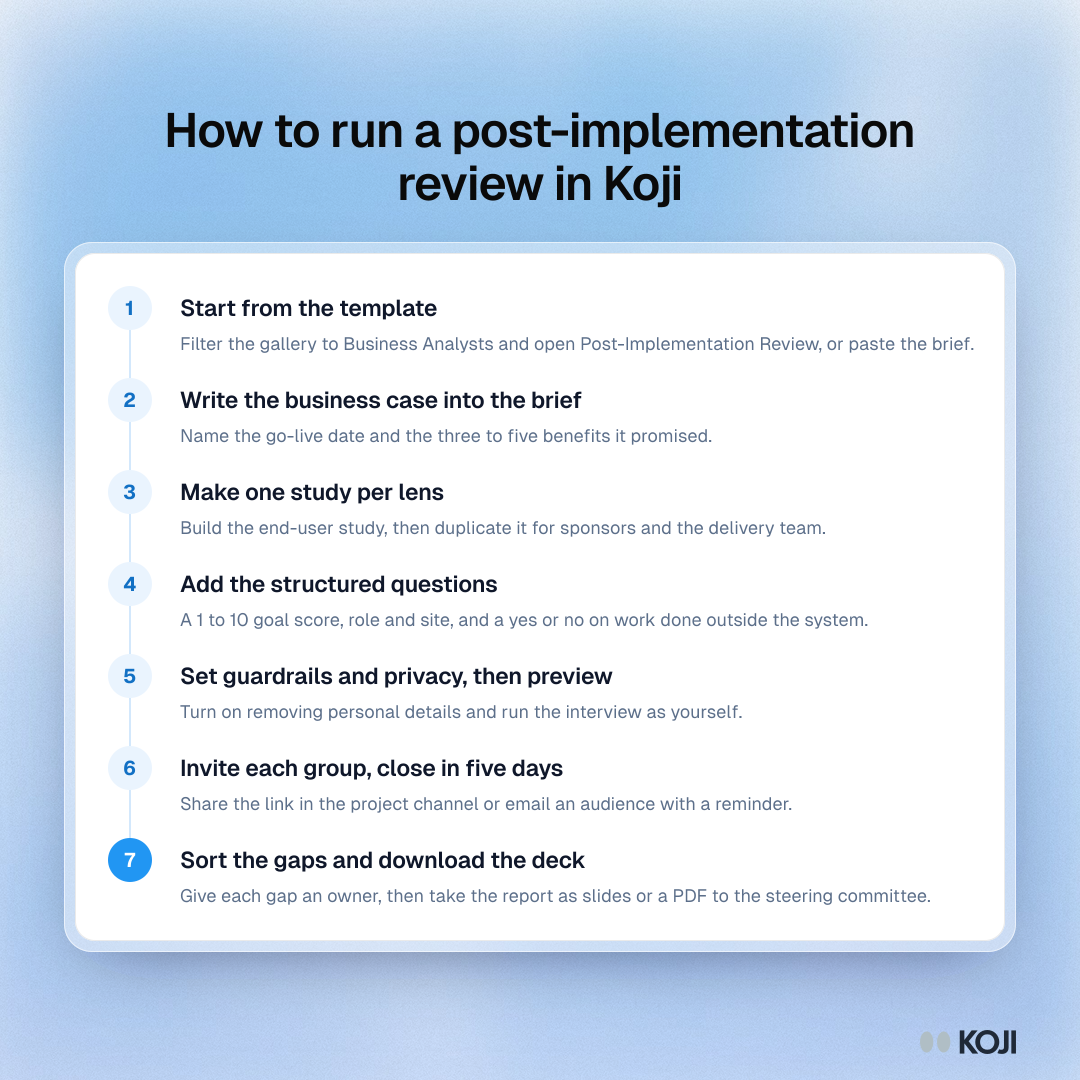
Process showing seven steps to run a post-implementation review in Koji, from the template to a deck for the steering committee.

Process

How to run a post-implementation review in Koji
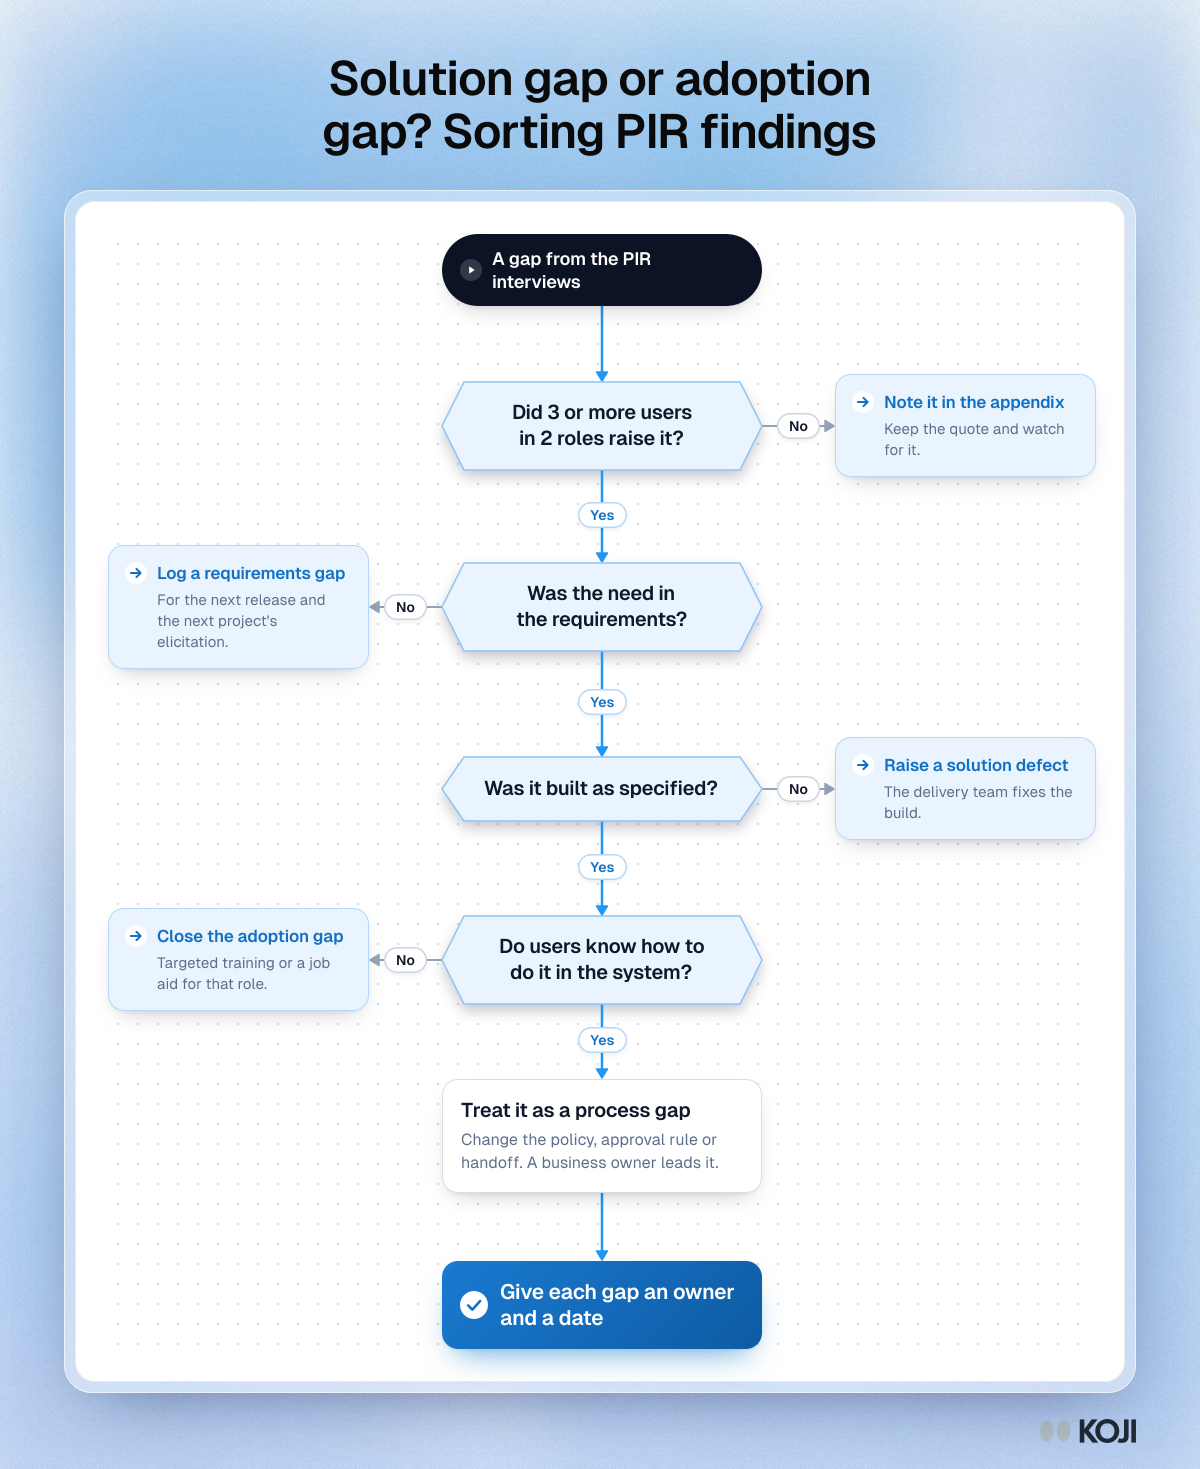
Flowchart for sorting a post-implementation review gap with four yes or no questions, from how many users raised it to requirements, build and training.

Flowchart

Solution gap or adoption gap? Sorting PIR findings
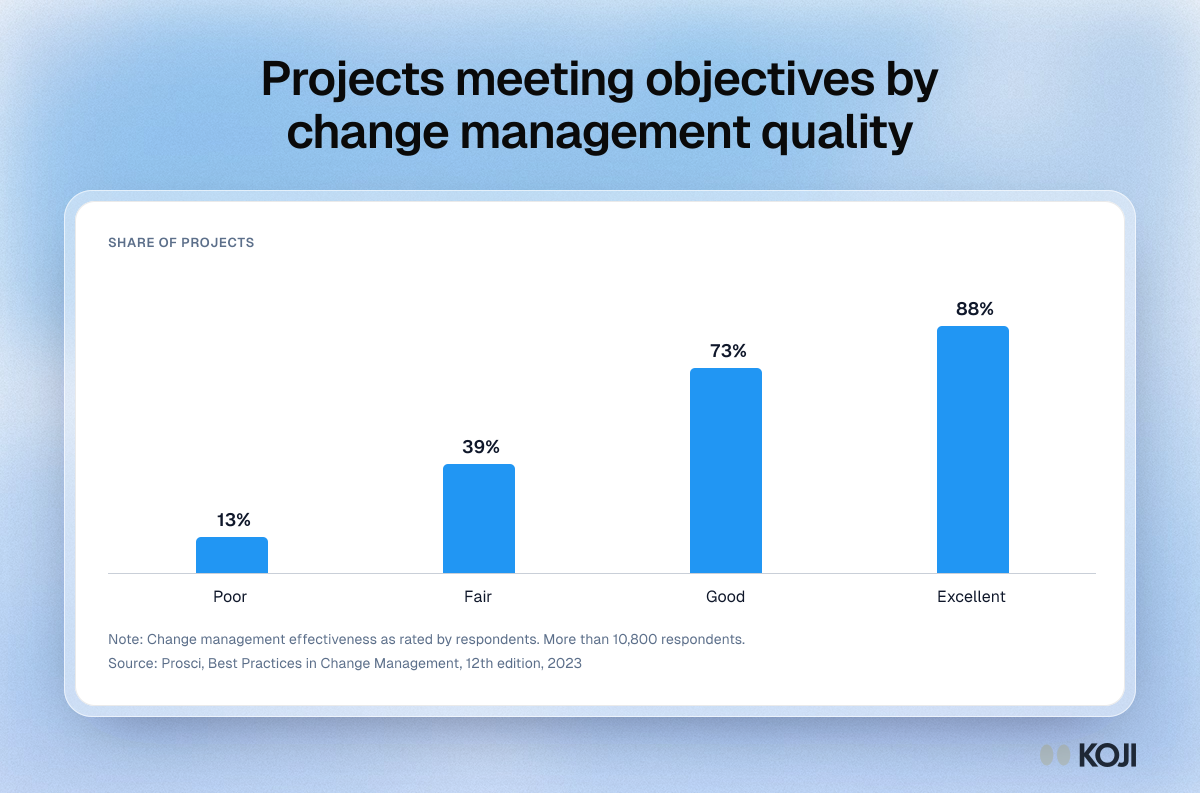
Column chart of the share of projects meeting or exceeding objectives by change management effectiveness: poor 13%, fair 39%, good 73%, excellent 88%.

Column chart

Projects meeting objectives by change management quality
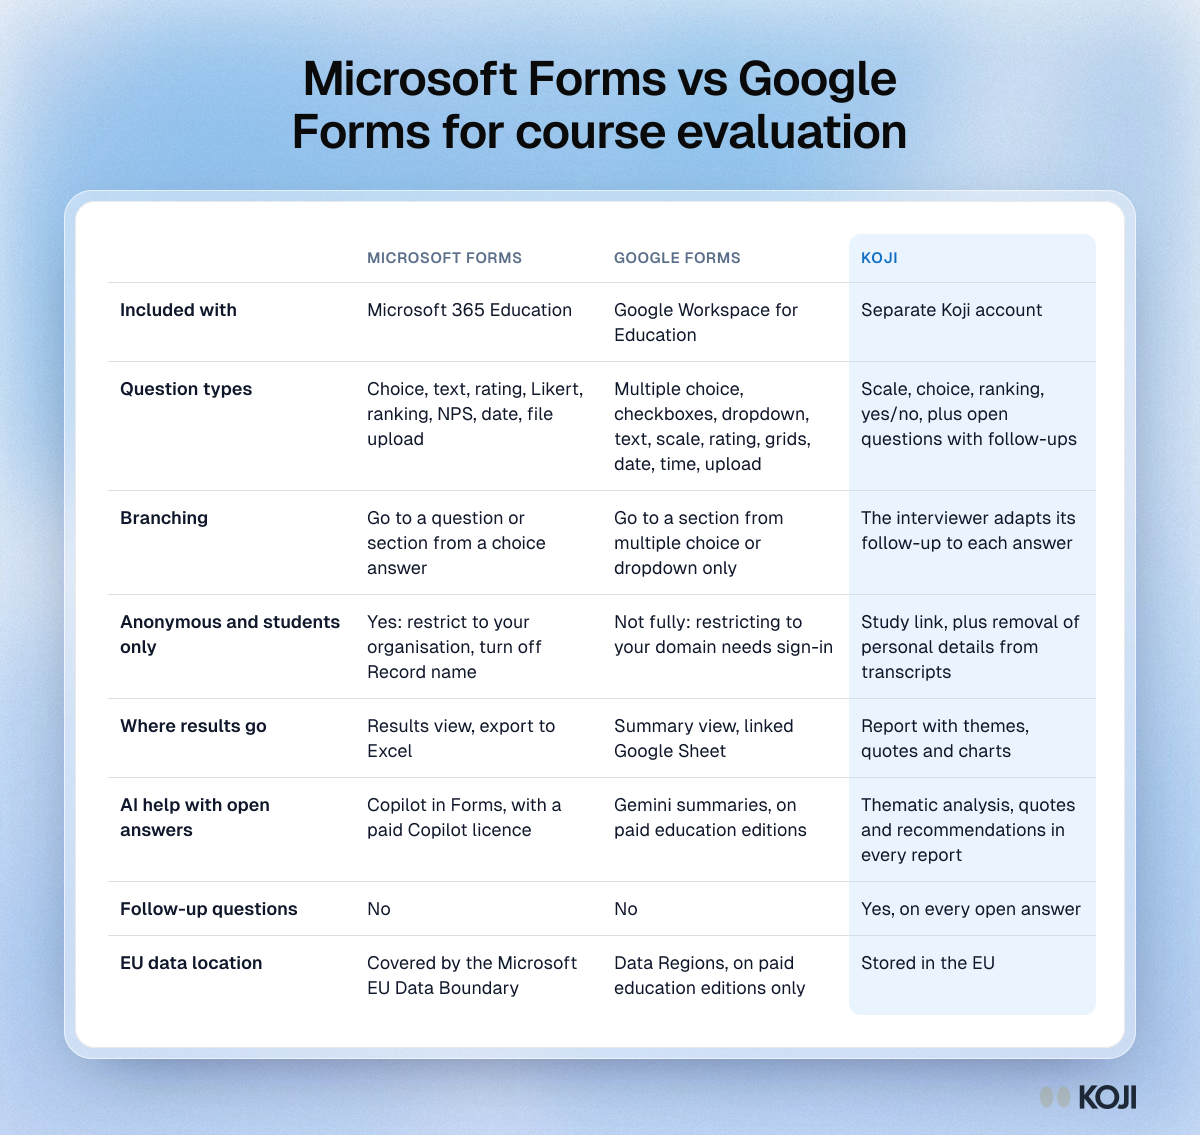
Table comparing Microsoft Forms, Google Forms and Koji for course evaluation on eight points, from question types to EU data location.

Reference table

Microsoft Forms vs Google Forms for course evaluation
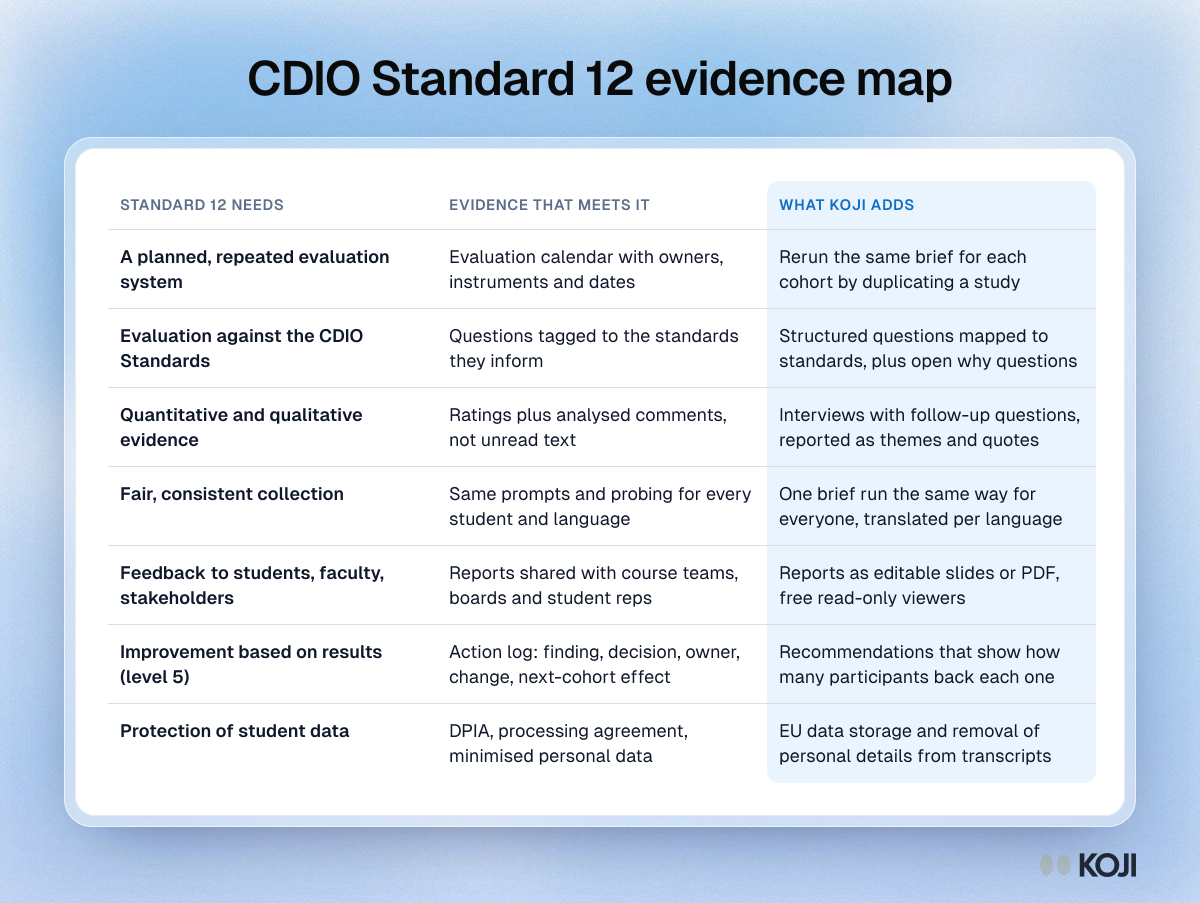
Table mapping seven CDIO Standard 12 requirements to the evidence that meets each one and what Koji adds, ending with an action log.

Reference table

CDIO Standard 12 evidence map
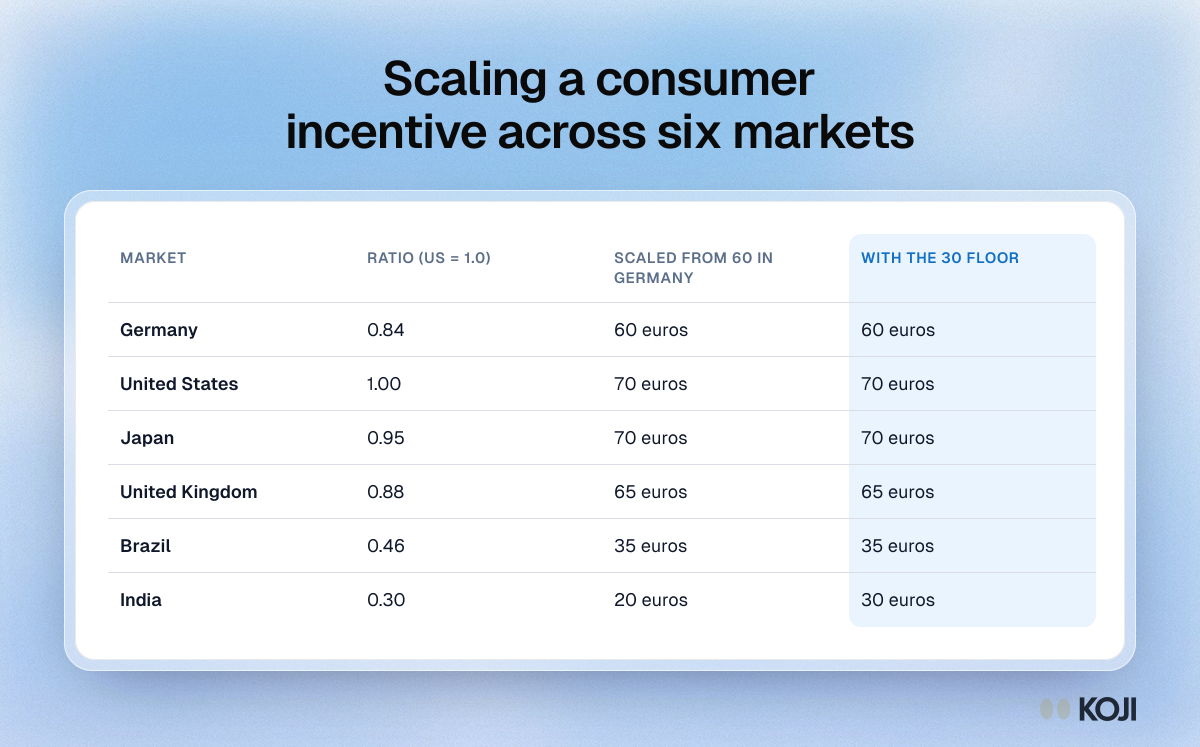
Table showing a worked example of scaling a 60 euro German consumer interview incentive to the US, Japan, UK, Brazil and India with a 30 euro floor

Reference table

Scaling a consumer incentive across six markets
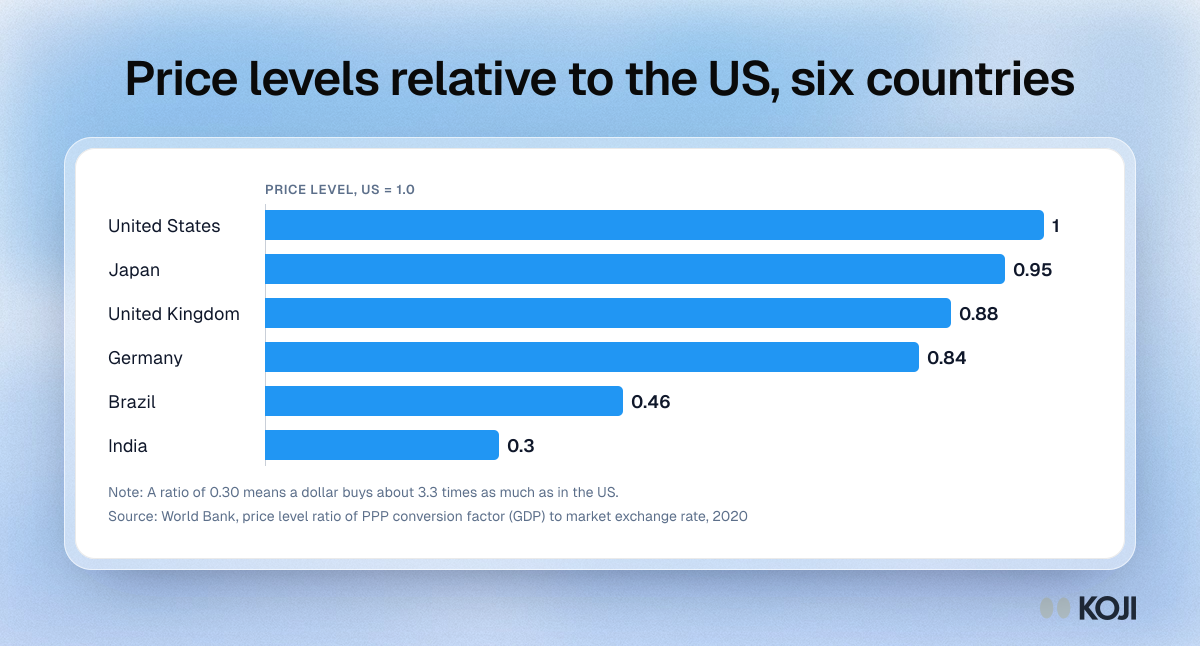
Bar chart of World Bank price level ratios relative to the United States in 2020: US 1.0, Japan 0.95, UK 0.88, Germany 0.84, Brazil 0.46, India 0.30

Bar chart

Price levels relative to the US, six countries
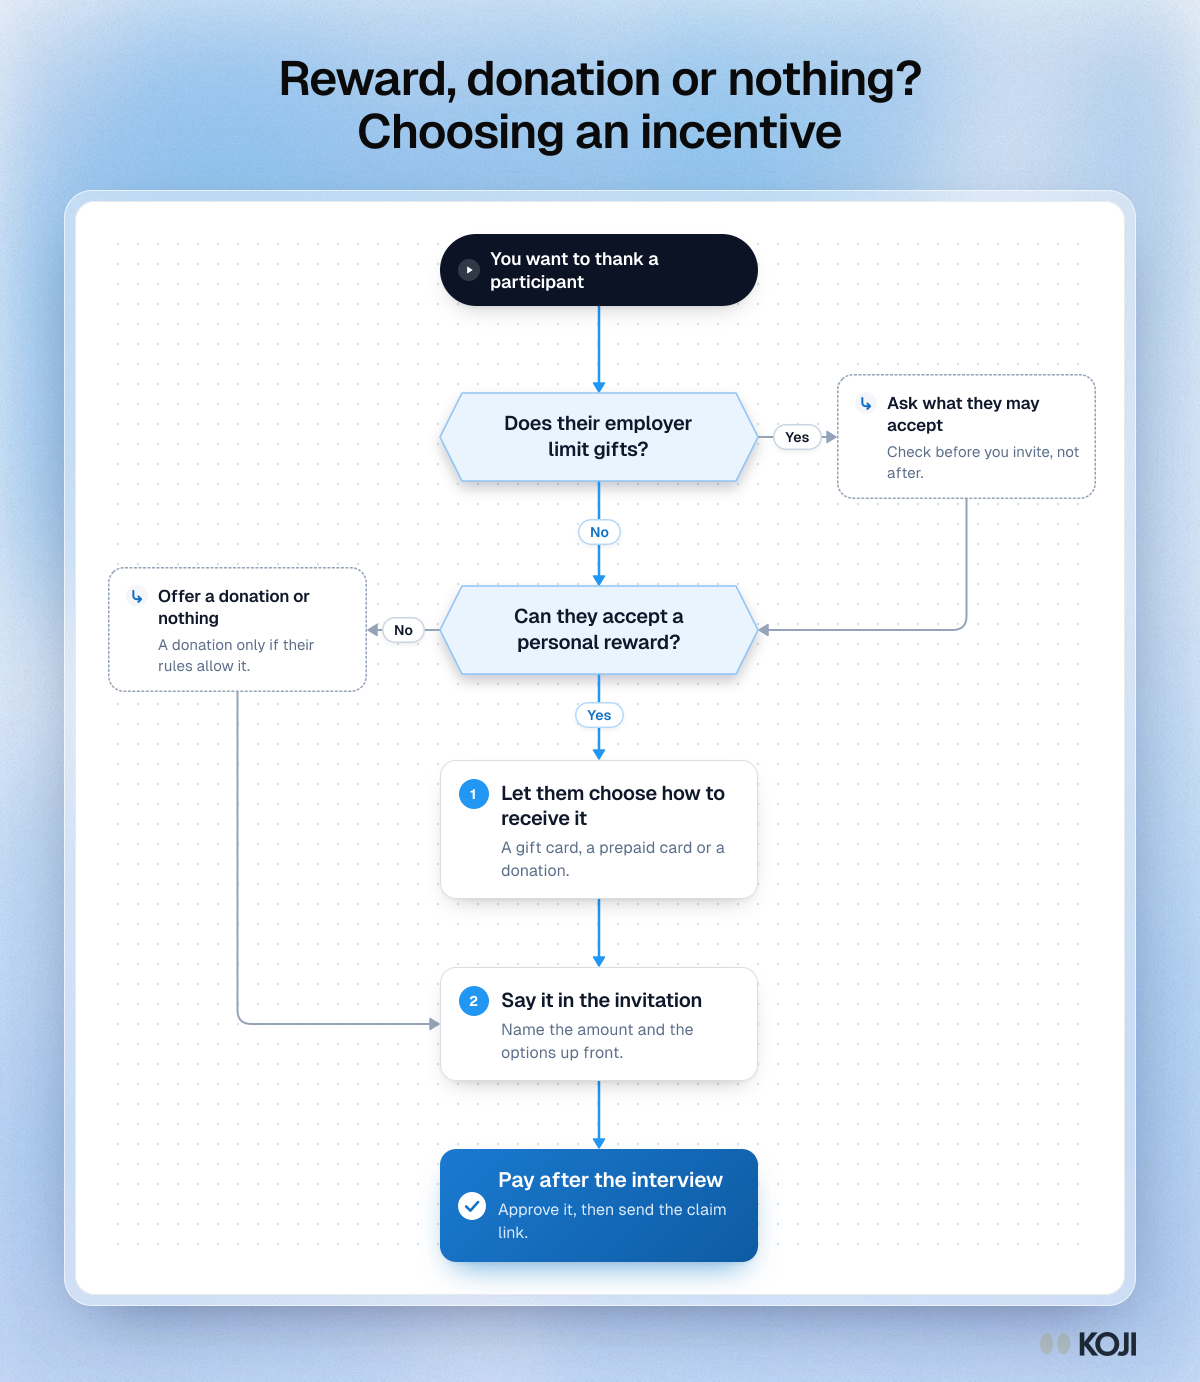
Flowchart for deciding whether to offer a research participant a reward, a donation or nothing, depending on their employer's rules

Flowchart

Reward, donation or nothing? Choosing an incentive
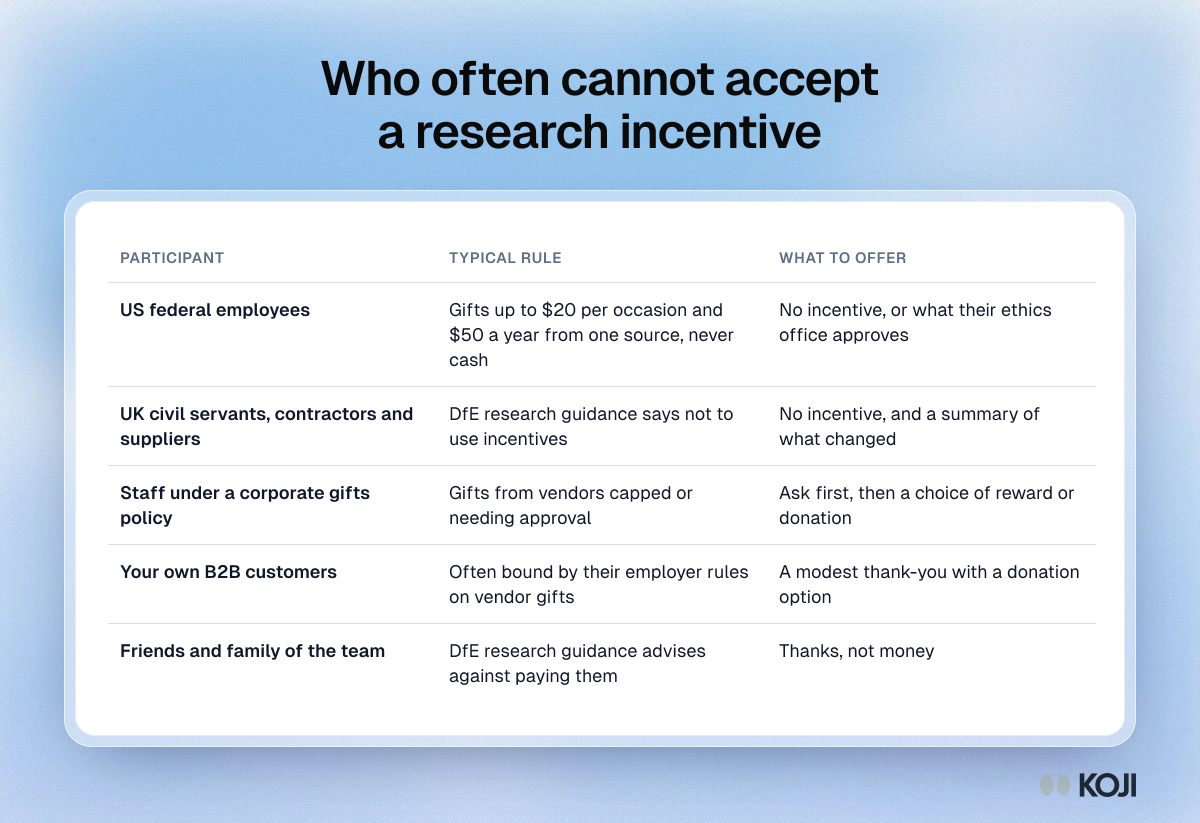
Table of participants who often cannot accept a personal research incentive, the typical rule that applies to them and what to offer instead

Reference table

Who often cannot accept a research incentive
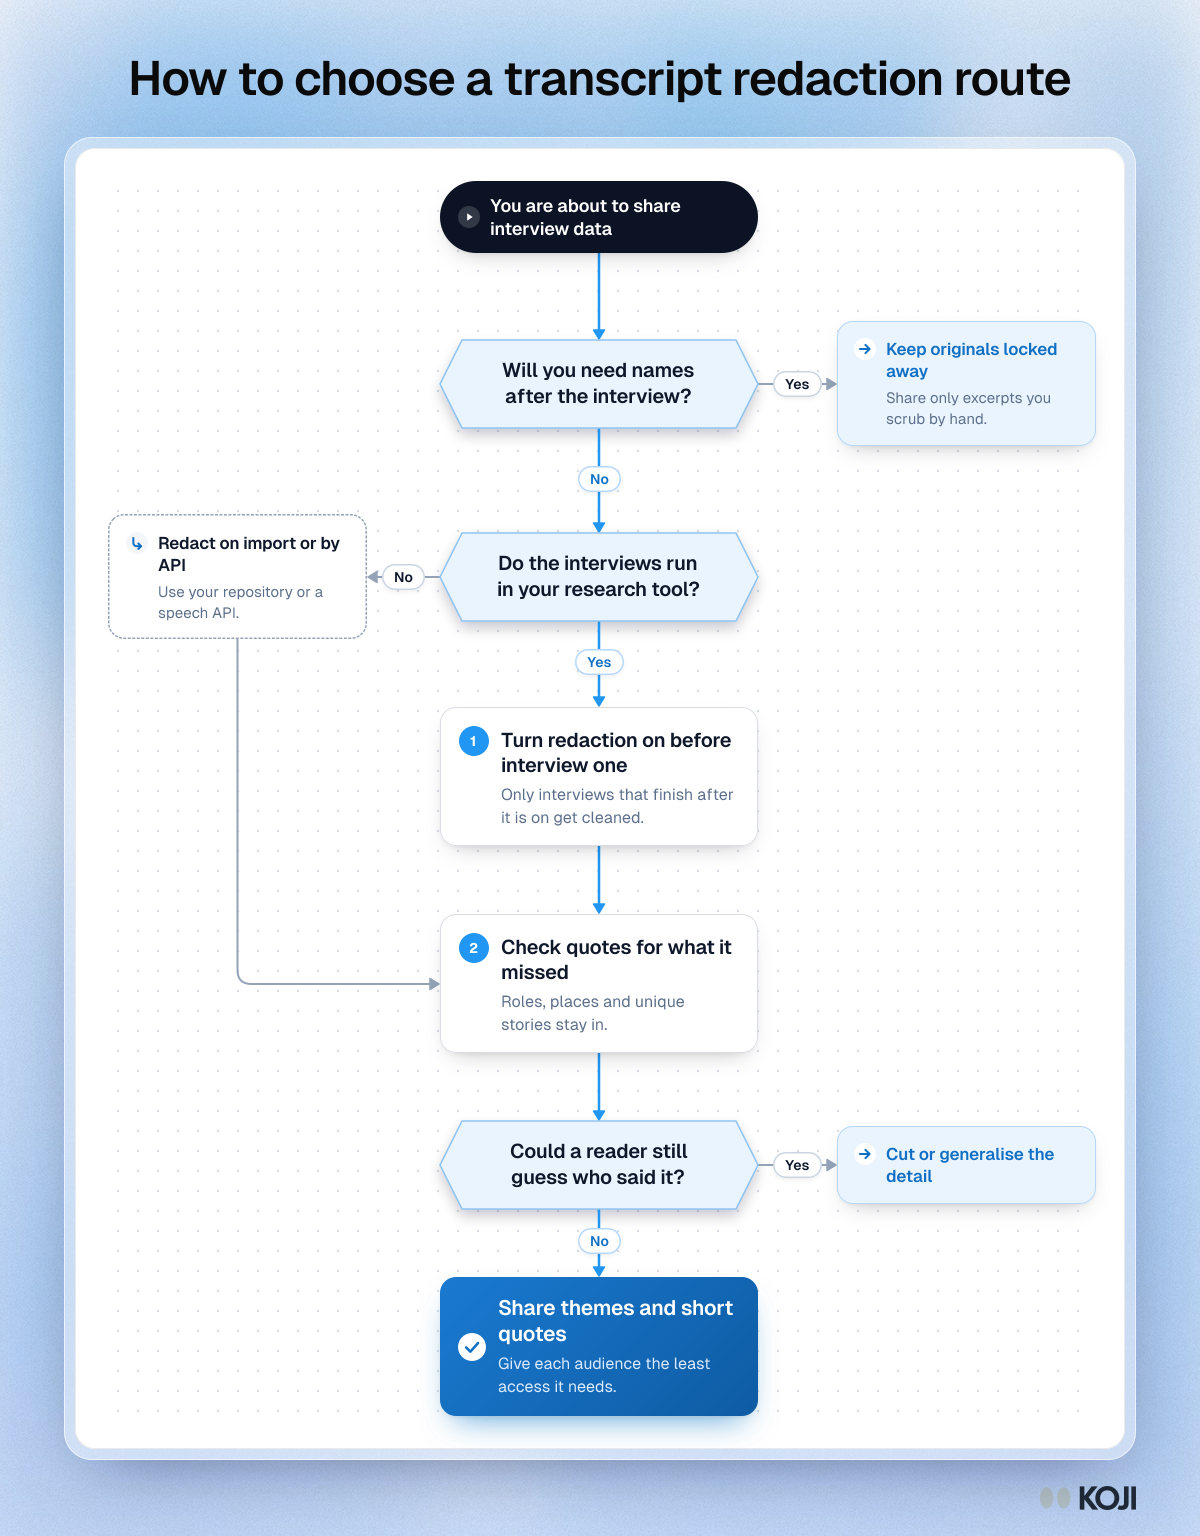
Flowchart for choosing a transcript redaction route, from whether you need names to checking quotes before you share themes

Flowchart

How to choose a transcript redaction route
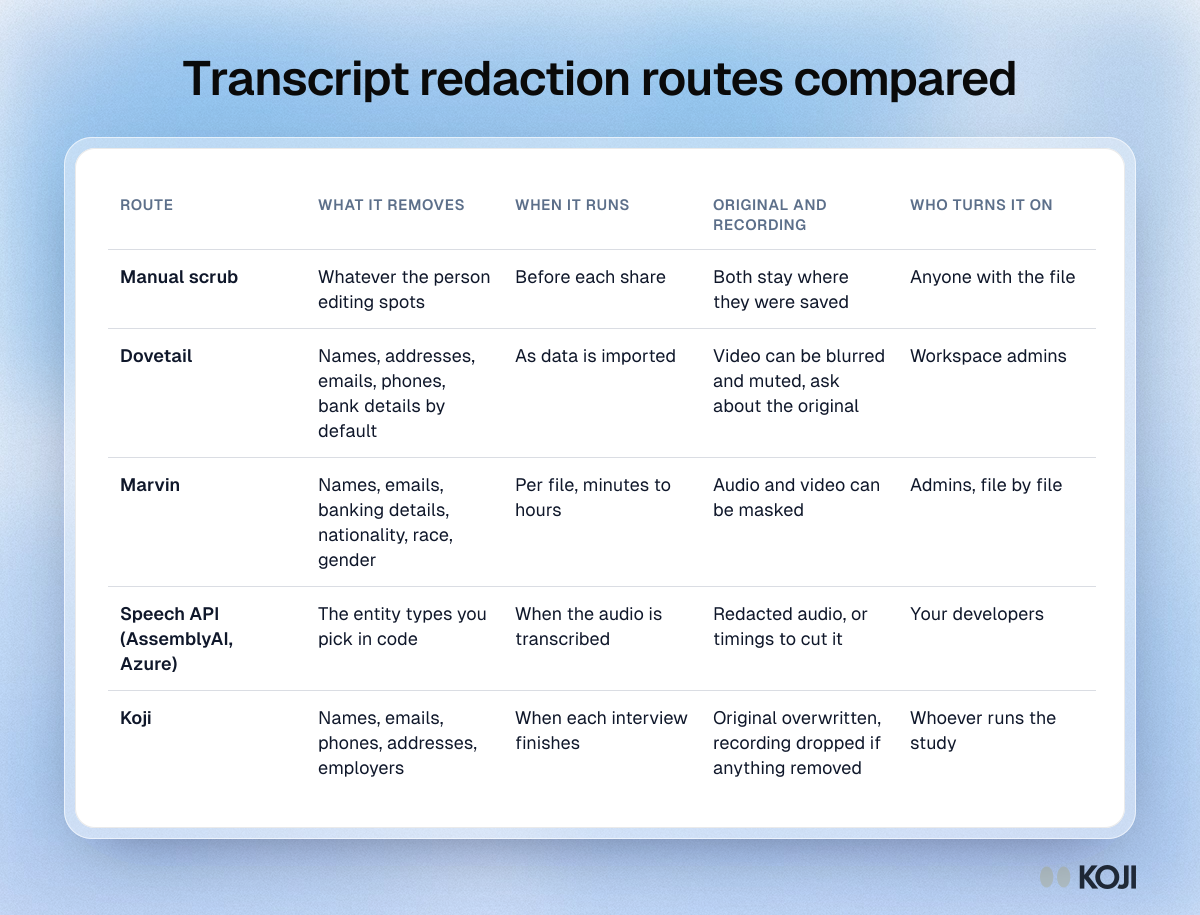
Table comparing manual scrubbing, Dovetail, Marvin, speech APIs and Koji by what each removes, when it runs and what happens to the original

Reference table

Transcript redaction routes compared
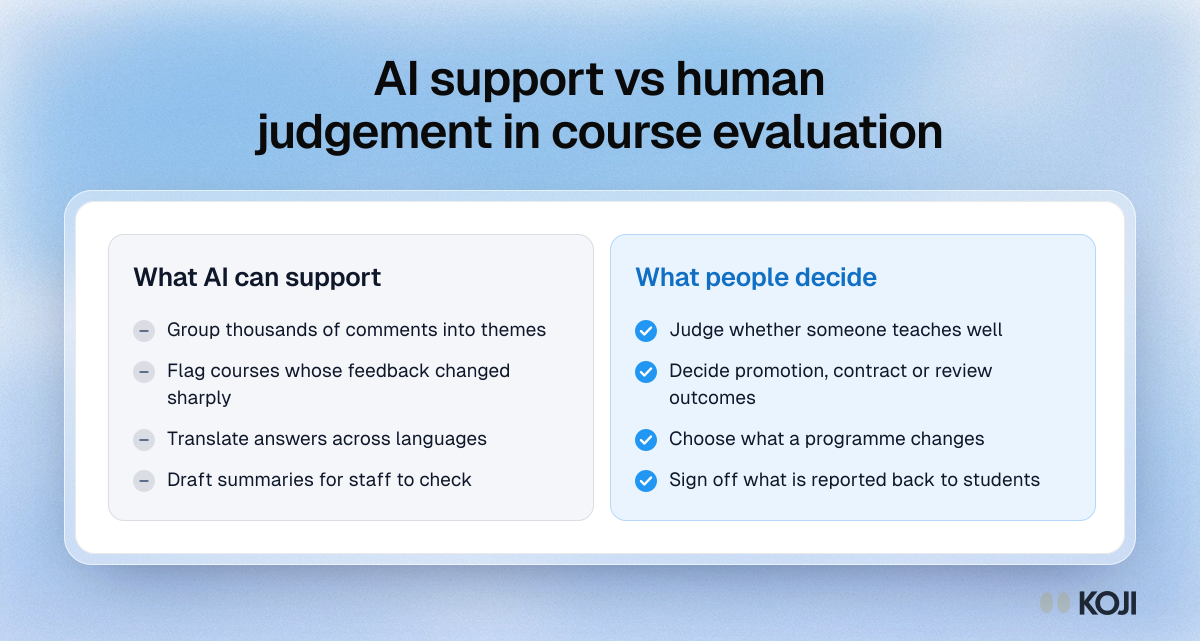
Comparison of what AI can support in course evaluation, such as grouping comments into themes, and what people should decide, such as judging teaching.

Comparison

AI support vs human judgement in course evaluation
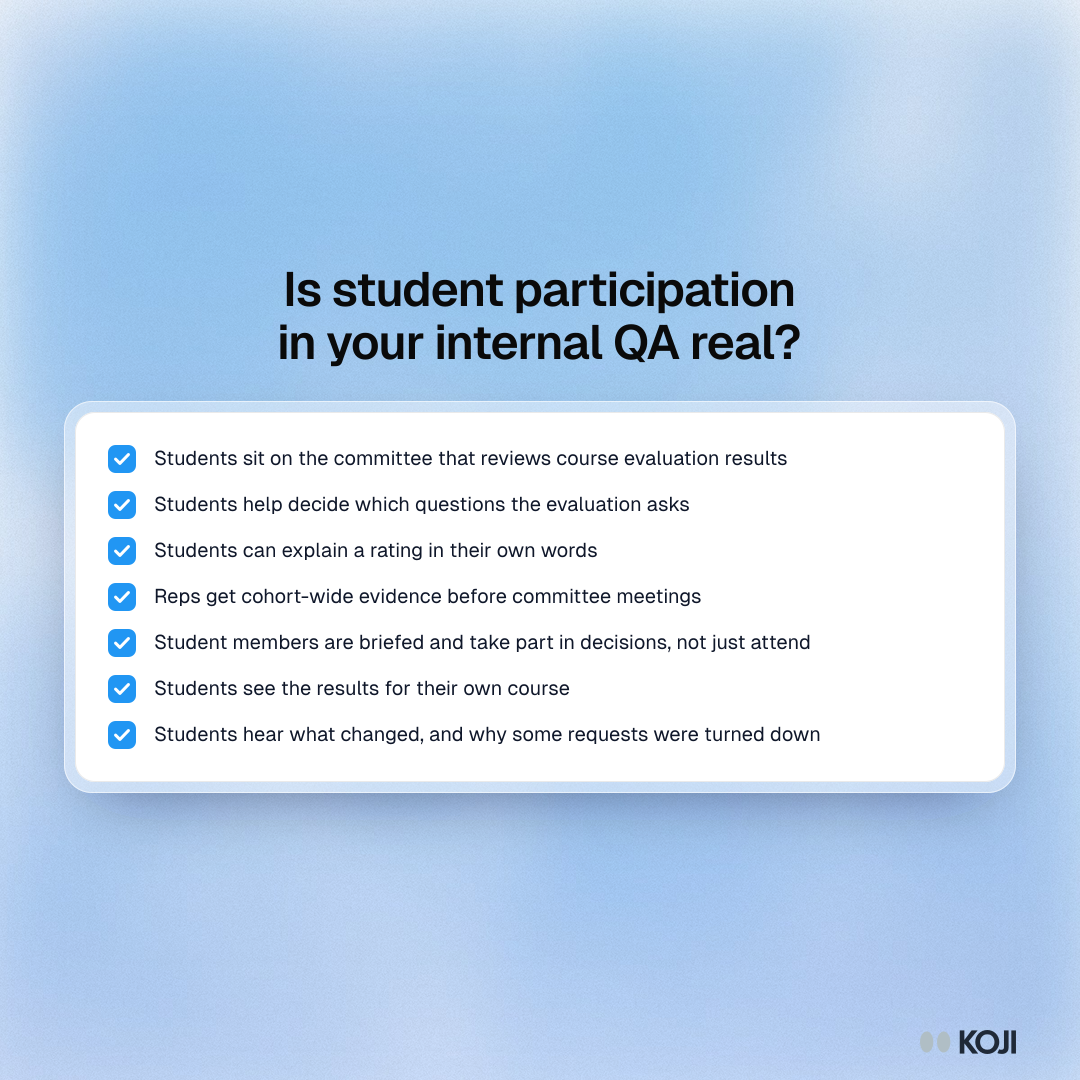
Checklist of seven signs that student participation in internal quality assurance is real, from students on the committee to students hearing what changed.

Checklist

Is student participation in your internal QA real?
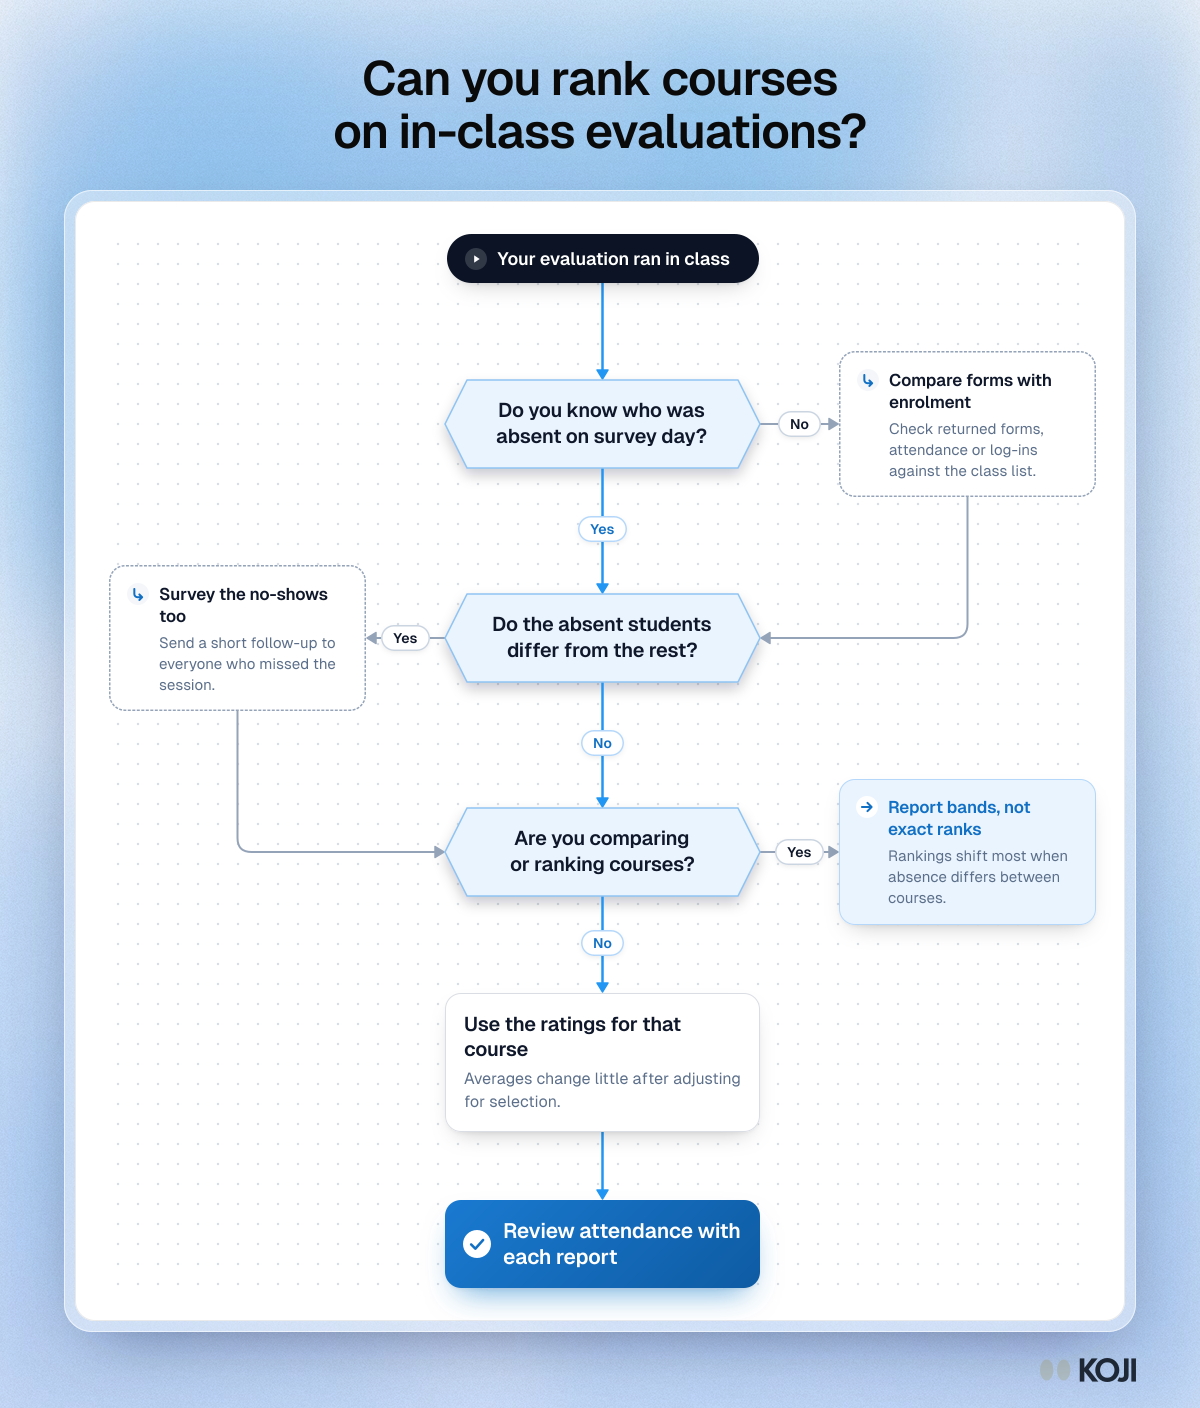
Flowchart for deciding whether in-class course evaluation data can rank courses: three questions, two side steps, one exit, ending in an attendance review.

Flowchart

Can you rank courses on in-class evaluations?
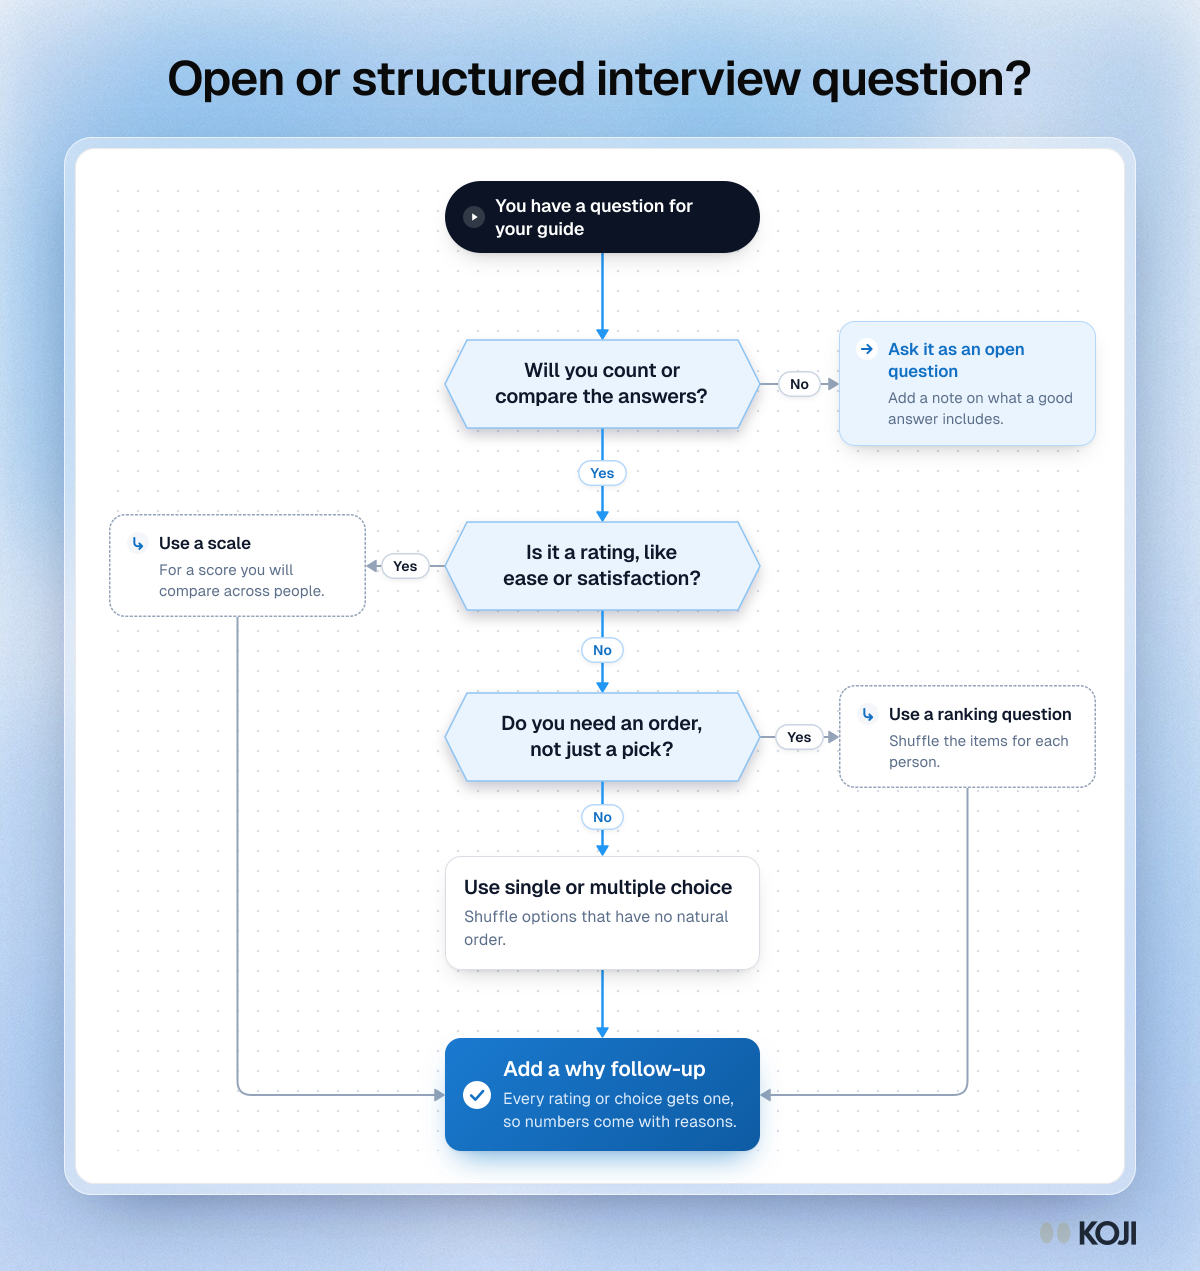
Flowchart for choosing between an open question and a structured question in an AI-moderated interview, with a why follow-up after every structured answer.

Flowchart

Open or structured interview question?
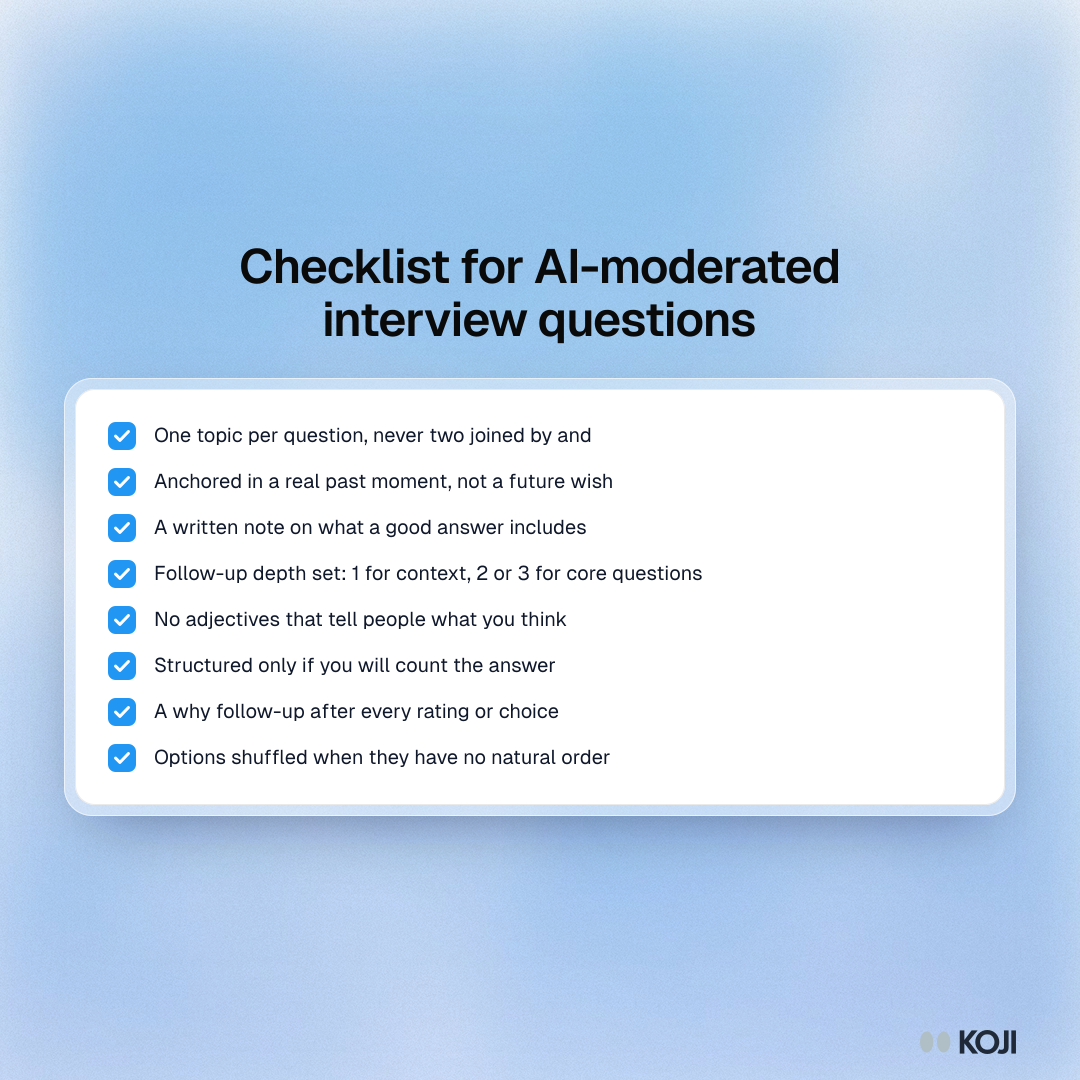
Checklist of eight checks for interview questions in an AI-moderated study, from one topic per question to a defined good answer and a why after every rating.

Checklist

Checklist for AI-moderated interview questions
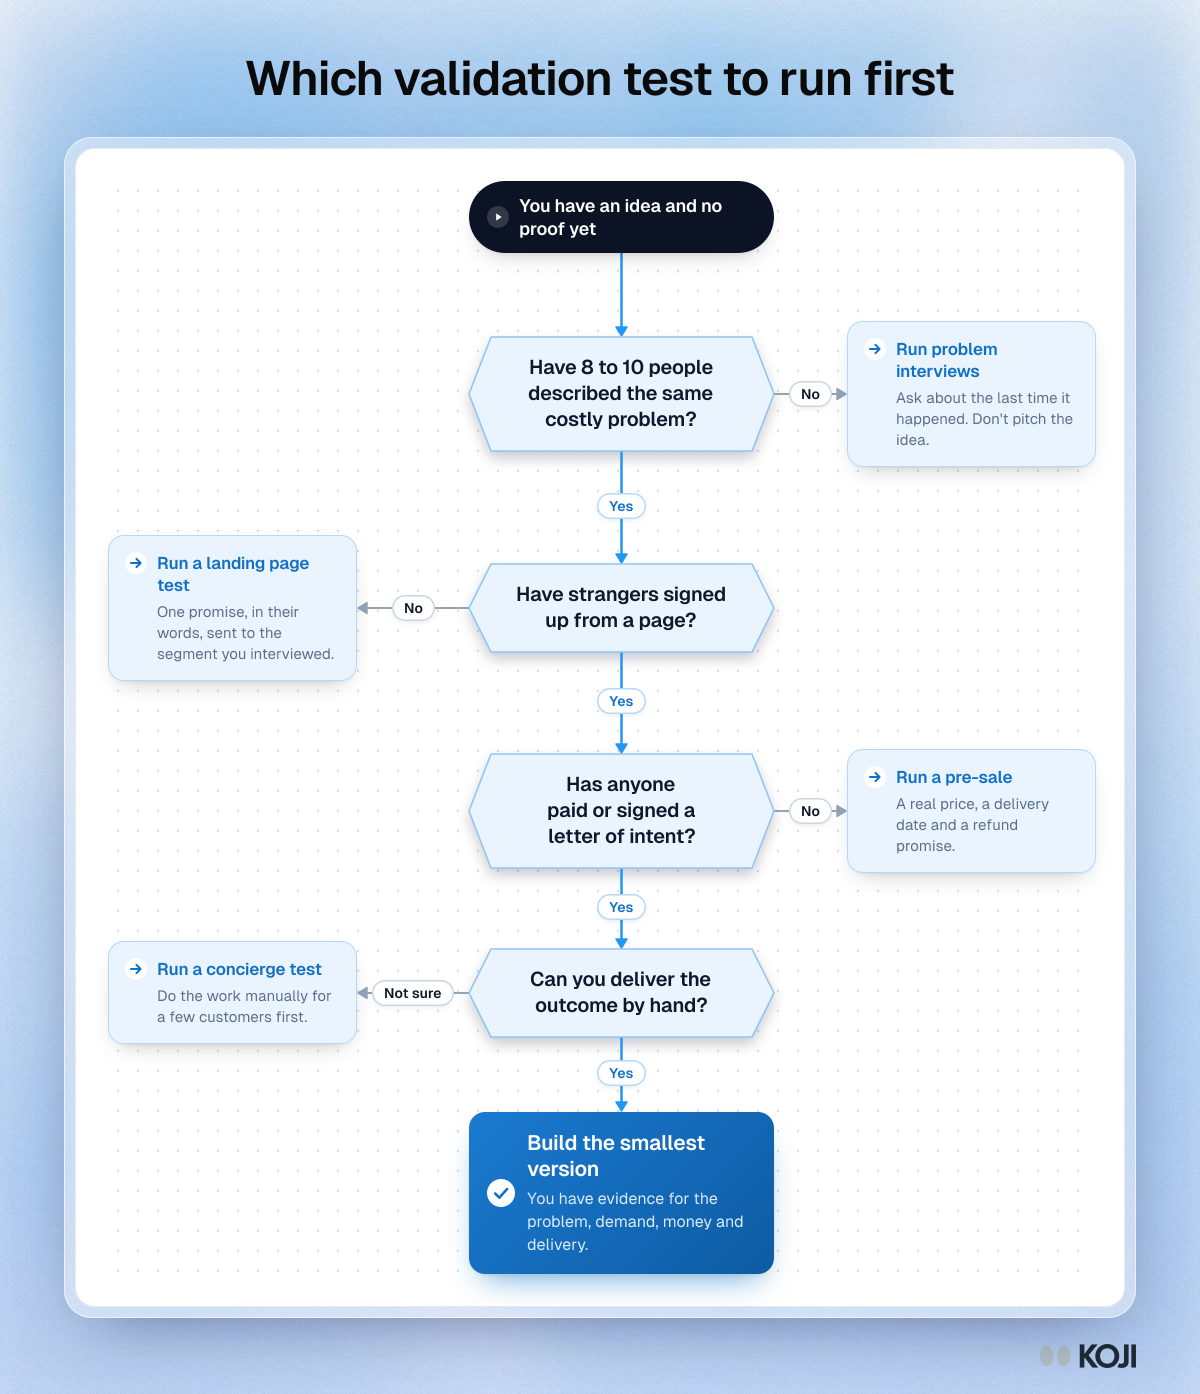
Flowchart for choosing the first validation test: interviews if the problem is unproven, then a landing page, then pre-sales, then a concierge test.

Flowchart

Which validation test to run first
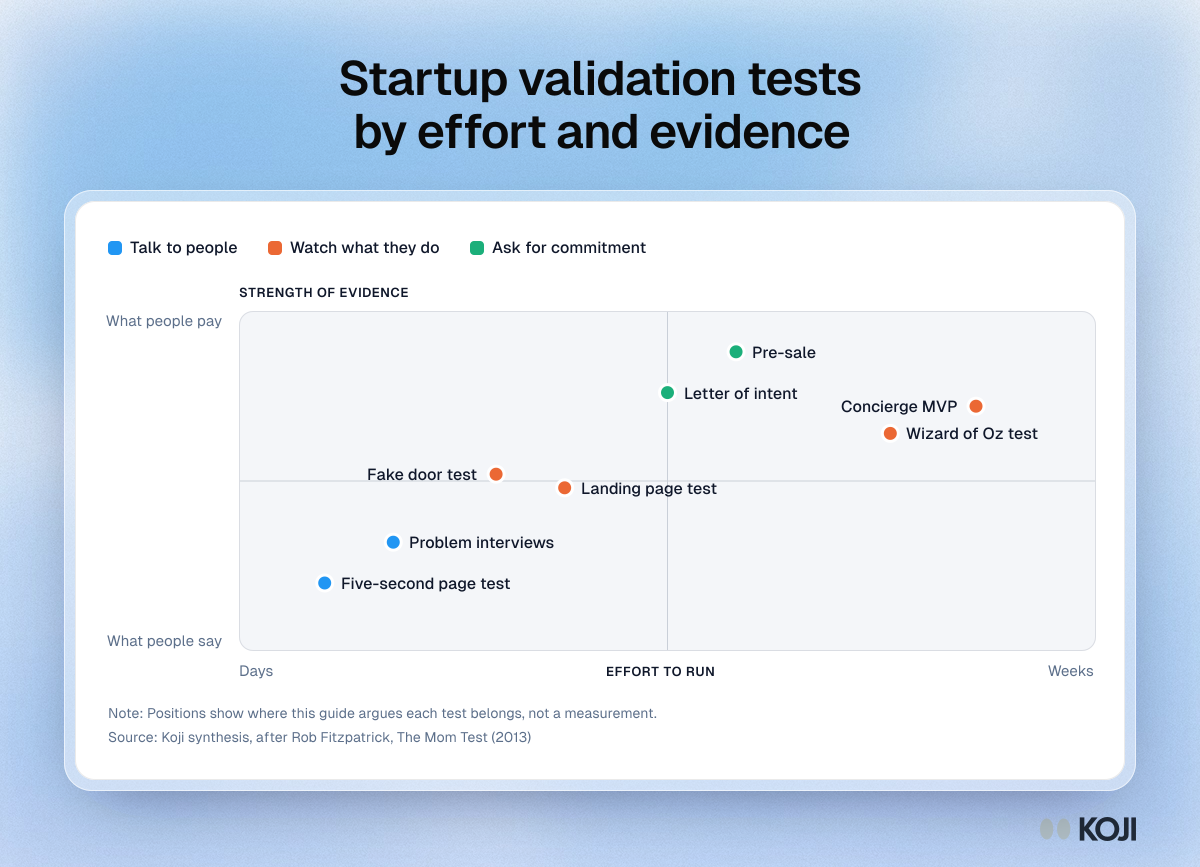
Method map placing eight validation tests by effort and strength of evidence, from problem interviews to pre-sales and letters of intent.

Scatter plot

Startup validation tests by effort and evidence
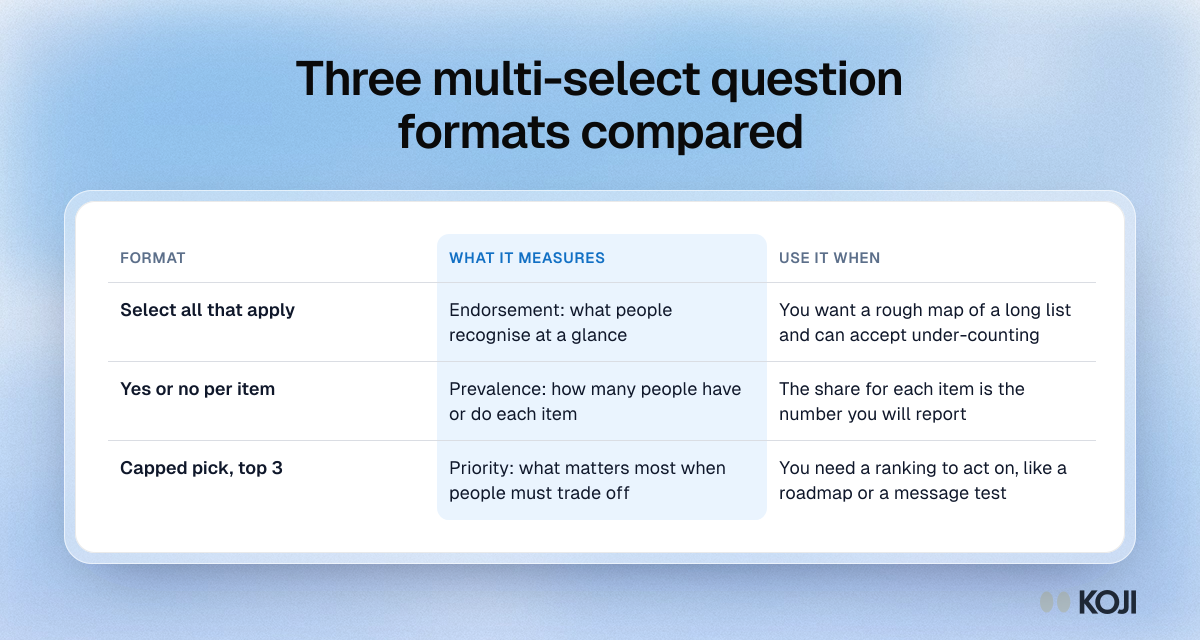
Table comparing three multi-select formats: select all measures endorsement, yes/no per item measures prevalence, a capped top 3 measures priority.

Reference table

Three multi-select question formats compared
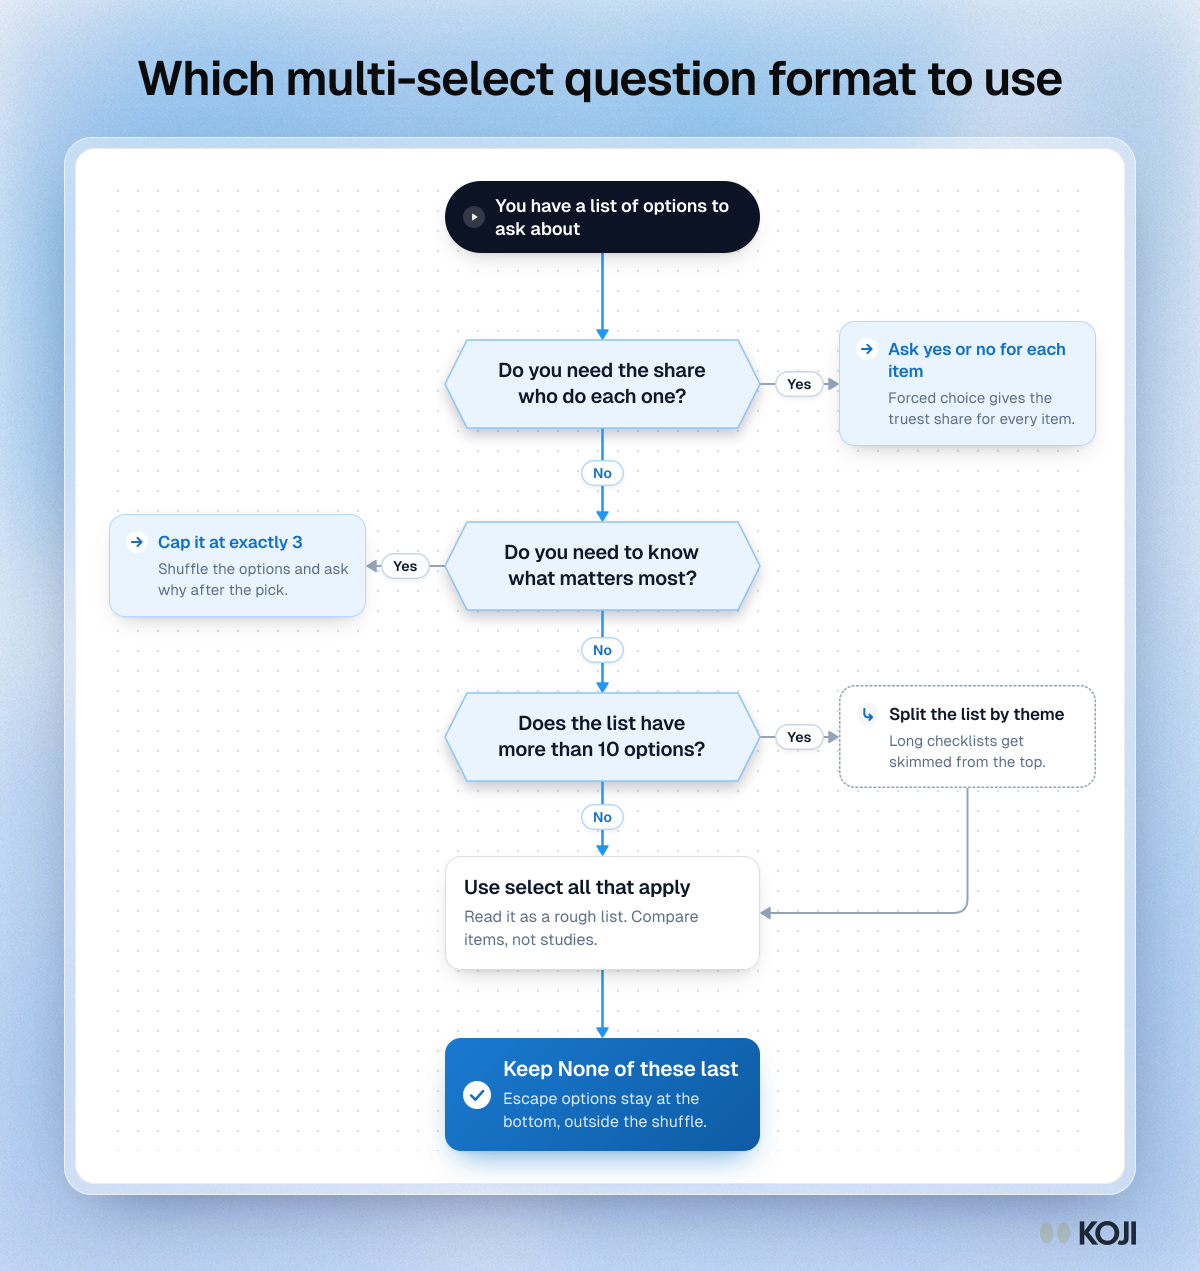
Flowchart for choosing a multi-select question format: forced yes/no for prevalence, a capped top 3 for priority, select-all for a rough list.

Flowchart

Which multi-select question format to use
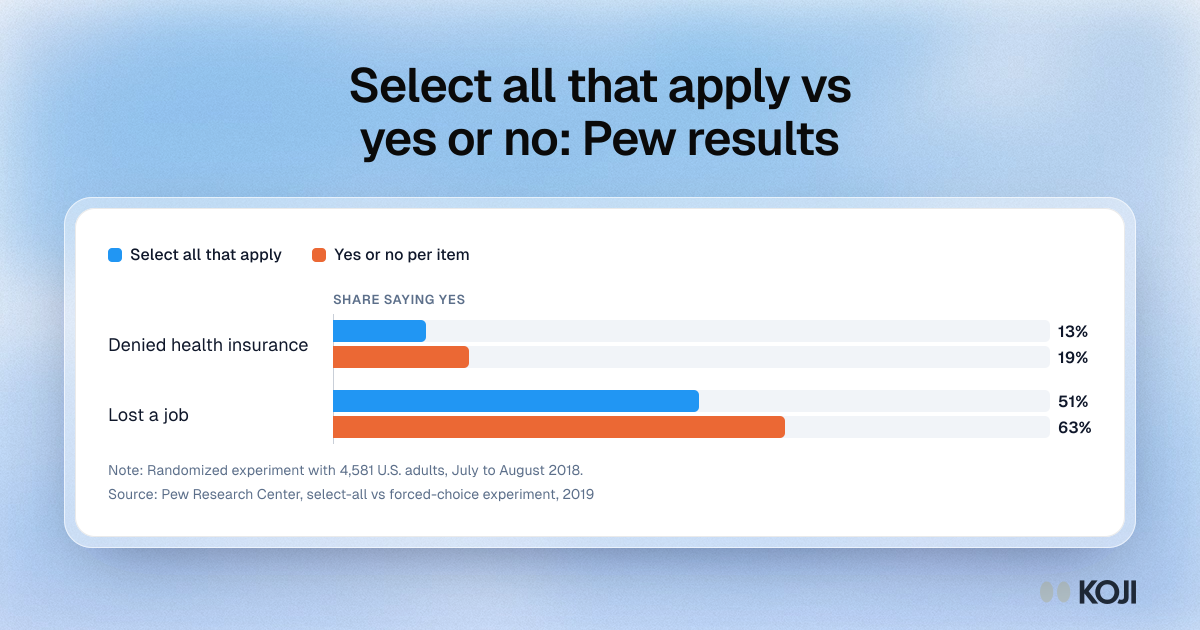
Bar chart from Pew Research Center comparing select-all and forced-choice answers: health insurance denial 13% vs 19%, job loss 51% vs 63%.

Bar chart

Select all that apply vs yes or no: Pew results
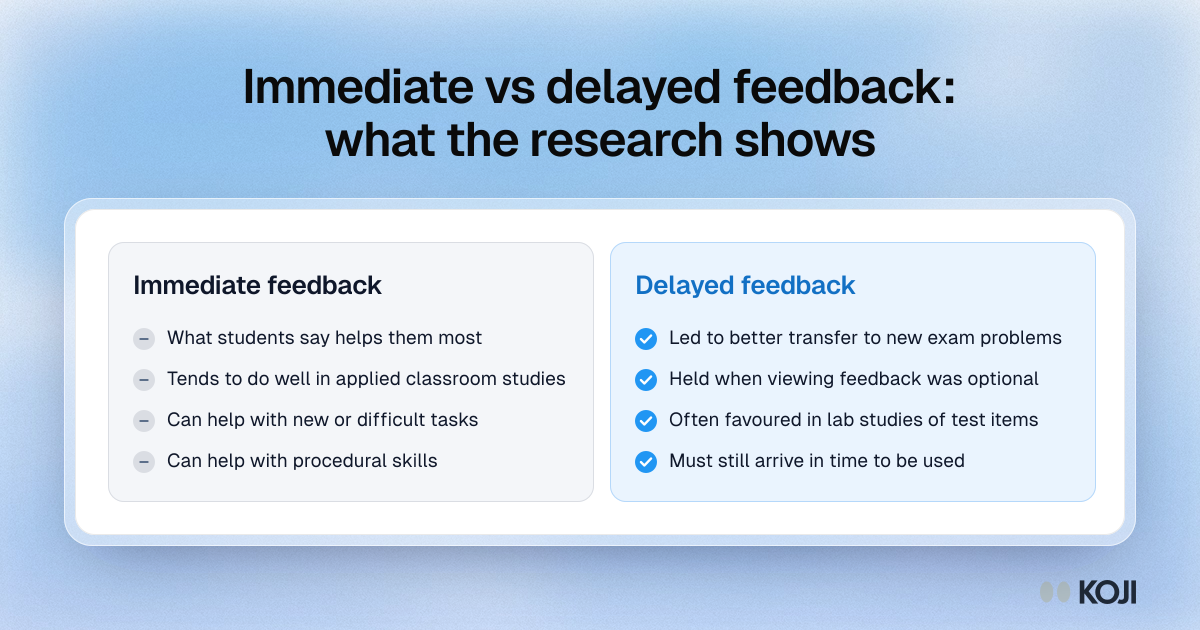
Comparison of immediate and delayed feedback: what students prefer and what research on transfer and classroom learning suggests about each.

Comparison

Immediate vs delayed feedback: what the research shows
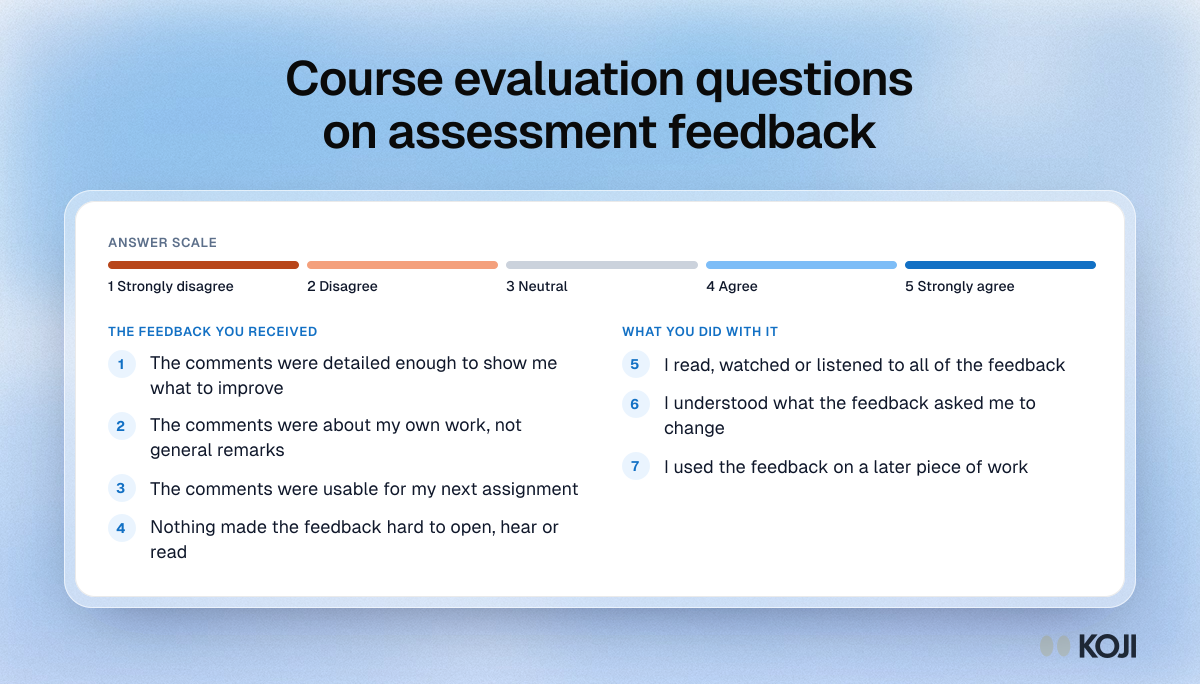
Question bank for course evaluations on assessment feedback: what students received and what they did with it, on a five-point agreement scale.

Question bank

Course evaluation questions on assessment feedback
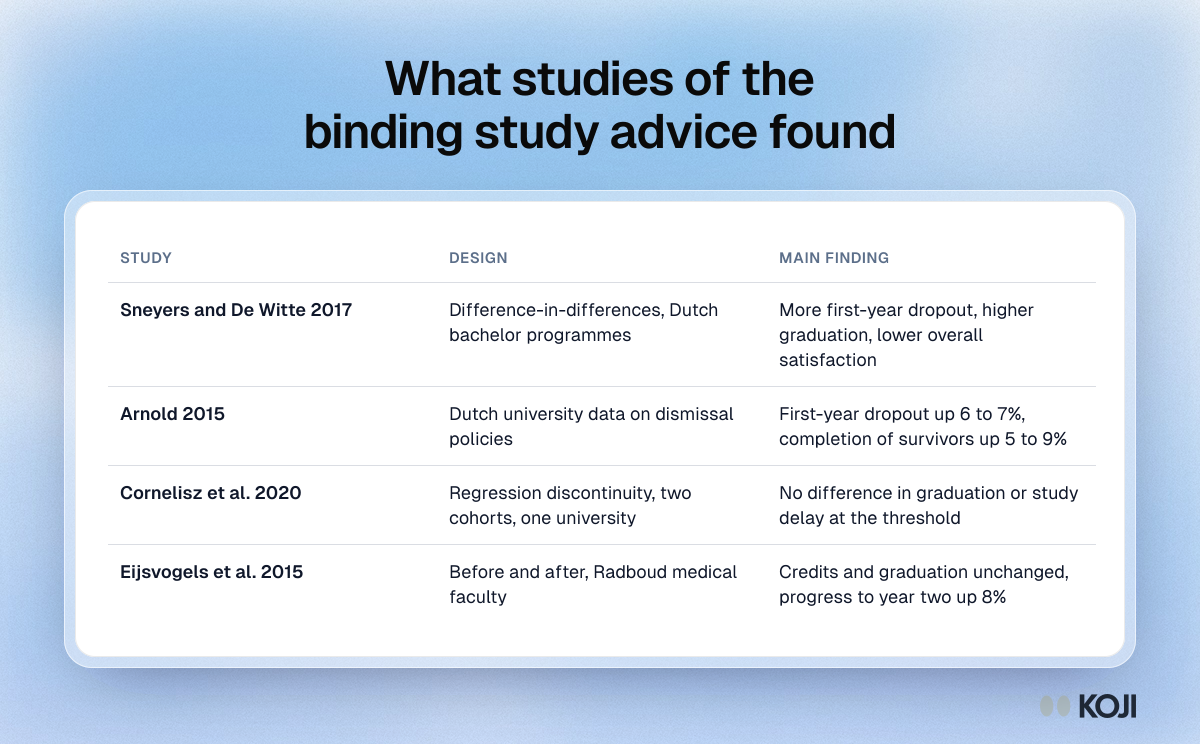
Table comparing four studies of binding study advice in the Netherlands, their designs and their main findings on dropout, graduation and satisfaction.

Reference table

What studies of the binding study advice found
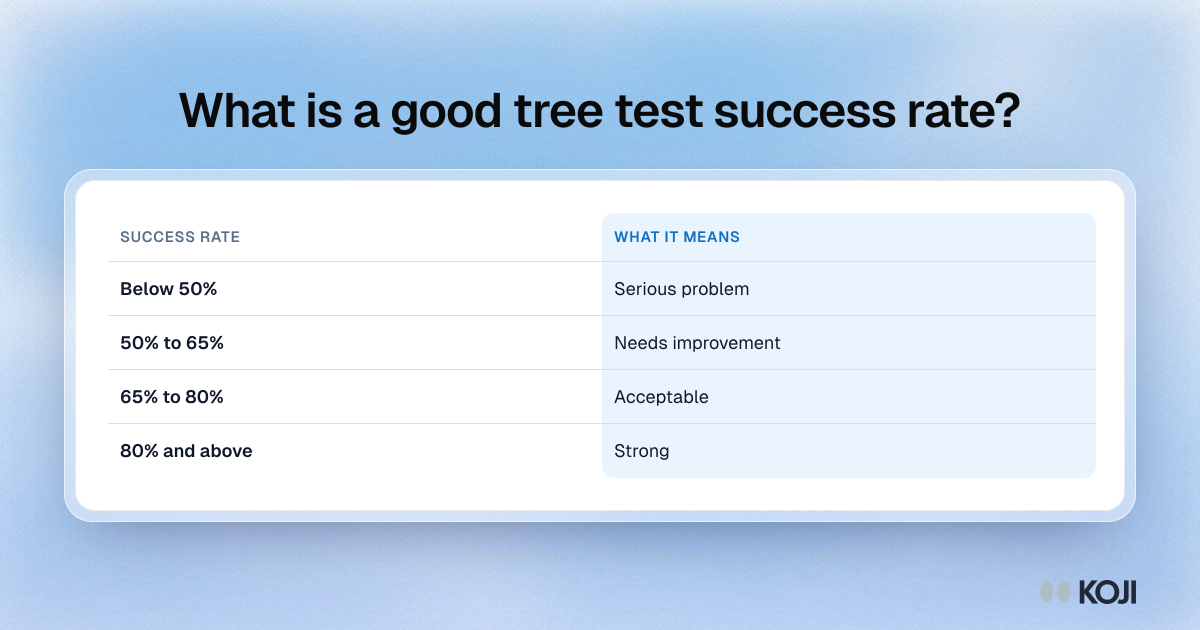
Table of tree test success rate benchmarks: below 50% is a serious problem, 50 to 65% needs work, 65 to 80% is acceptable and 80% or more is strong.

Reference table

What is a good tree test success rate?
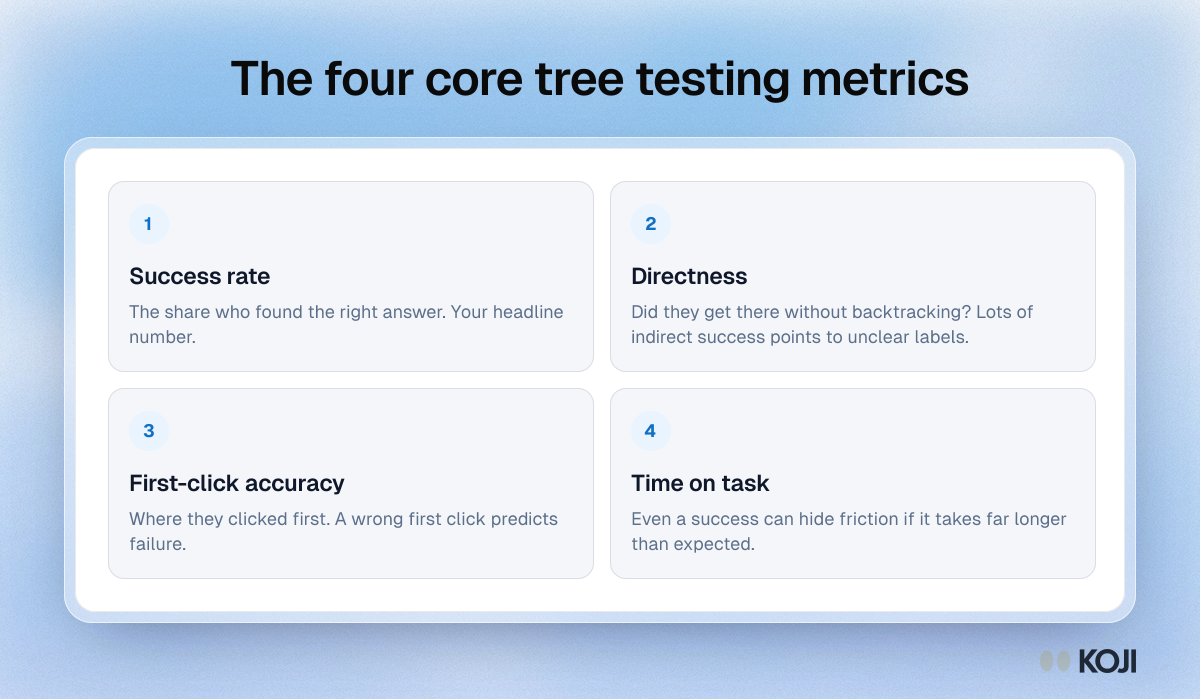
Framework of the four core tree testing metrics: success rate, directness, first-click accuracy and time on task.

Framework

The four core tree testing metrics
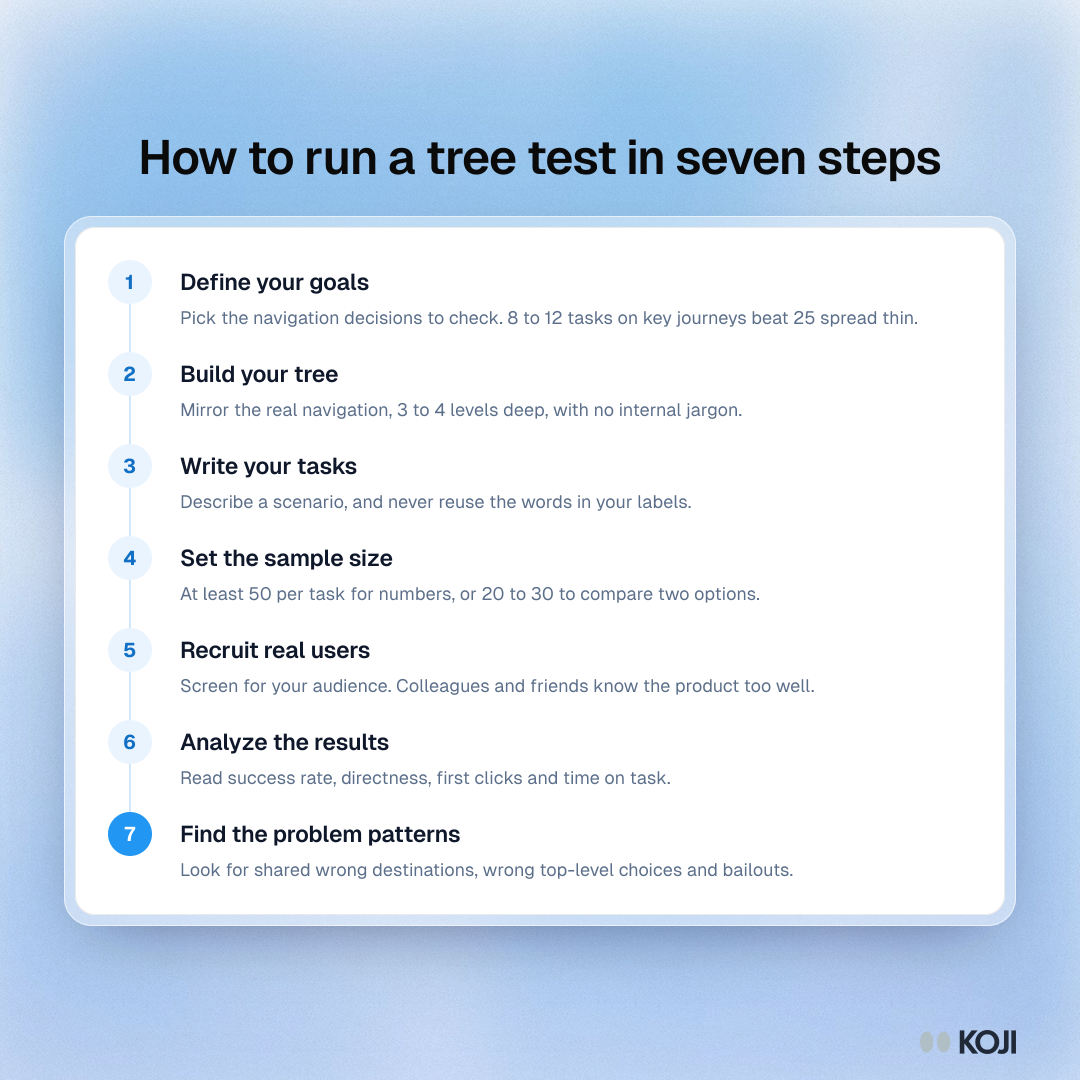
Process showing seven steps to run a tree test: define goals, build the tree, write tasks, set sample size, recruit, analyze results and find problem patterns.

Process

How to run a tree test in seven steps
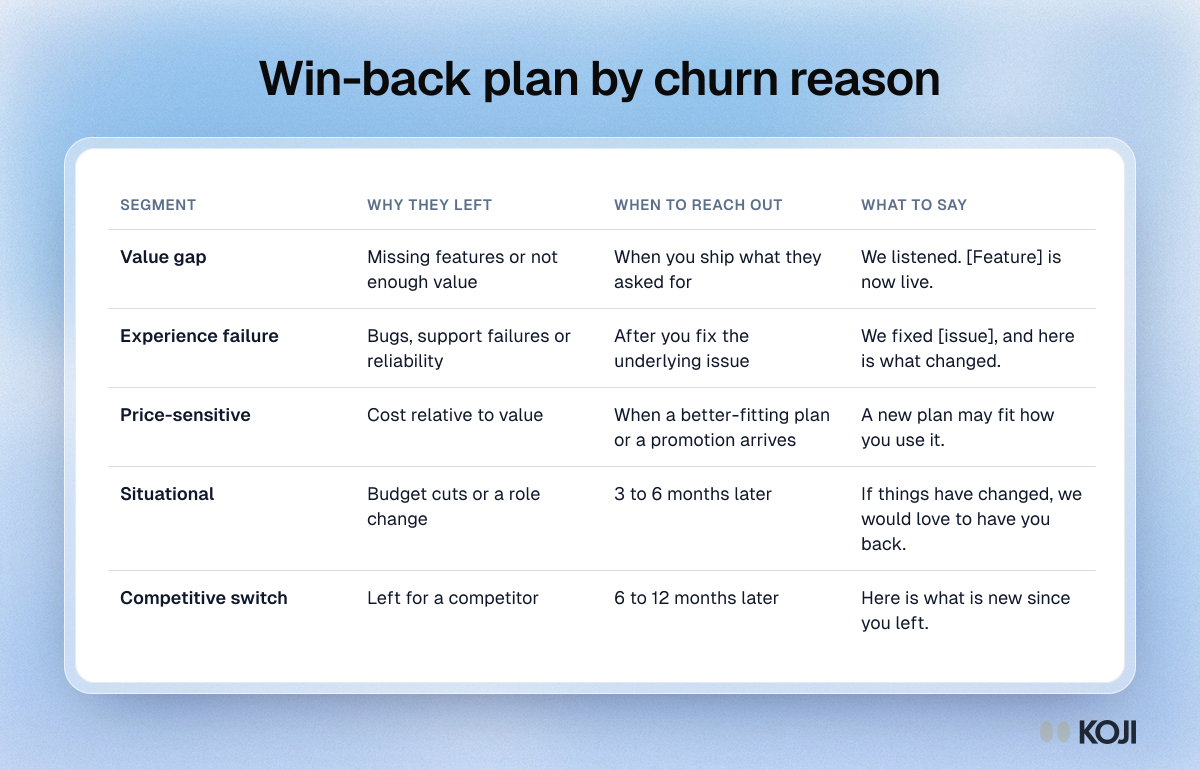
Table of a win-back plan for five churn segments, with why each left, when to reach out and what to say, from value gap to competitive switchers.

Reference table

Win-back plan by churn reason
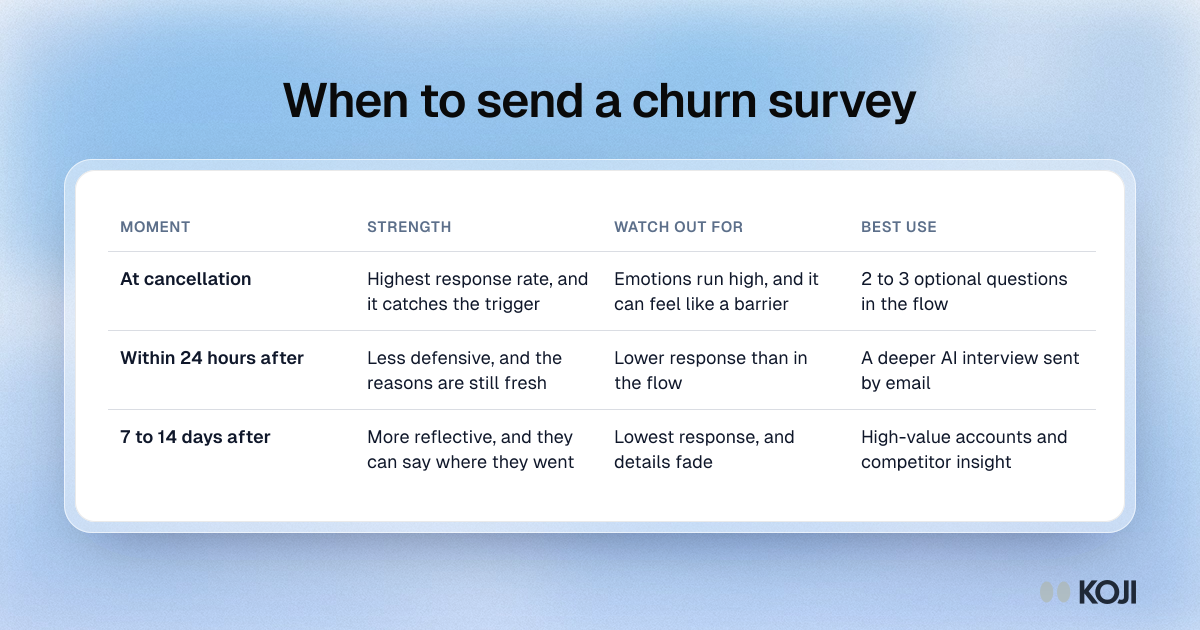
Table comparing three times to send a churn survey: at cancellation, within 24 hours and 7 to 14 days later, with the strength and trade-off of each.

Reference table

When to send a churn survey
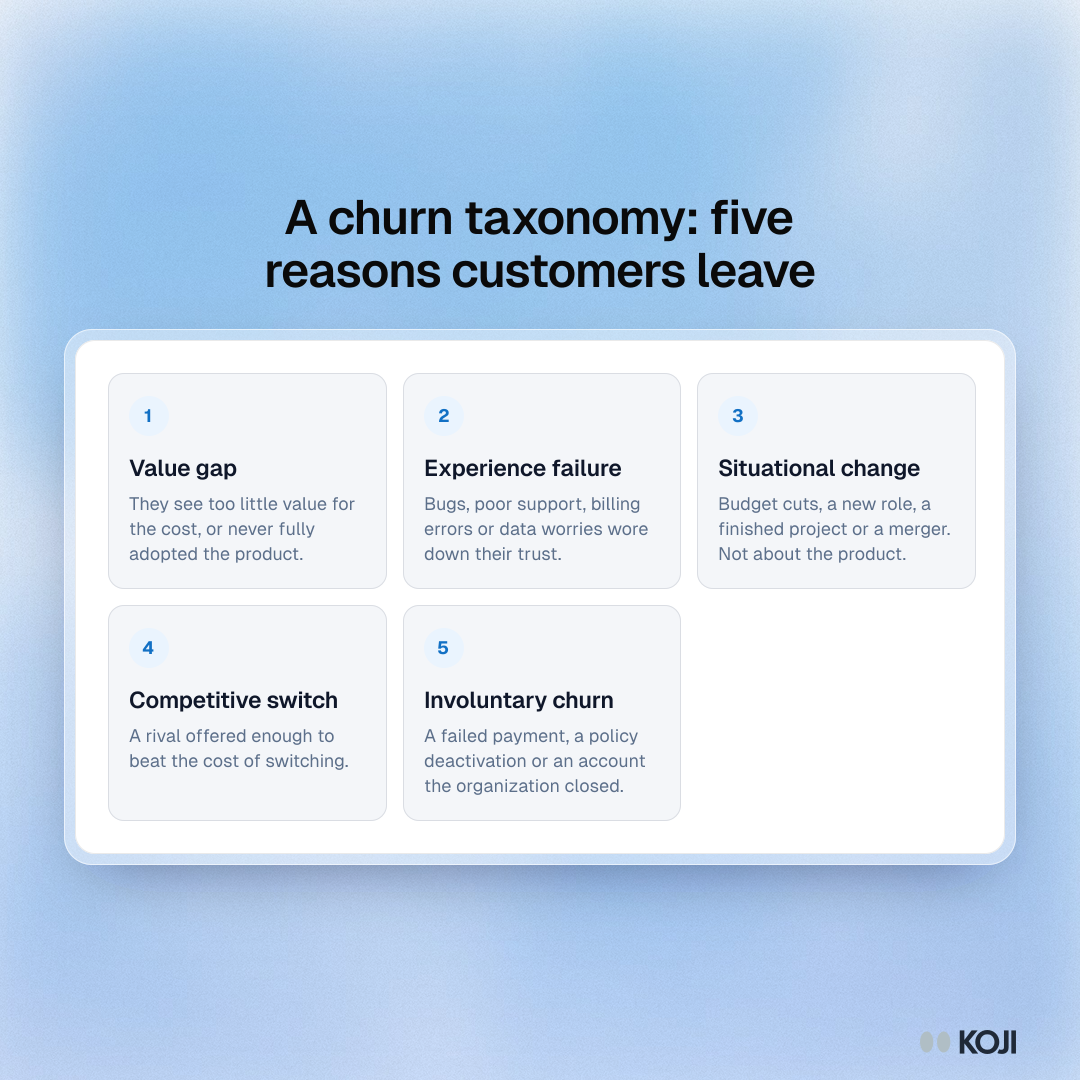
Framework of five churn categories: value gap, experience failure, situational change, competitive switch and involuntary churn such as failed payments.

Framework

A churn taxonomy: five reasons customers leave
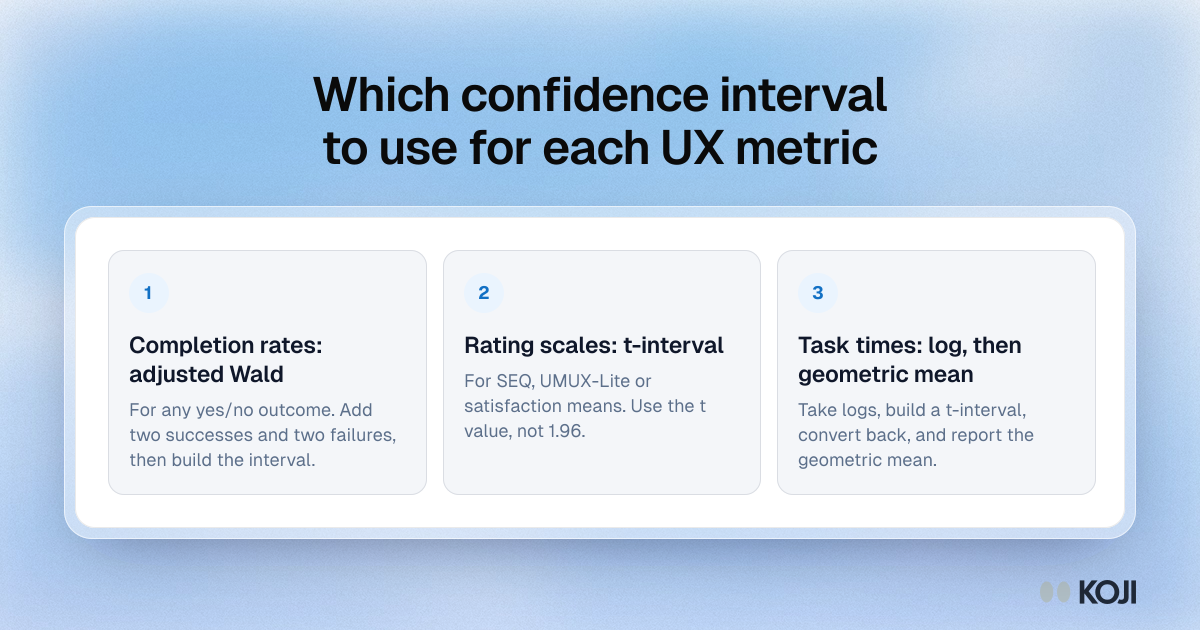
Framework matching UX metrics to interval methods: adjusted Wald for completion rates, t-intervals for ratings and log-based geometric means for task times.

Framework

Which confidence interval to use for each UX metric
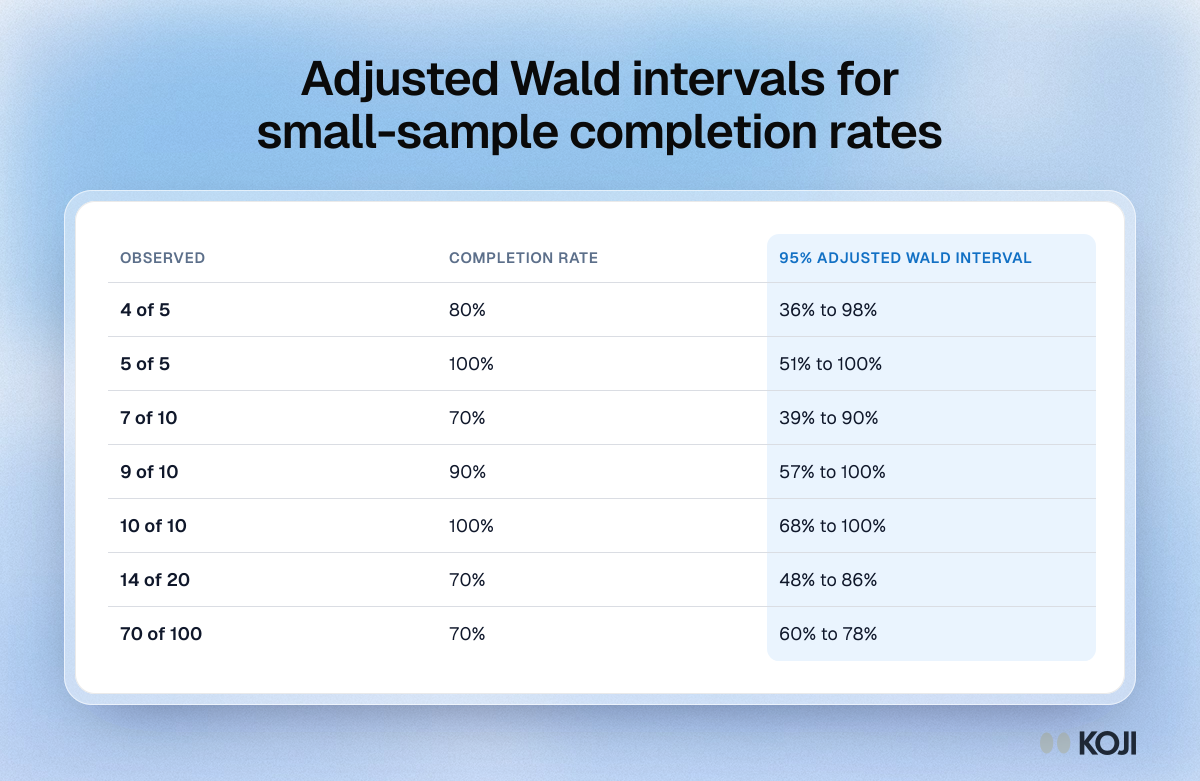
Table of 95% adjusted Wald confidence intervals for usability completion rates, showing that 5 of 5 successes fits a true rate as low as 51%.

Reference table

Adjusted Wald intervals for small-sample completion rates
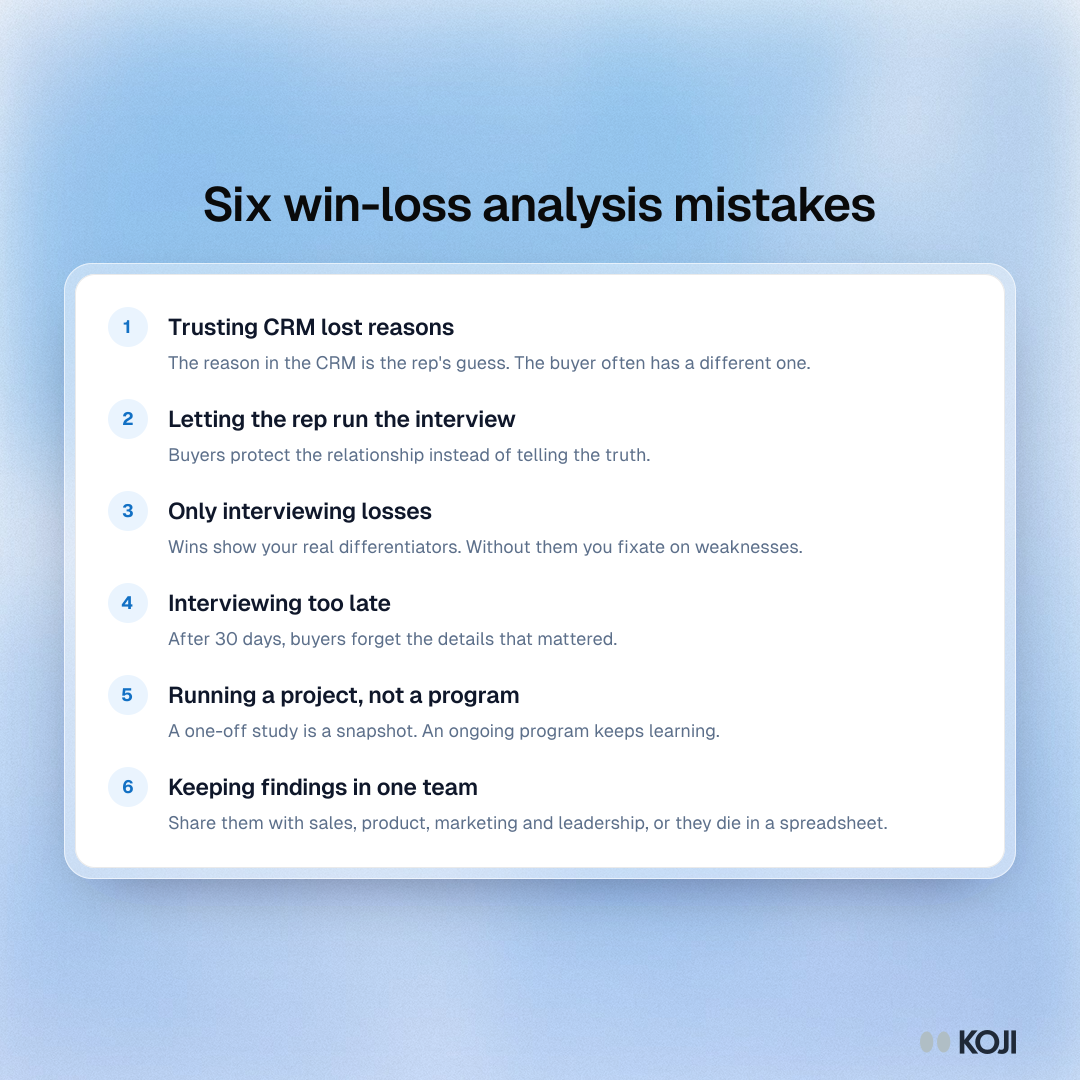
List of six win-loss analysis mistakes, from trusting CRM lost reasons and letting the sales rep interview to running a one-off project.

Guide

Six win-loss analysis mistakes

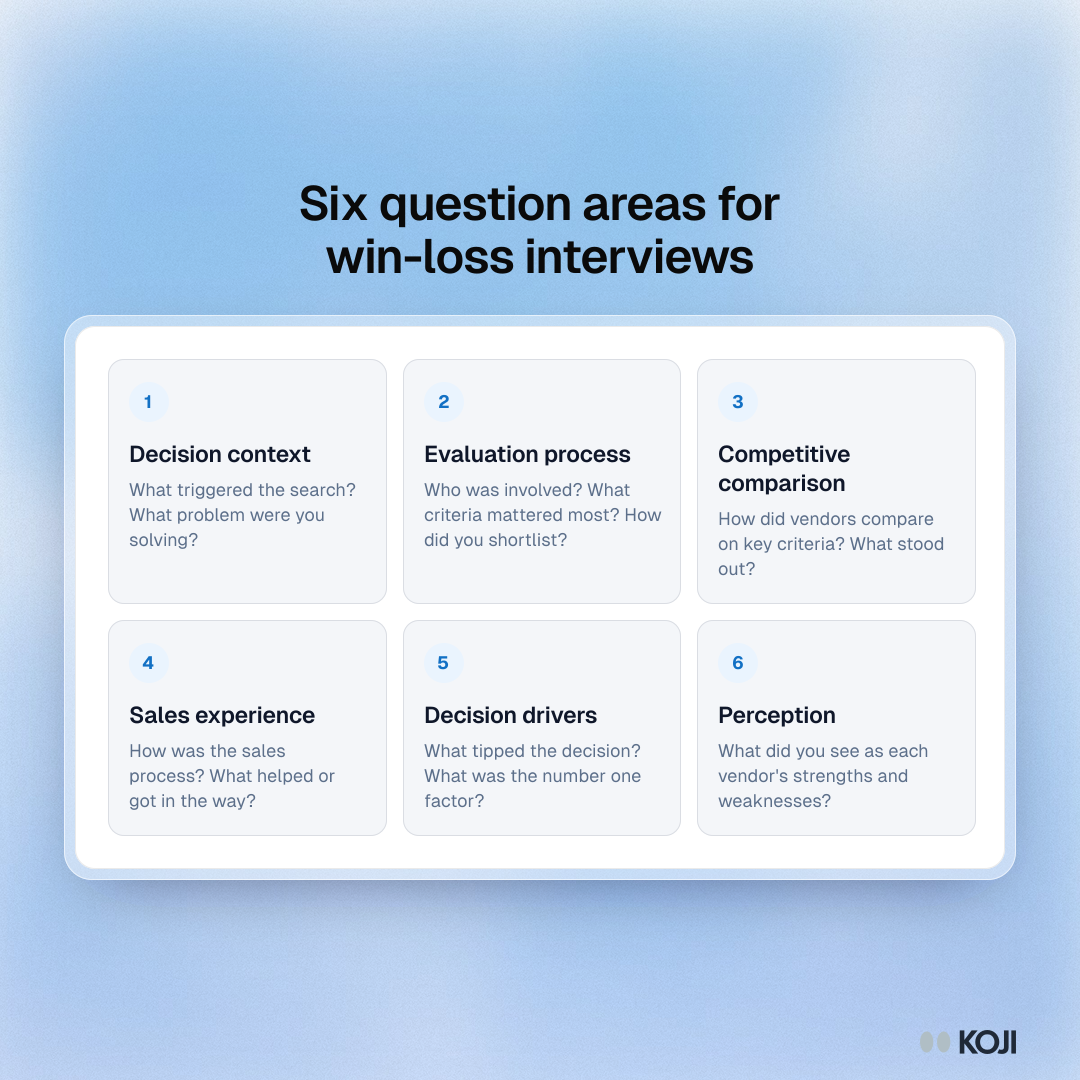
Framework of six win-loss interview question areas: decision context, evaluation, competitive comparison, sales experience, decision drivers and perception.

Framework

Six question areas for win-loss interviews
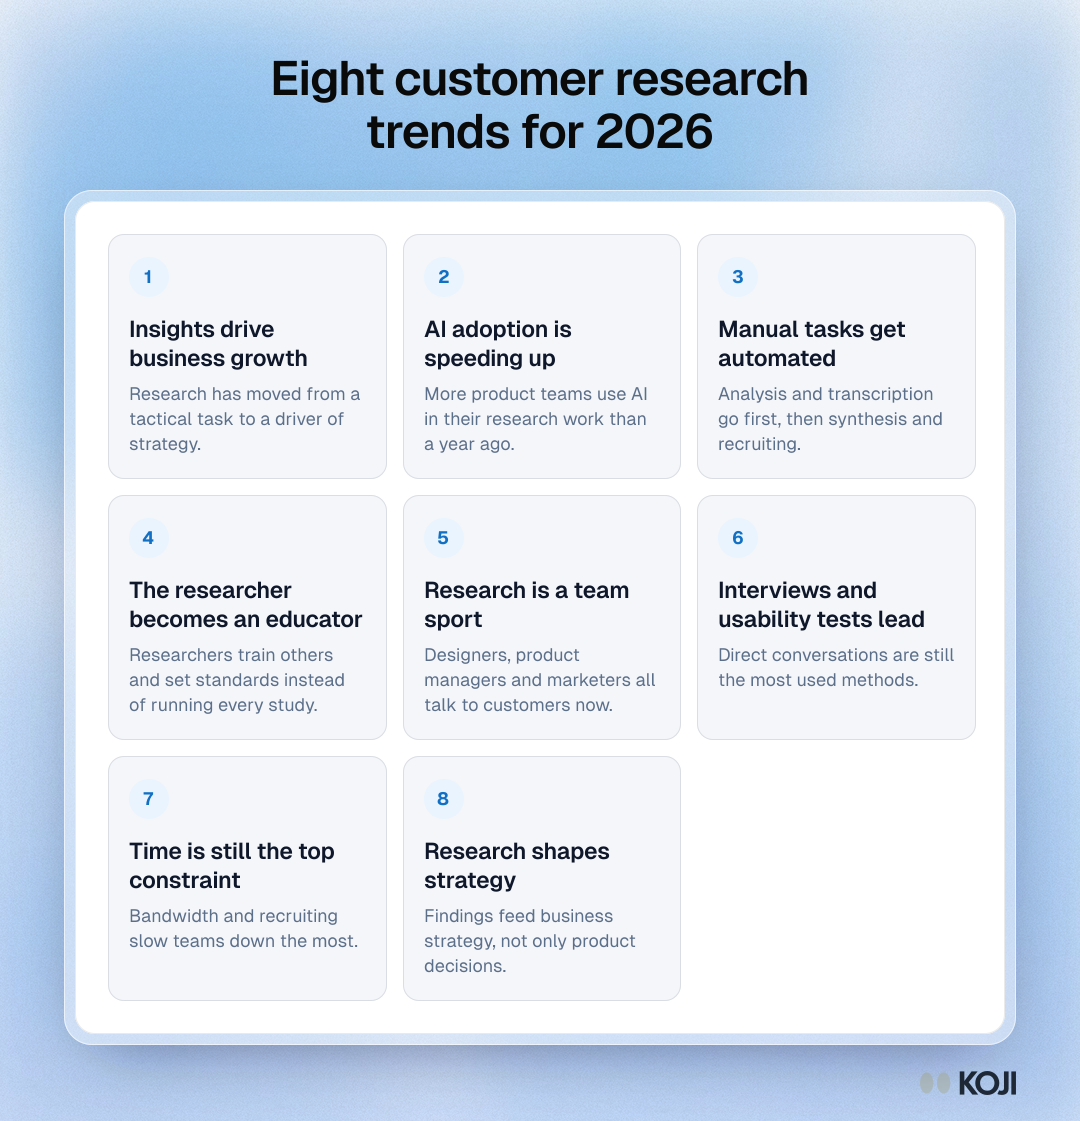
Framework of eight customer research trends for 2026, from faster AI adoption and automated analysis to research as a team sport and a driver of strategy.

Framework

Eight customer research trends for 2026
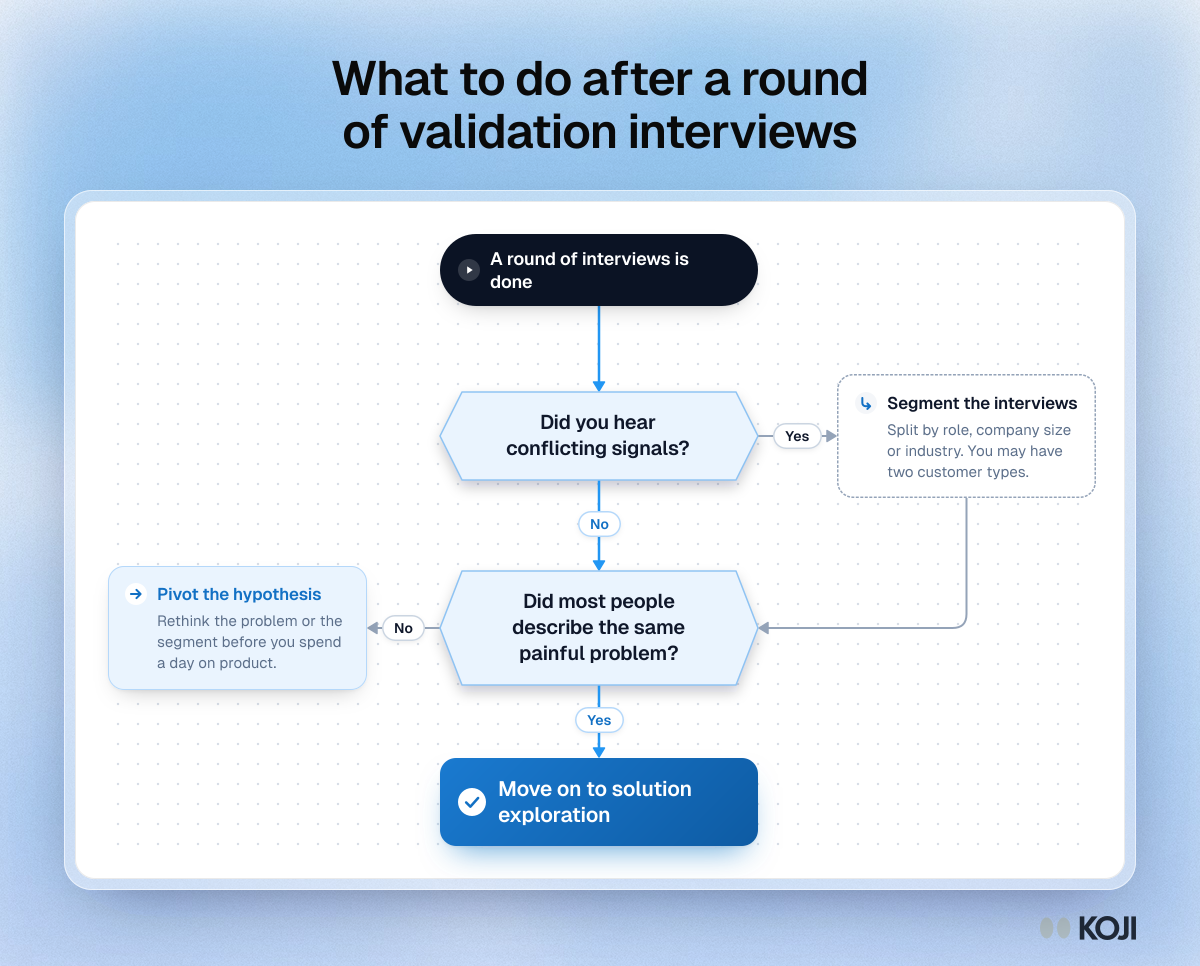
Flowchart for after validation interviews: segment if signals conflict, pivot if most did not share a painful problem, otherwise explore solutions.

Flowchart

What to do after a round of validation interviews
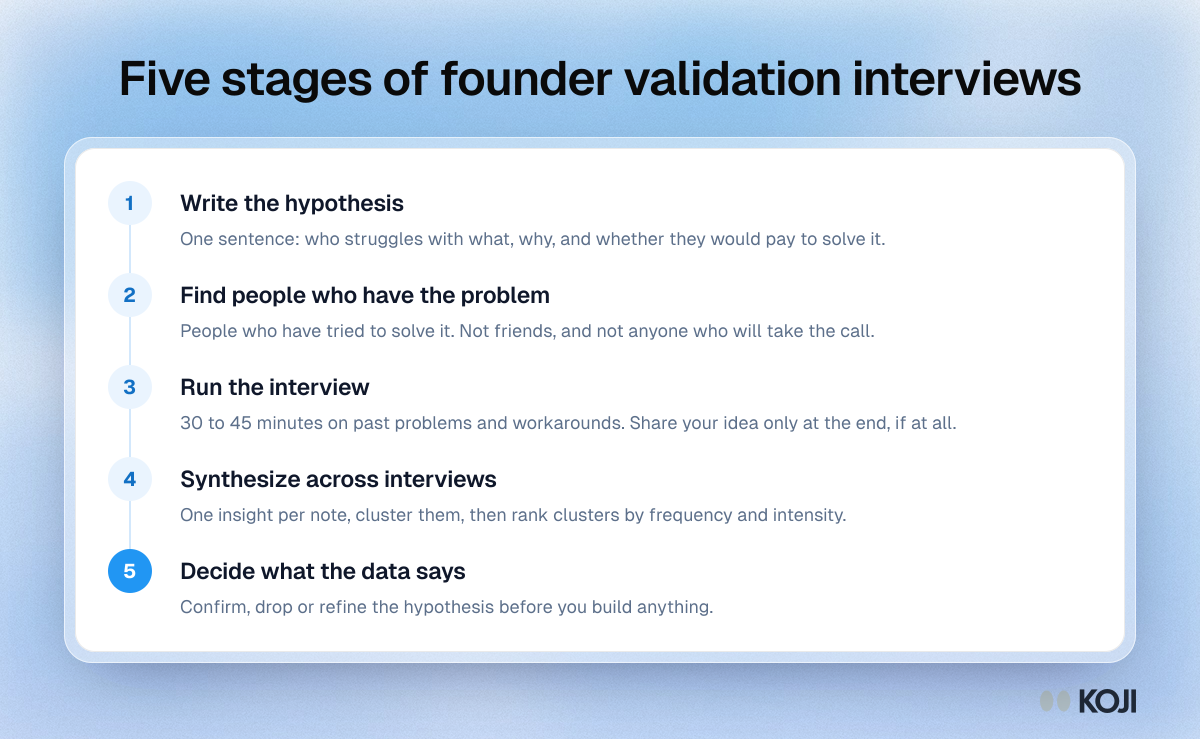
Process showing five stages of founder validation interviews: write the hypothesis, find people with the problem, run the interview, synthesize, and decide.

Process

Five stages of founder validation interviews
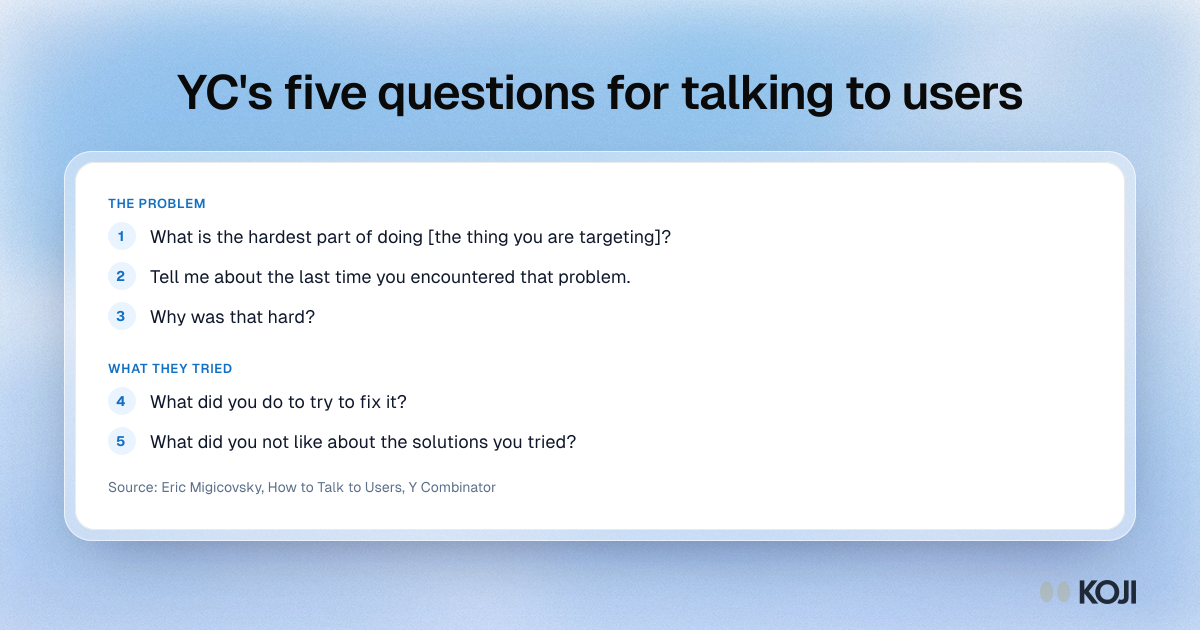
Question bank of the five Y Combinator questions for user interviews, from the hardest part of the task to what people disliked about the fixes they tried.

Question bank

YC's five questions for talking to users
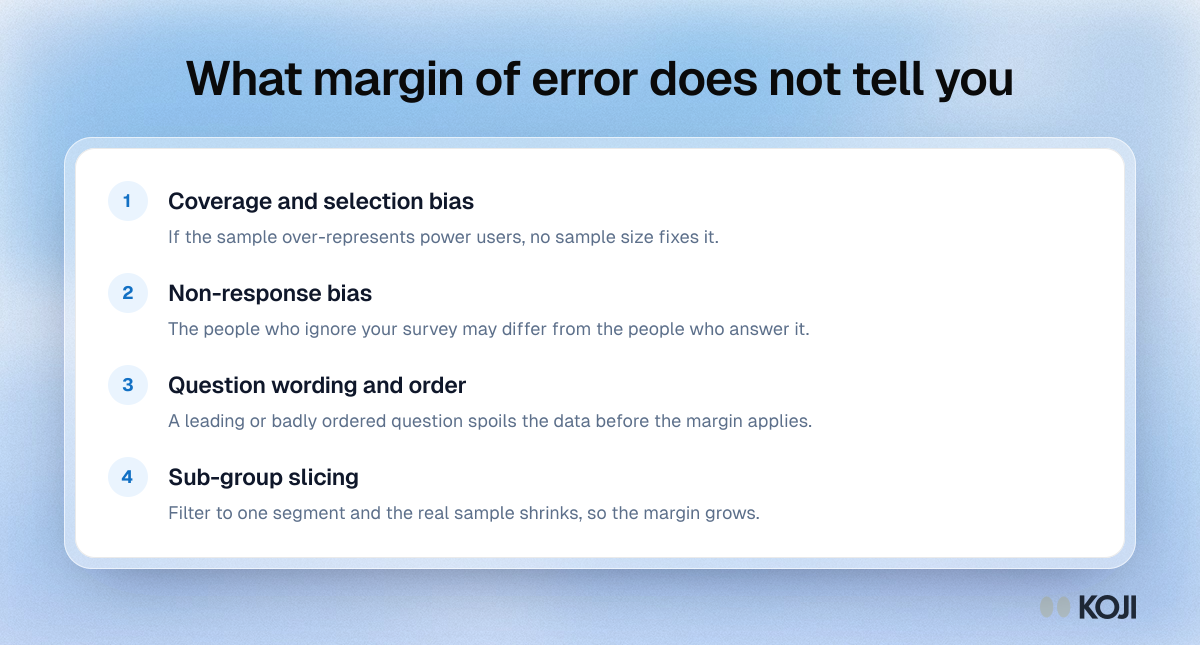
List of four survey errors margin of error does not cover: selection bias, non-response bias, question wording and order, and sub-group slicing.

Guide

What margin of error does not tell you
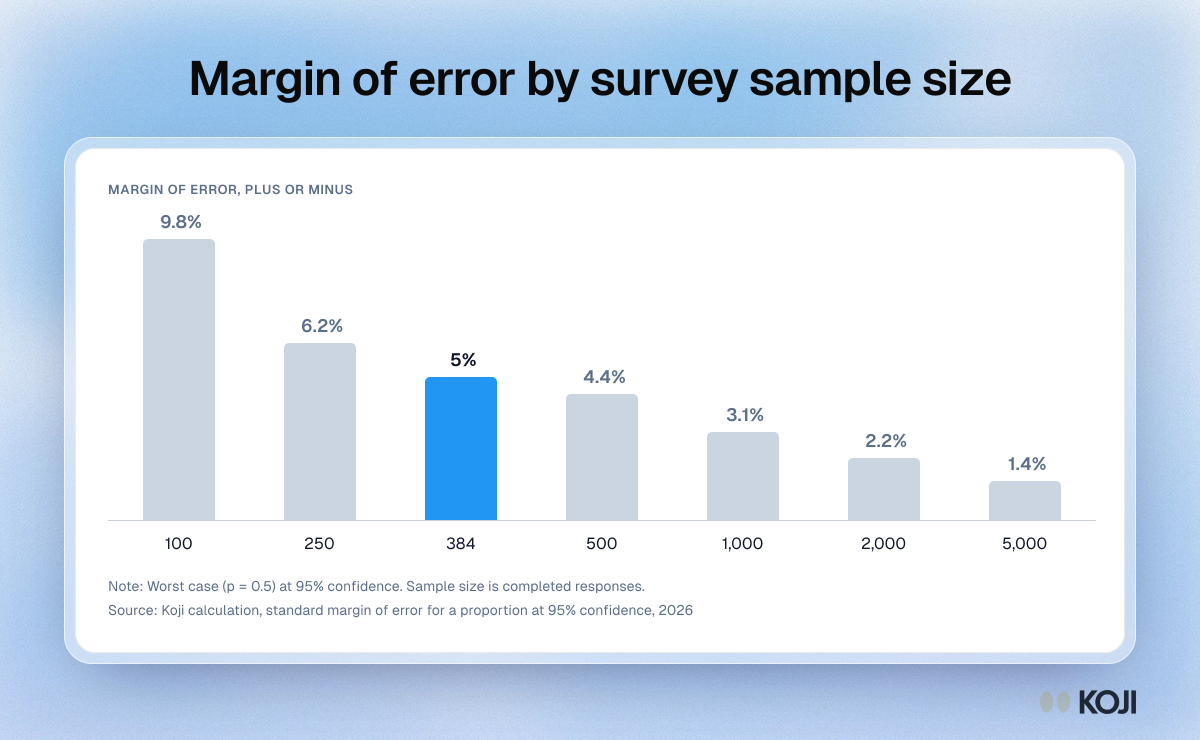
Column chart of survey margin of error by sample size at 95% confidence: 9.8% at 100 responses, 5% at 384, 3.1% at 1,000 and 1.4% at 5,000.

Column chart

Margin of error by survey sample size
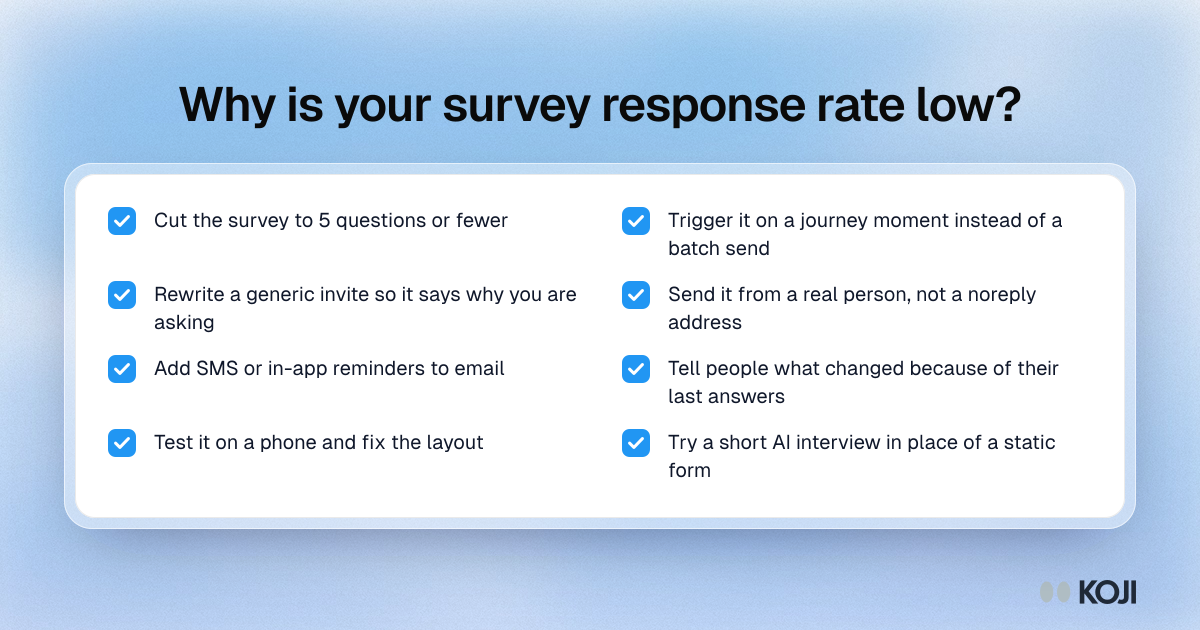
Checklist of eight fixes for a low survey response rate, ordered by impact, from cutting the survey to five questions to trying a conversational interview.

Checklist

Why is your survey response rate low?
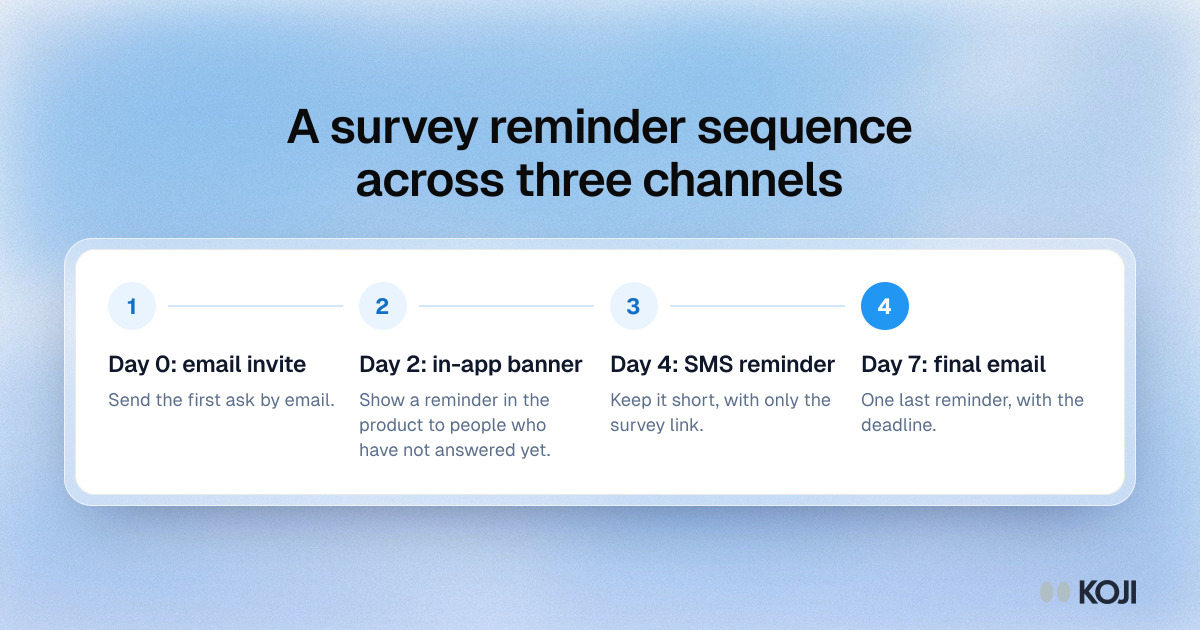
Process showing a survey reminder sequence: an email invite on day 0, an in-app banner on day 2, an SMS on day 4 and a final email with a deadline on day 7.

Process

A survey reminder sequence across three channels
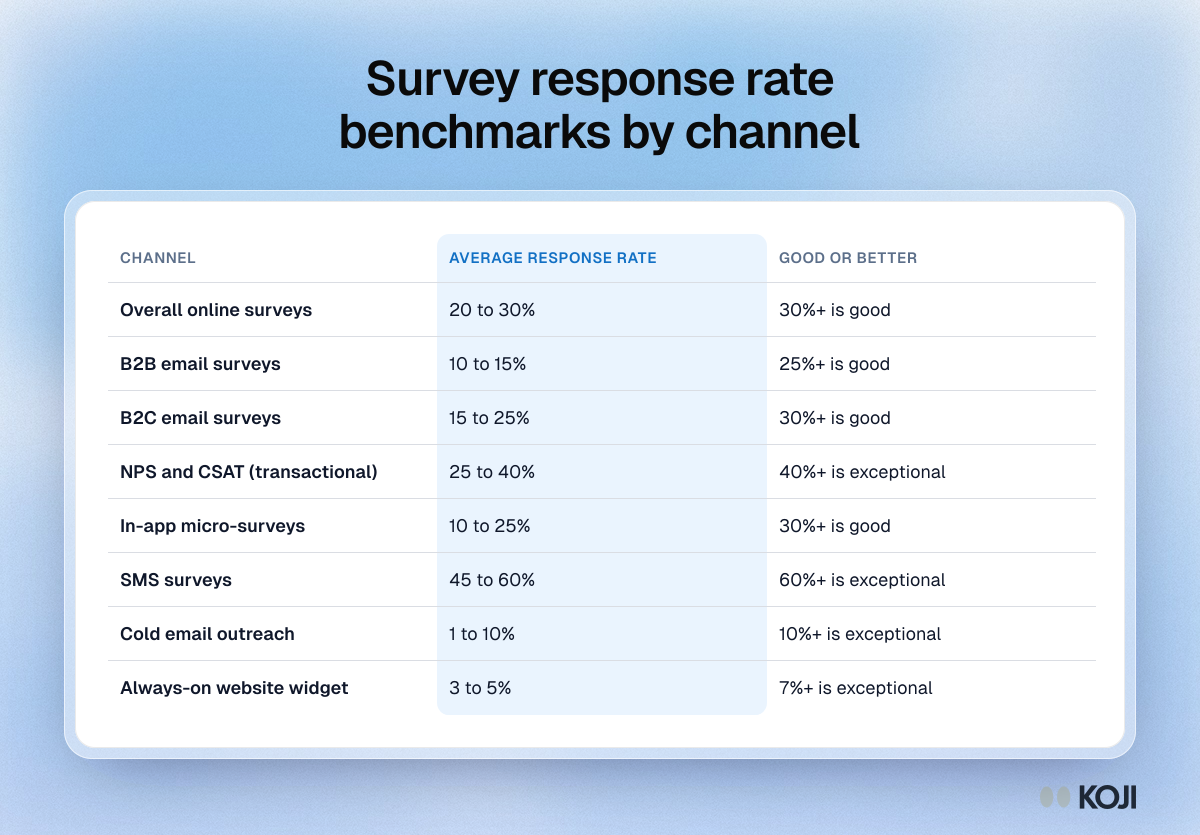
Table of survey response rate benchmarks by channel, from SMS surveys at 45 to 60% down to always-on website widgets at 3 to 5%.

Reference table

Survey response rate benchmarks by channel
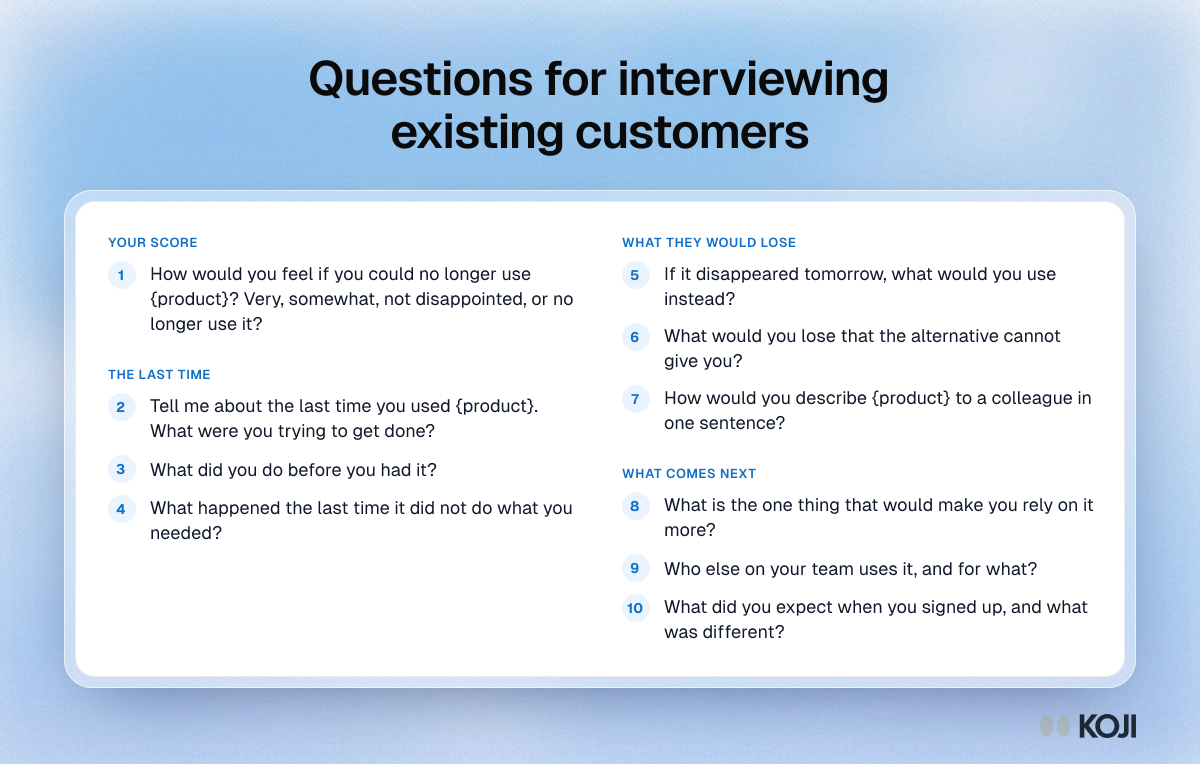
Question bank for interviewing existing customers in four groups: the Sean Ellis score, the last time they used it, what they would lose, and what comes next.

Question bank

Questions for interviewing existing customers
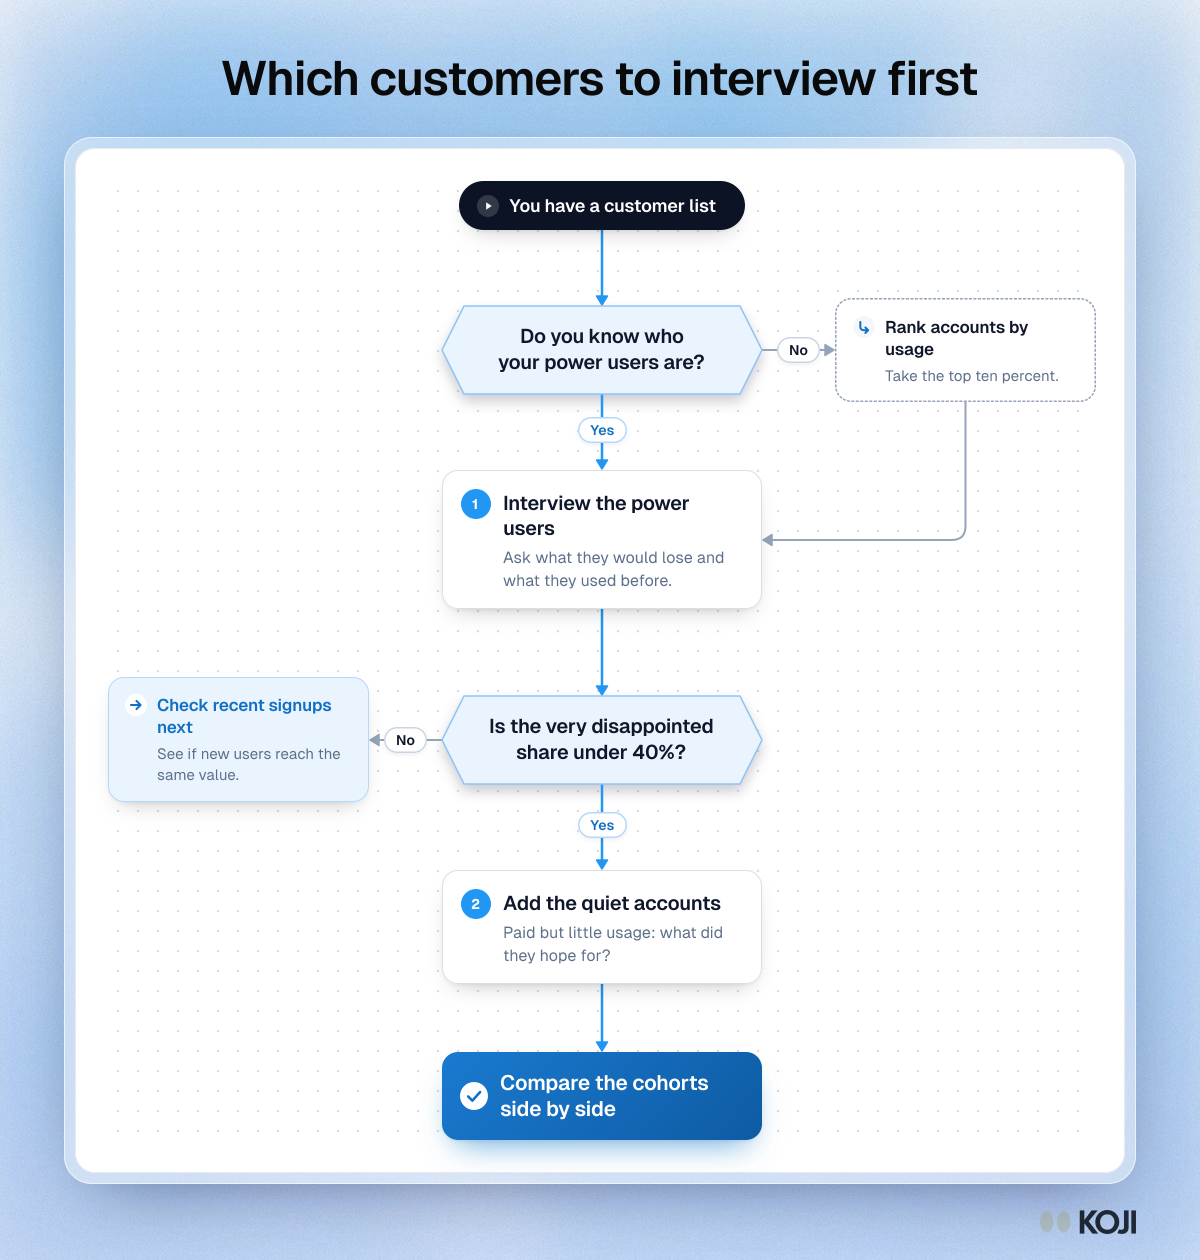
Flowchart for choosing which customers to interview first: two questions, one side step, ending with a side-by-side comparison of the cohorts.

Flowchart

Which customers to interview first
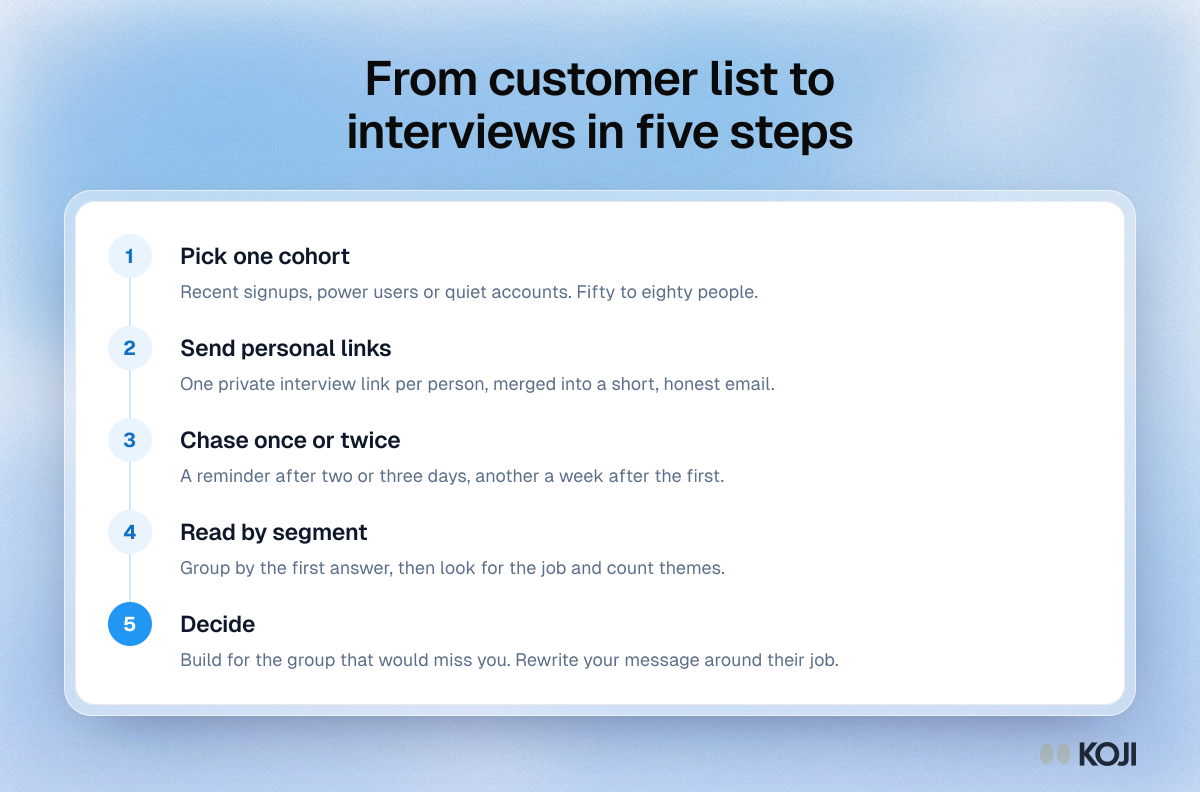
Process showing five steps from a customer list to a decision: pick one cohort, send personal links, chase once or twice, read by segment, then decide.

Process

From customer list to interviews in five steps
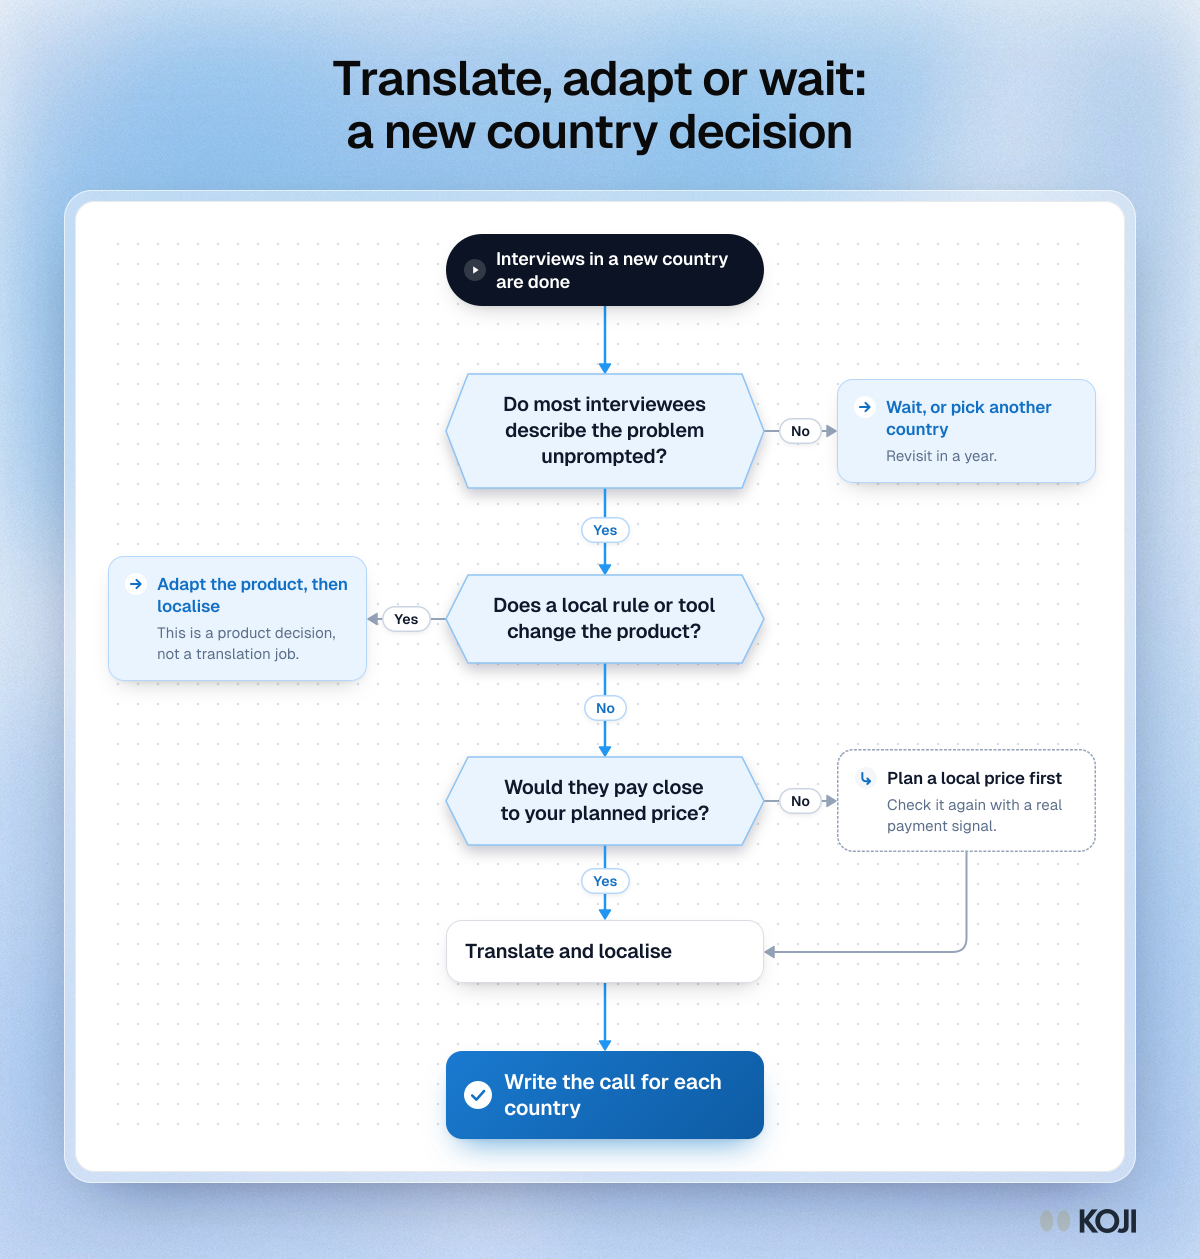
Flowchart for the decision after interviews in a new country: wait, adapt the product, plan a local price or translate.

Flowchart

Translate, adapt or wait: a new country decision
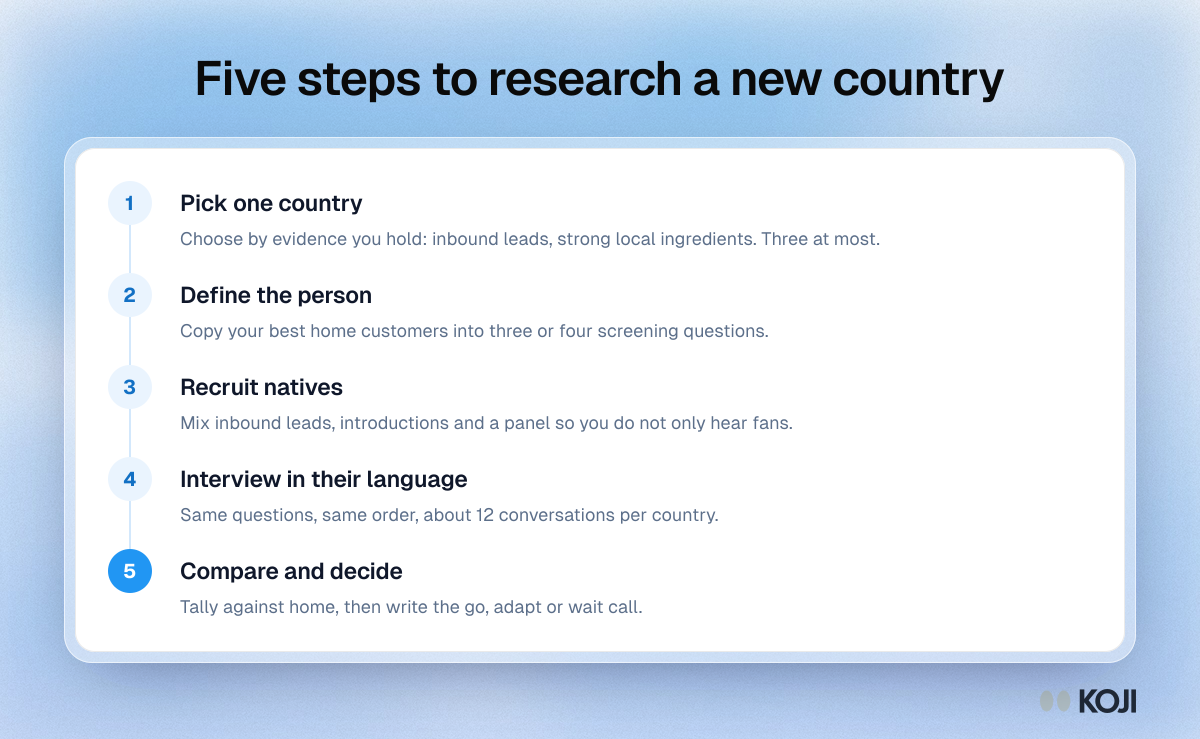
Process of five steps to research a new country before translating: pick, define, recruit, interview, then compare and decide.

Process

Five steps to research a new country
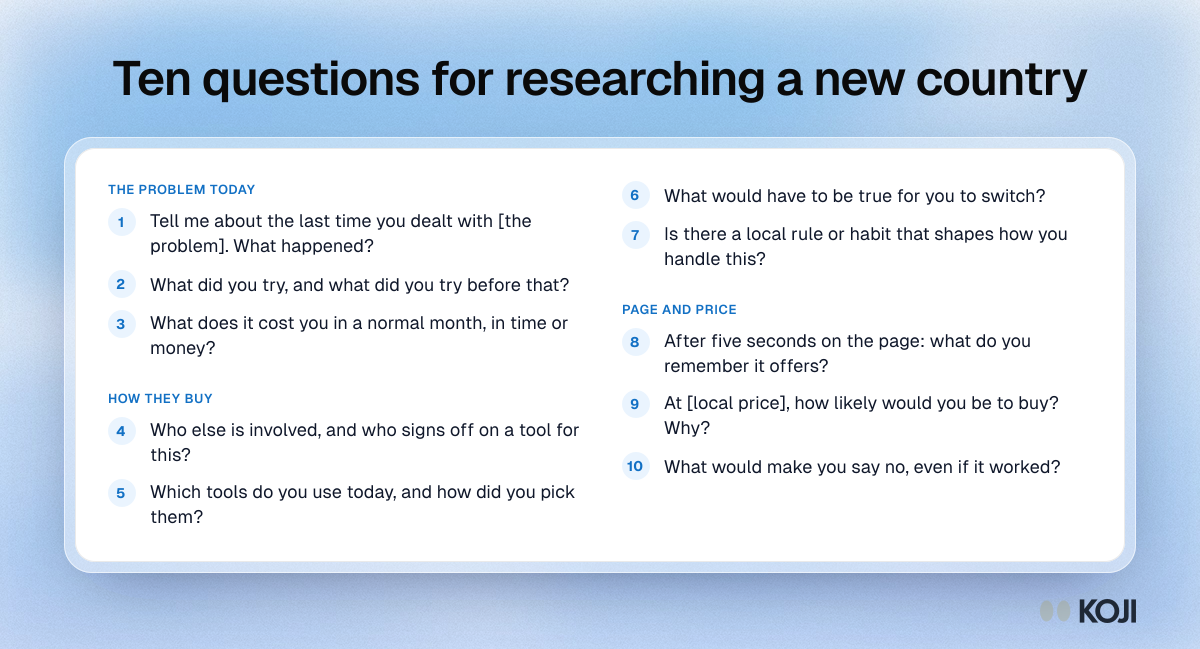
Question bank of ten interview questions for testing a new country: the problem today, how people buy, page and price.

Question bank

Ten questions for researching a new country
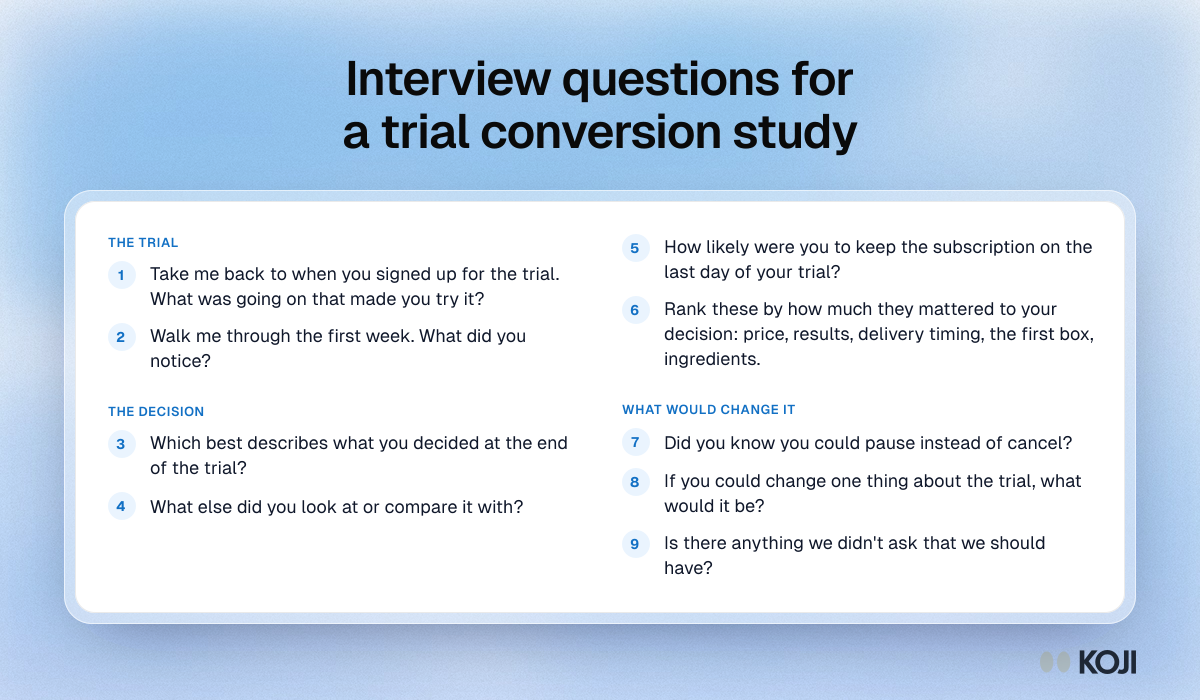
Question bank for a client trial-conversion study, grouped as the trial, the decision and what would change it.

Question bank

Interview questions for a trial conversion study
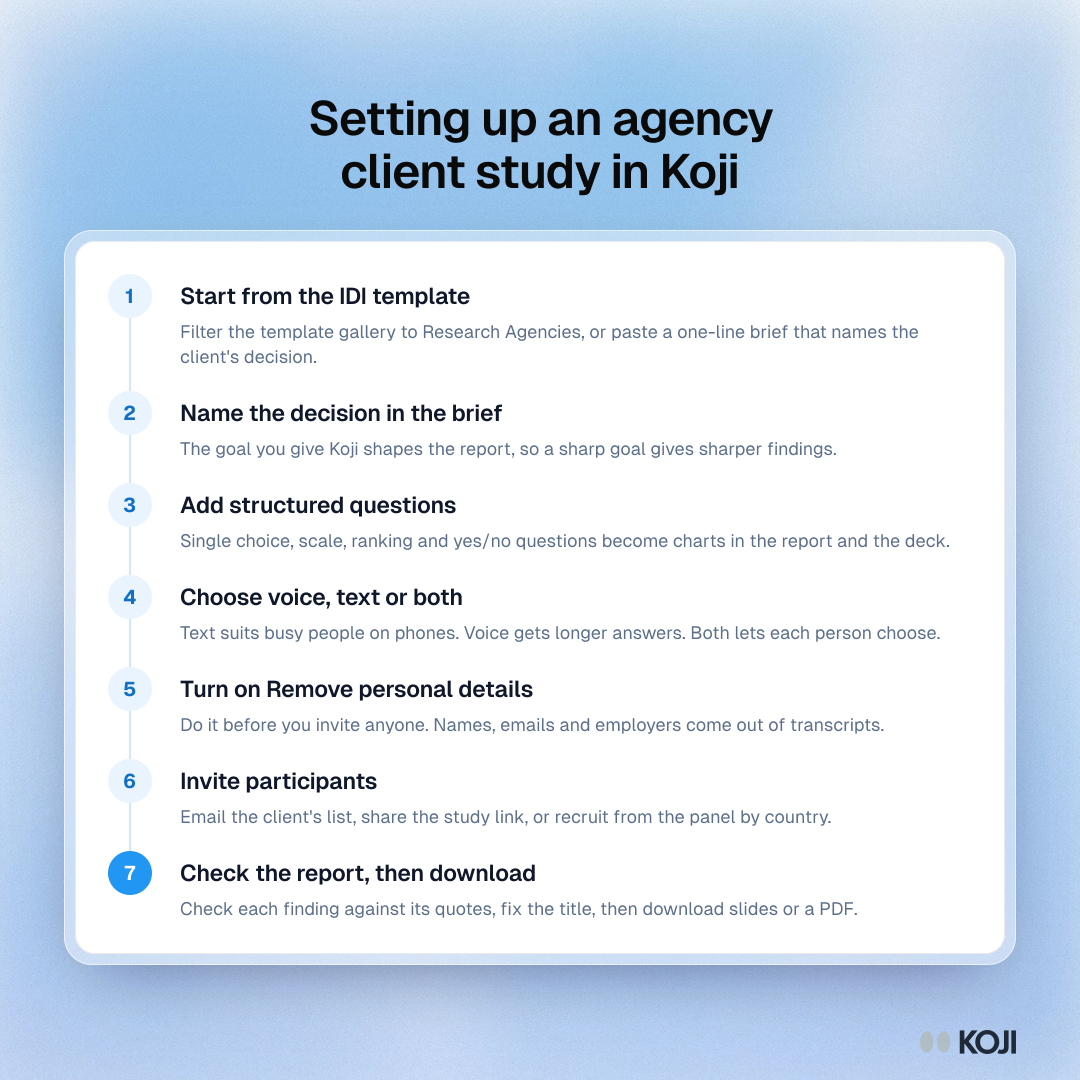
Process for setting up an agency client study in Koji in seven steps, from the IDI template to checking the report and downloading the deck.
Process

Setting up an agency client study in Koji

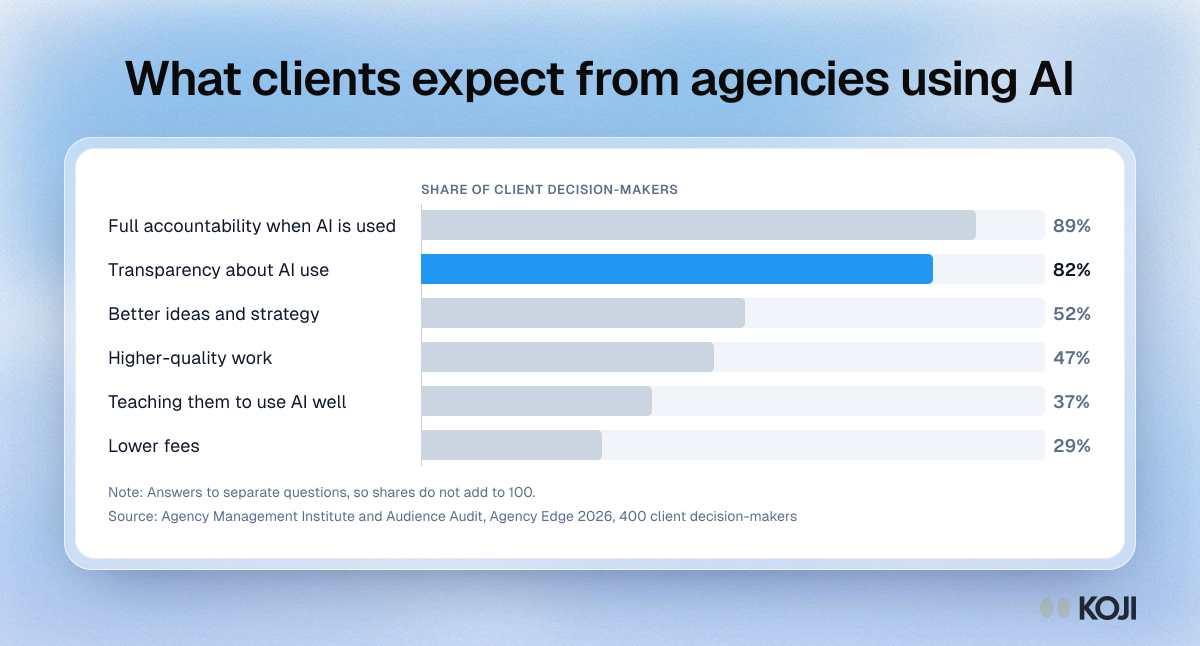
Bar chart of what 400 client decision-makers expect from agencies using AI: 89% full accountability, 82% transparency, 29% lower fees.

Bar chart

What clients expect from agencies using AI
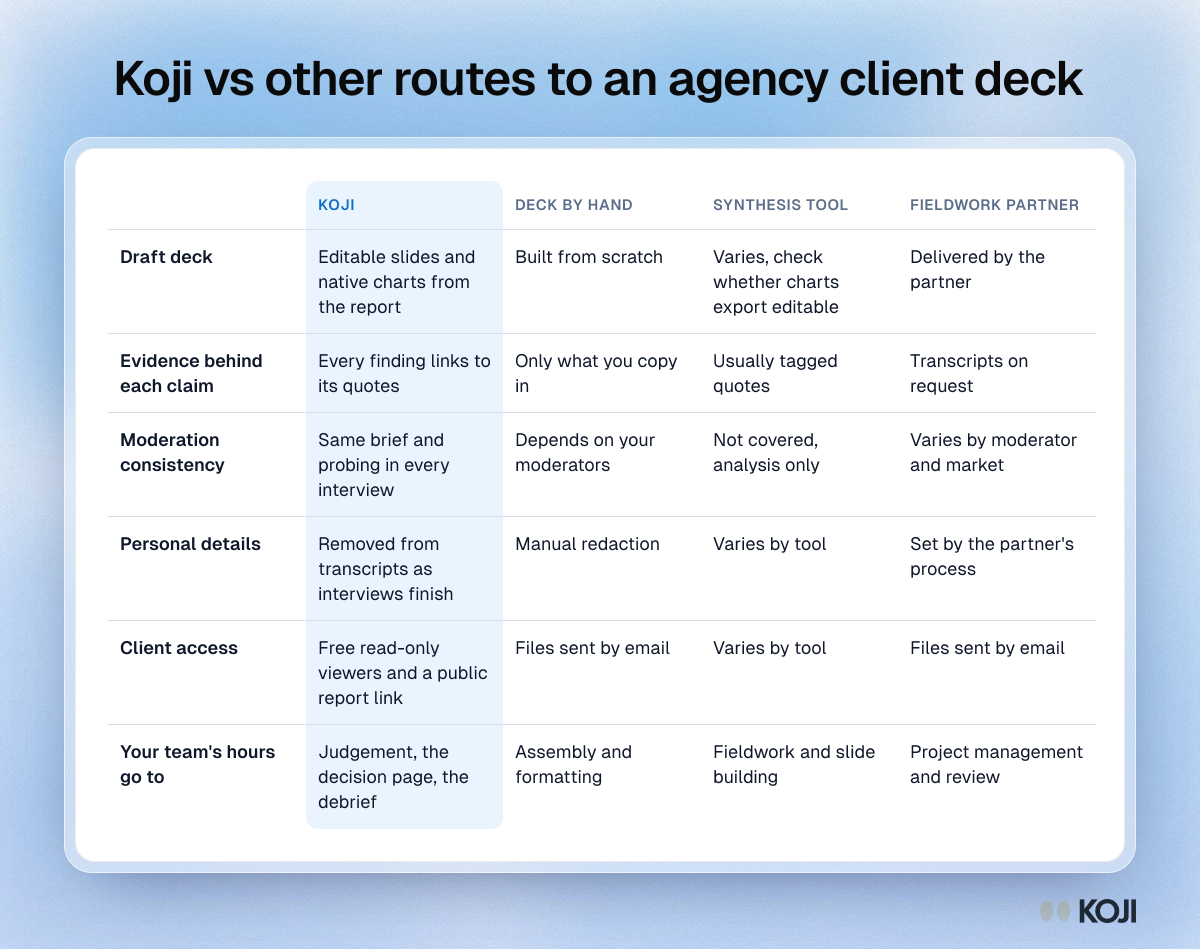
Comparison table of Koji against building the deck by hand, a transcription and synthesis tool, and a moderated fieldwork partner.

Reference table

Koji vs other routes to an agency client deck
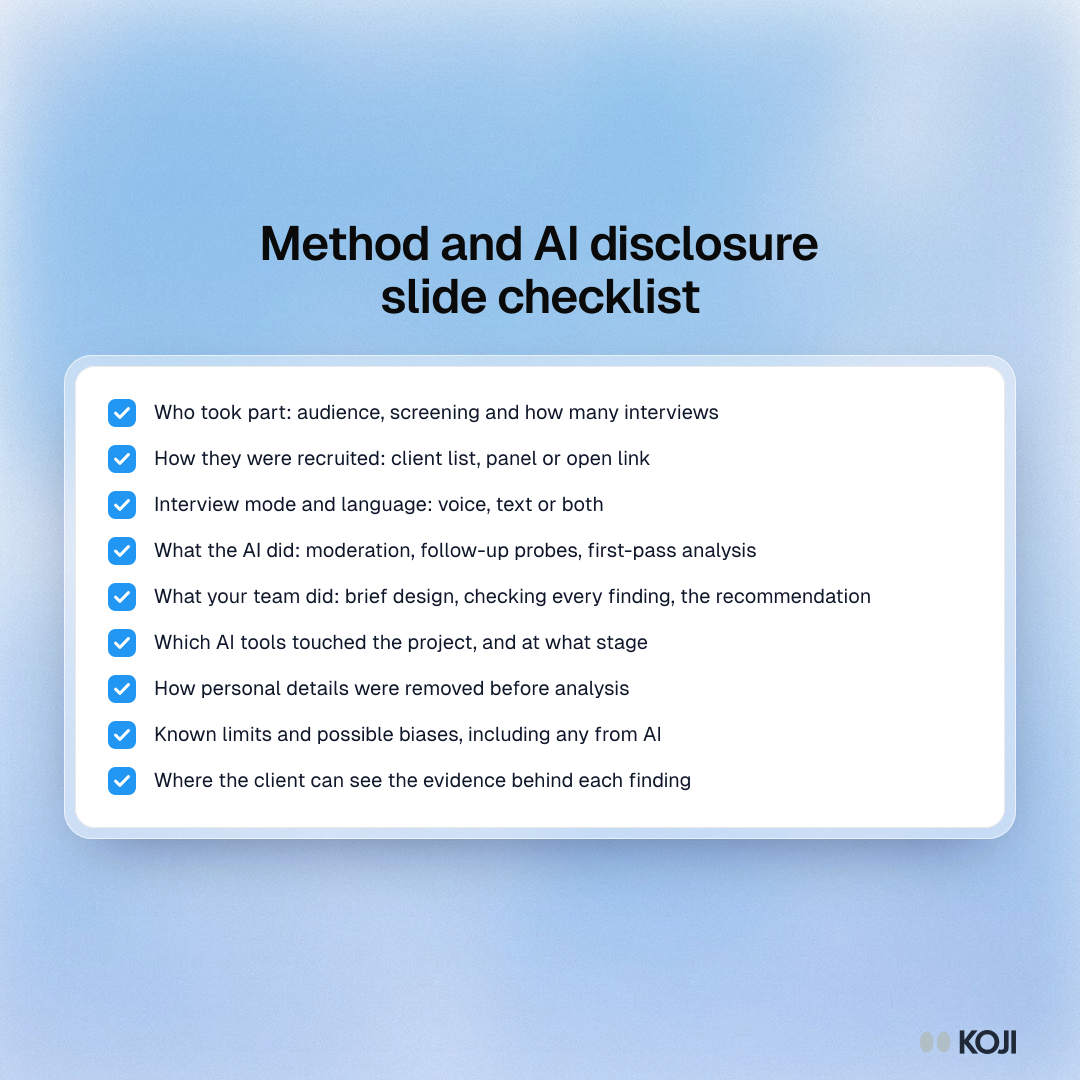
Checklist of what to state on a research method and AI disclosure slide, from sample and recruitment to human review and data handling.

Checklist

Method and AI disclosure slide checklist
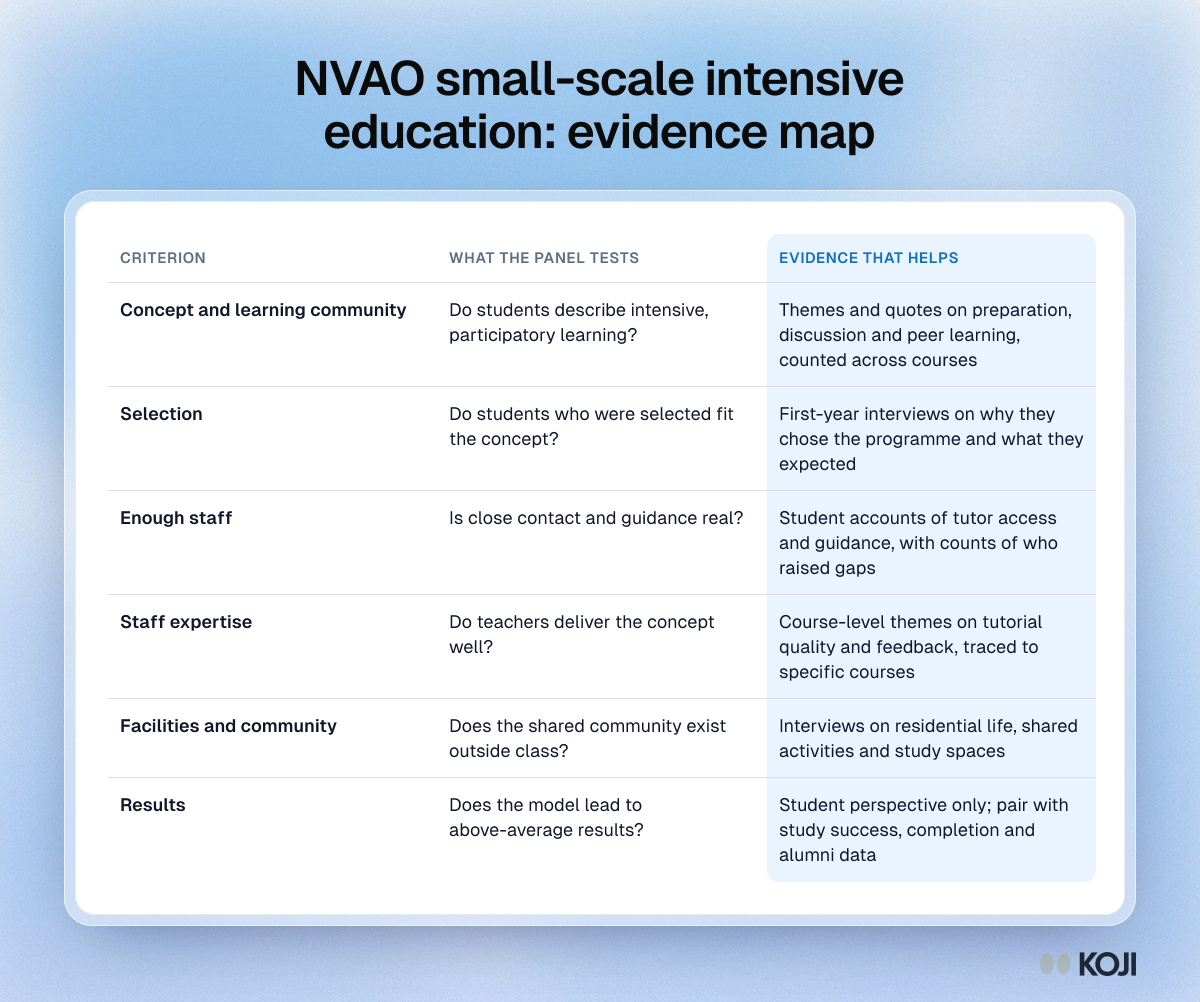
Table mapping NVAO small-scale and intensive education criteria to the student evaluation evidence that supports each one.

Reference table

NVAO small-scale intensive education: evidence map