Free to save and share

Frameworks and cheat sheets for customer research

Every framework, checklist and comparison from our guides, as an image you can download, drop into a deck or share with your team.
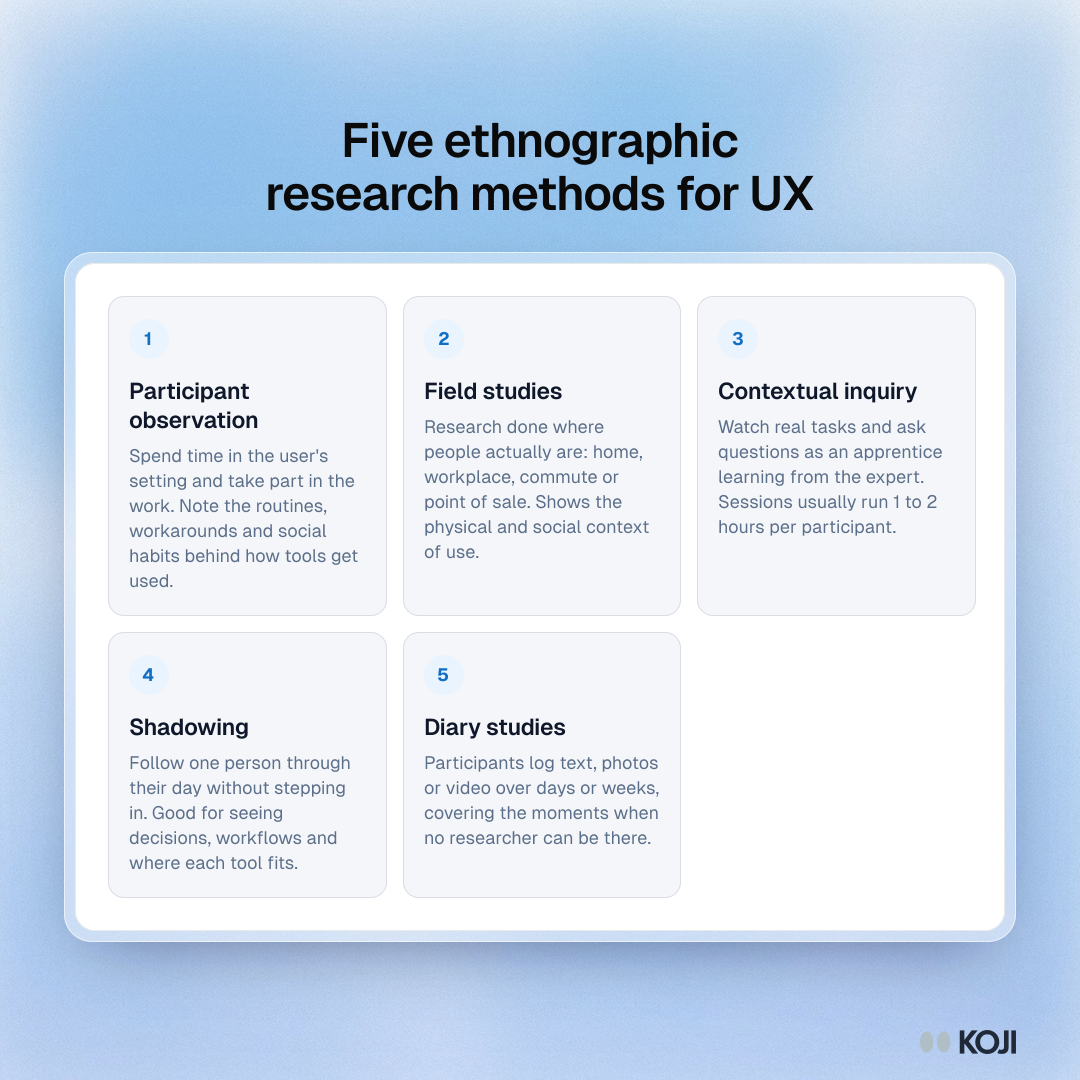
Framework showing five ethnographic research methods: participant observation, field studies, contextual inquiry, shadowing and diary studies.

Framework

Five ethnographic research methods for UX
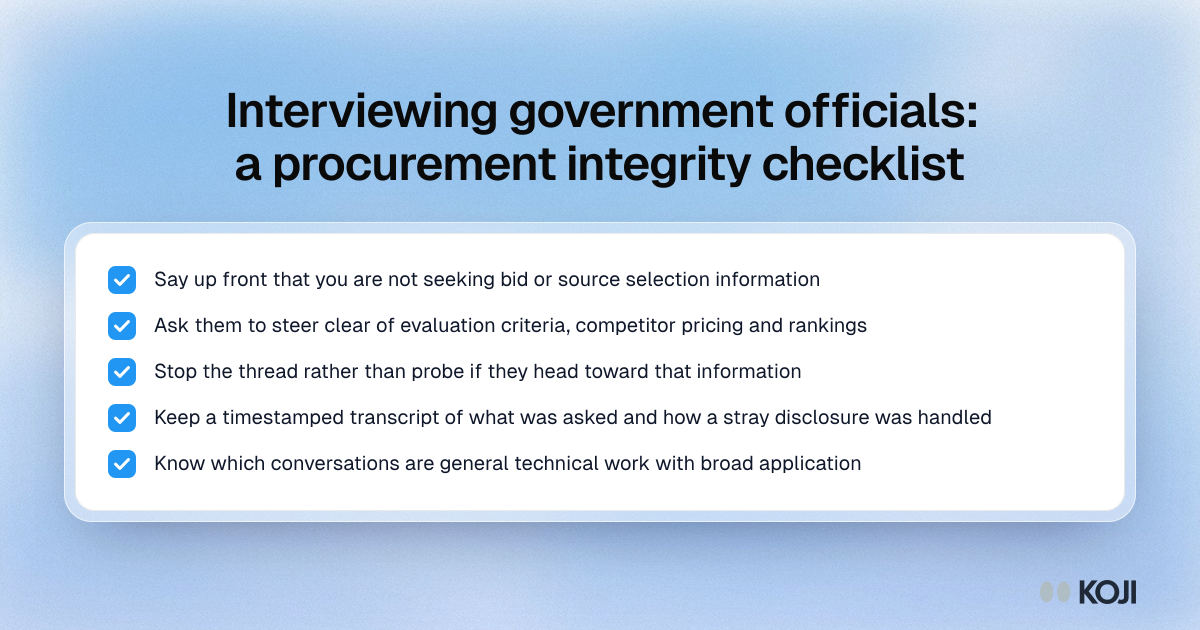
Checklist for interviewing government officials under procurement integrity rules: state the boundary, stop rather than probe, and keep a transcript.

Checklist

Interviewing government officials: a procurement integrity checklist
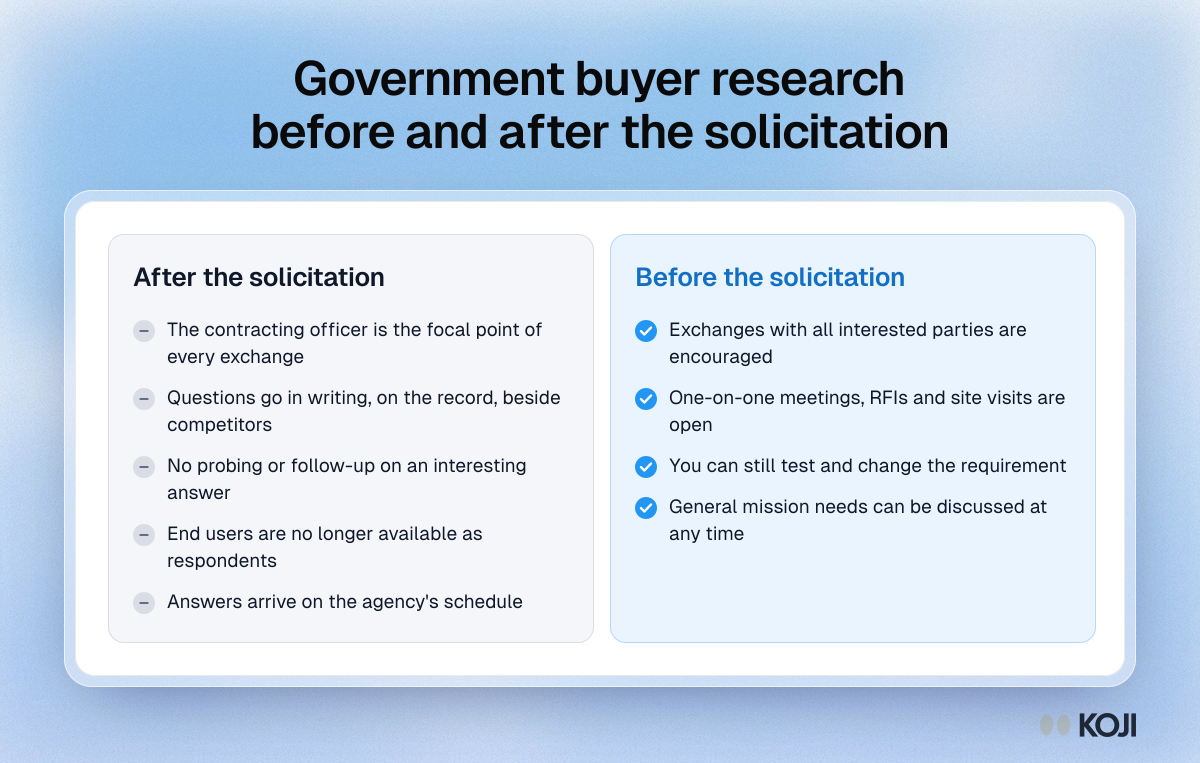
Comparison of government buyer research before a solicitation, when exchanges are encouraged, and after, when all contact goes through the contracting officer.

Comparison

Government buyer research before and after the solicitation
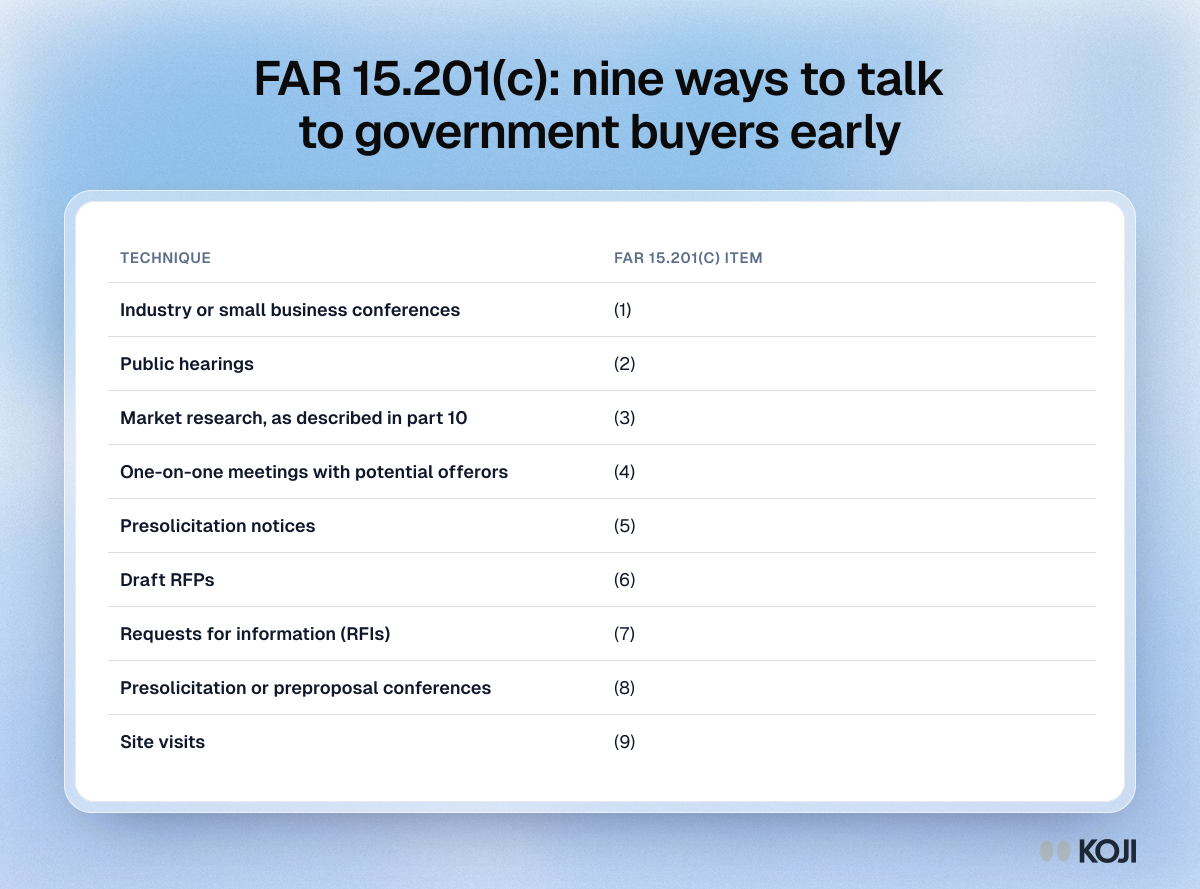
Table of the nine early exchange techniques in FAR 15.201(c), from industry conferences and one-on-one meetings to draft RFPs, RFIs and site visits.

Reference table

FAR 15.201(c): nine ways to talk to government buyers early
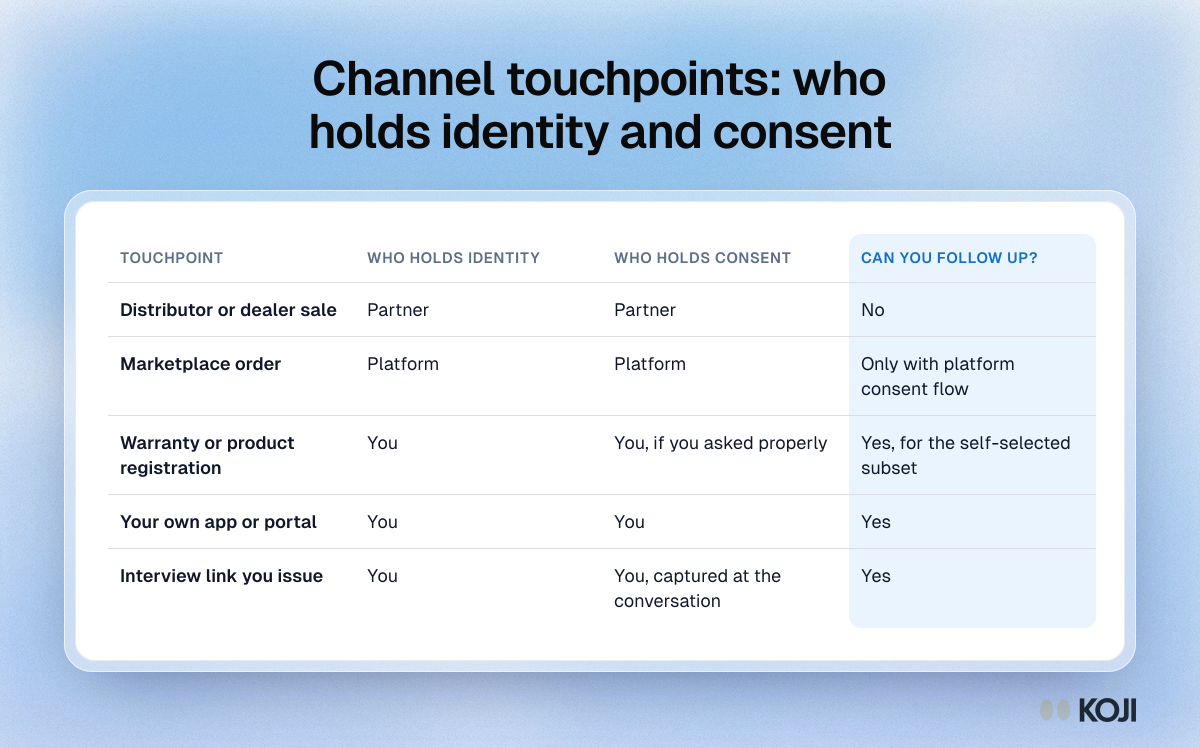
Table of five channel touchpoints, from a distributor sale to an interview link you issue, showing who holds identity and consent and if you can follow up.

Reference table

Channel touchpoints: who holds identity and consent
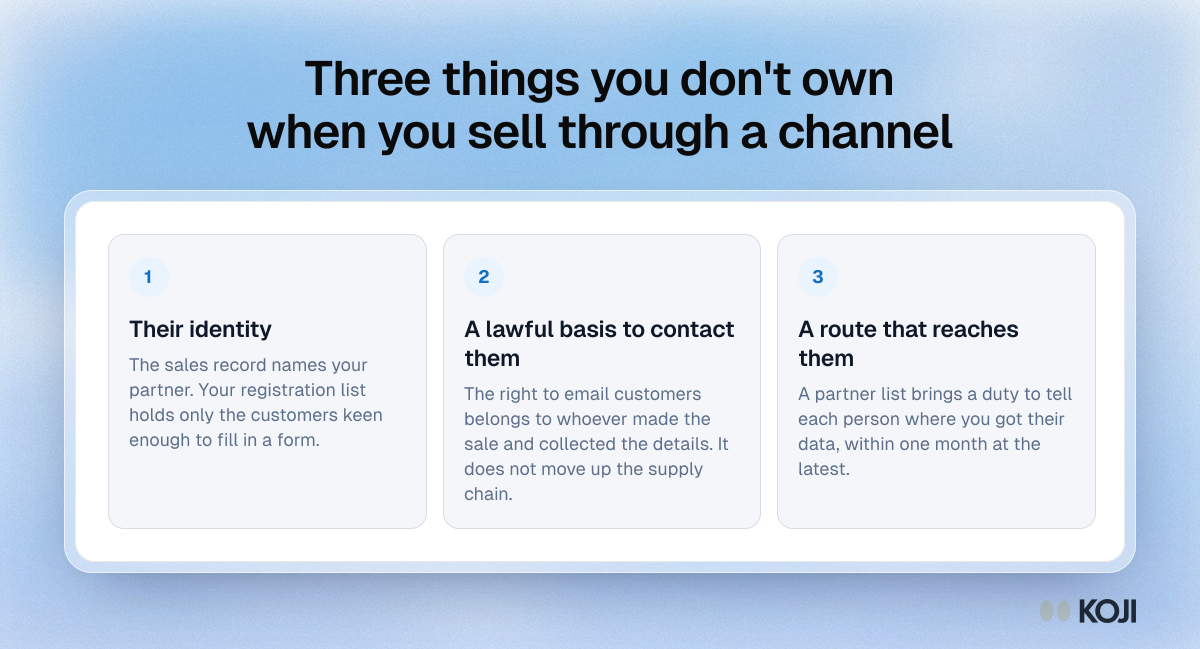
Framework of three things a manufacturer selling through a channel lacks for follow-up research: customer identity, a lawful basis to contact, and a route.

Framework

Three things you don't own when you sell through a channel
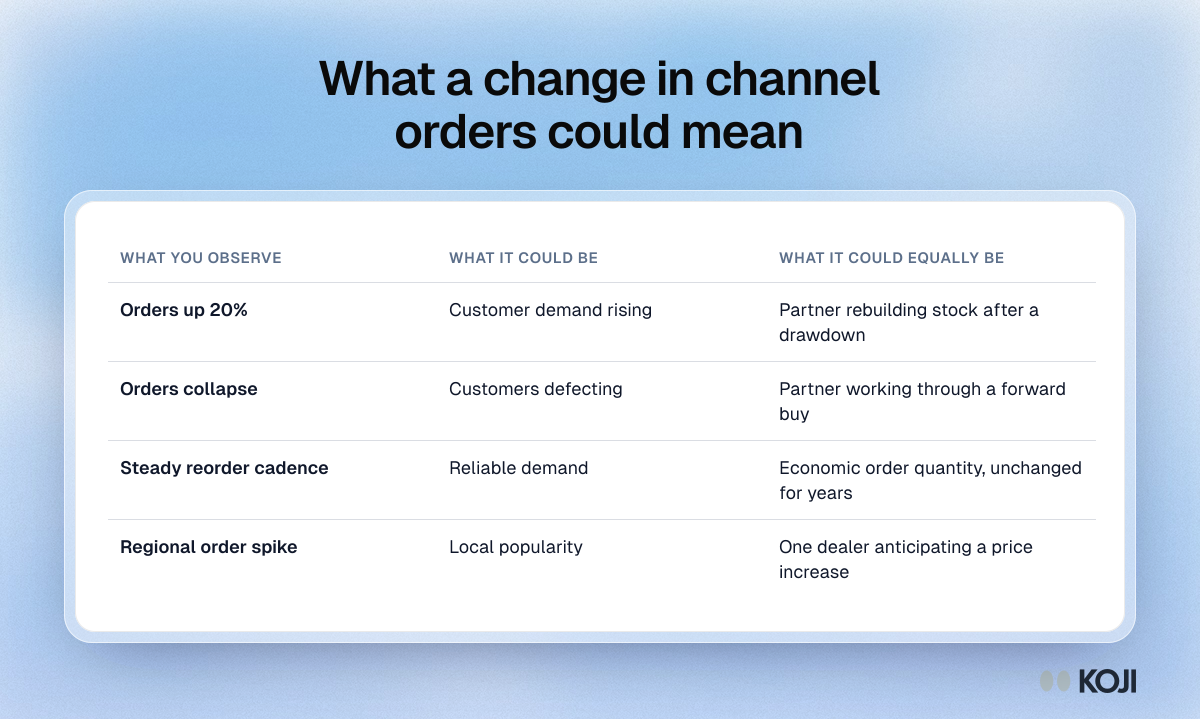
Table of four channel order signals, such as orders up 20% or a regional spike, each with a demand reading and an equally likely stocking reading.

Reference table

What a change in channel orders could mean
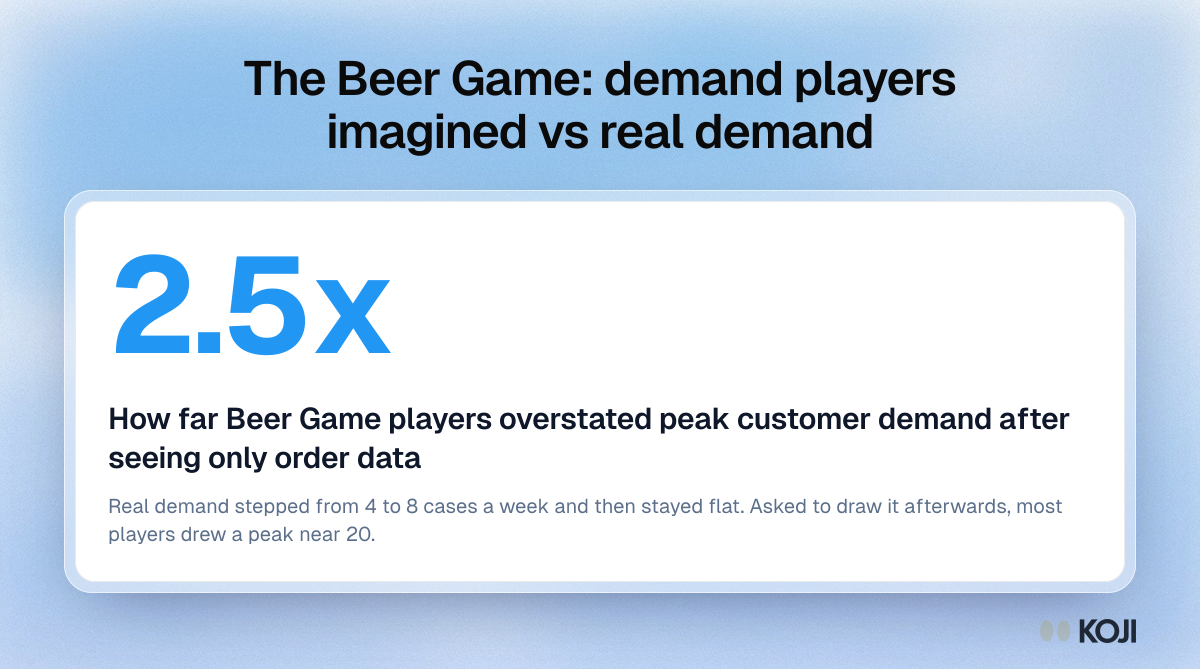
Stat card: Beer Game players overstated peak customer demand 2.5 times, drawing a peak near 20 cases when real demand was a flat 8.

Key figure

The Beer Game: demand players imagined vs real demand
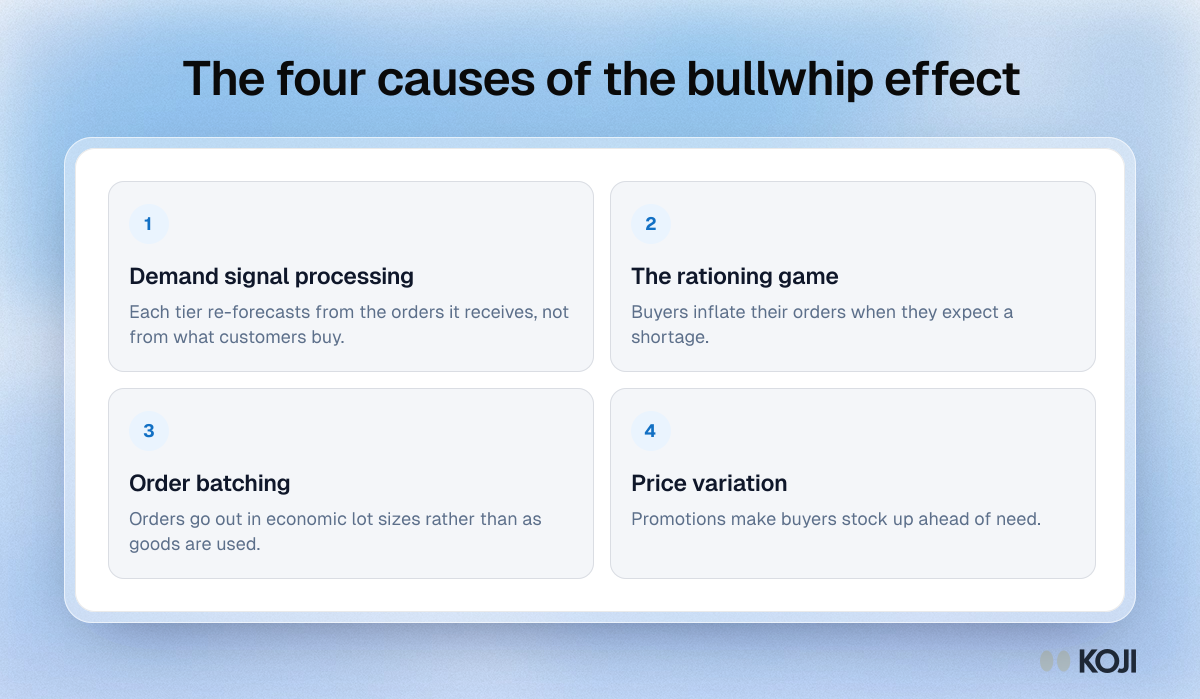
Framework of the four causes of the bullwhip effect: demand signal processing, the rationing game, order batching and price variation.

Framework

The four causes of the bullwhip effect
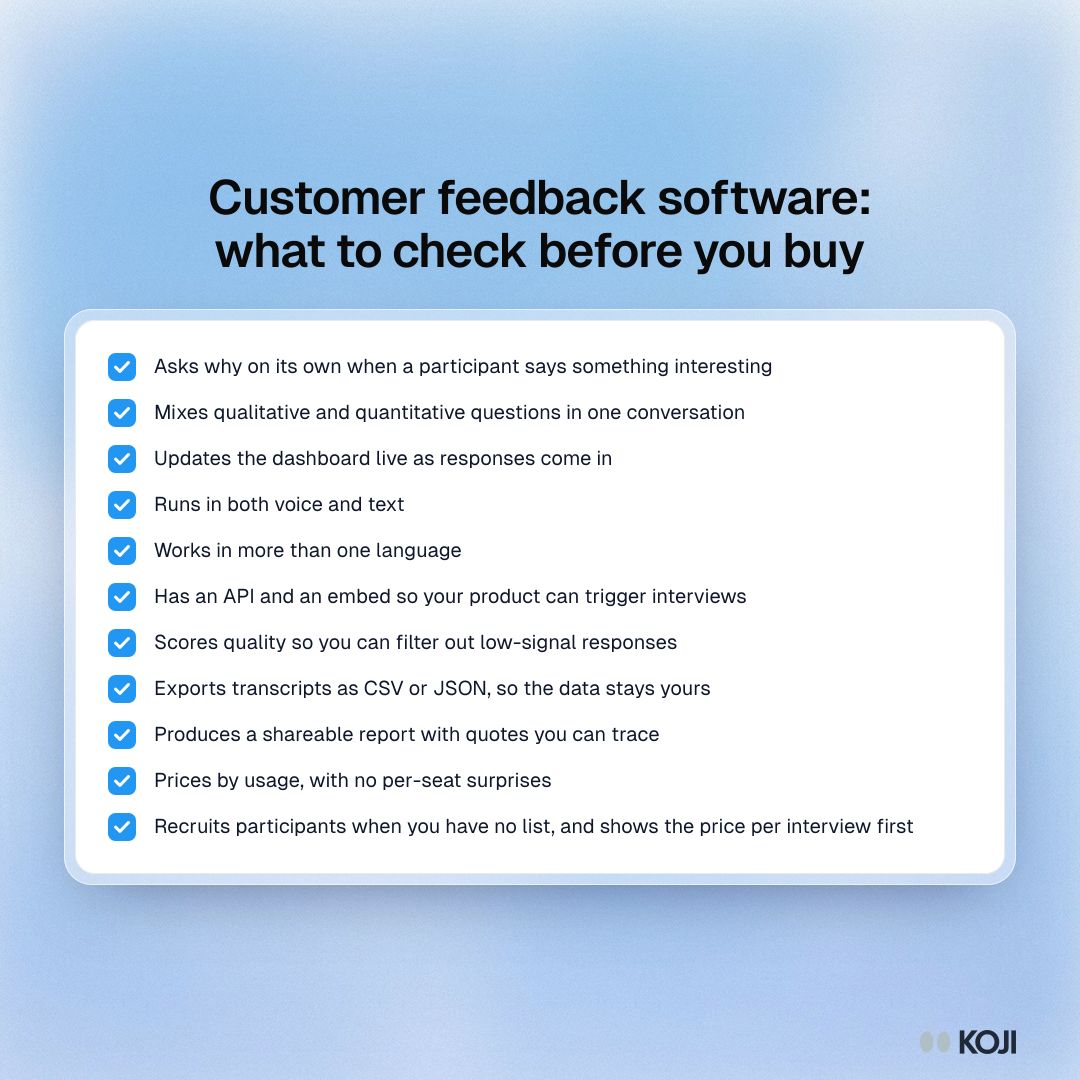
Checklist of 11 things to check in customer feedback software, from automatic follow-up questions and live dashboards to data export and recruiting.

Checklist

Customer feedback software: what to check before you buy
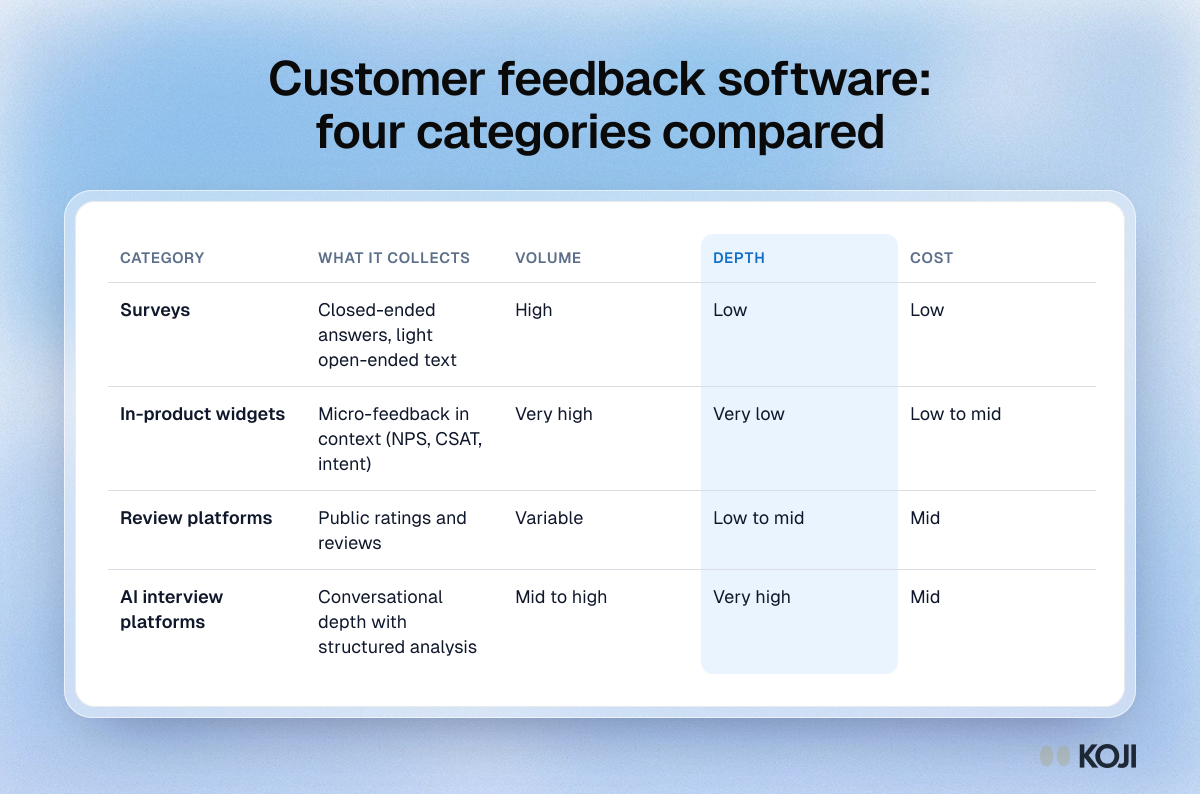
Table comparing surveys, in-product widgets, review platforms and AI interview platforms by what they collect, volume, depth and cost.

Reference table

Customer feedback software: four categories compared
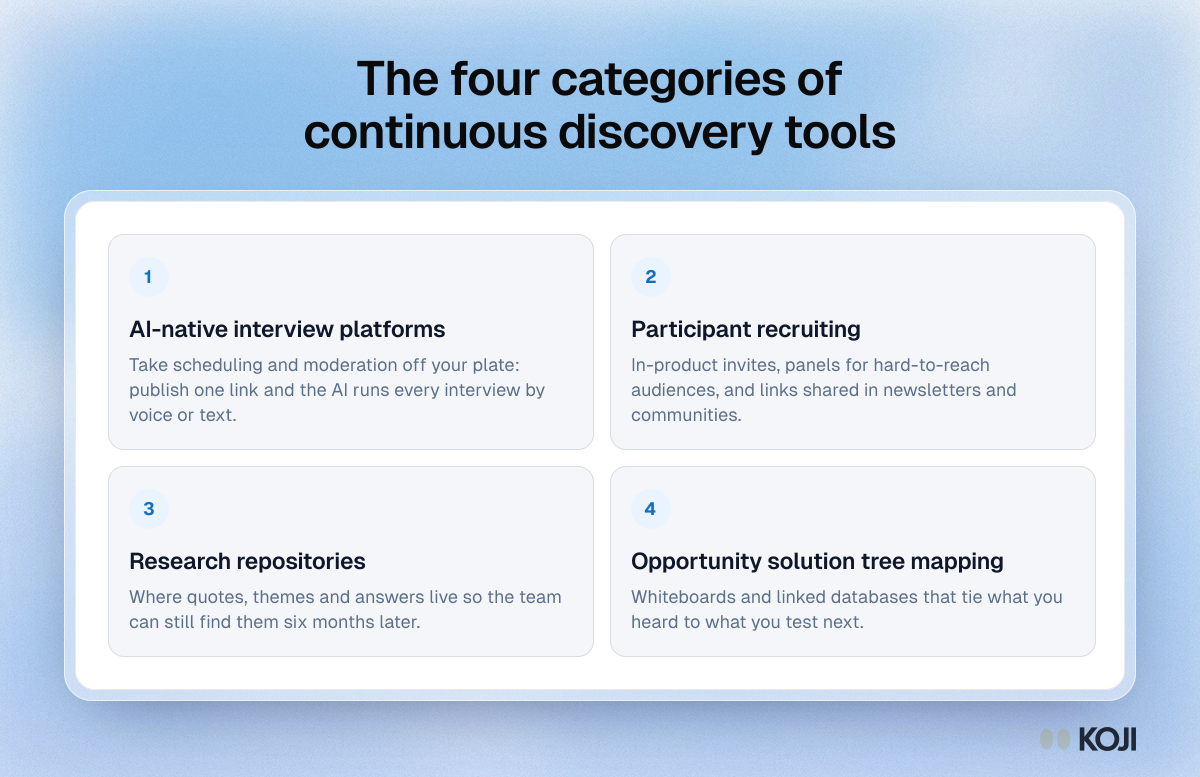
Framework of four kinds of continuous discovery tools: AI-native interview platforms, participant recruiting, research repositories and opportunity mapping.

Framework

The four categories of continuous discovery tools
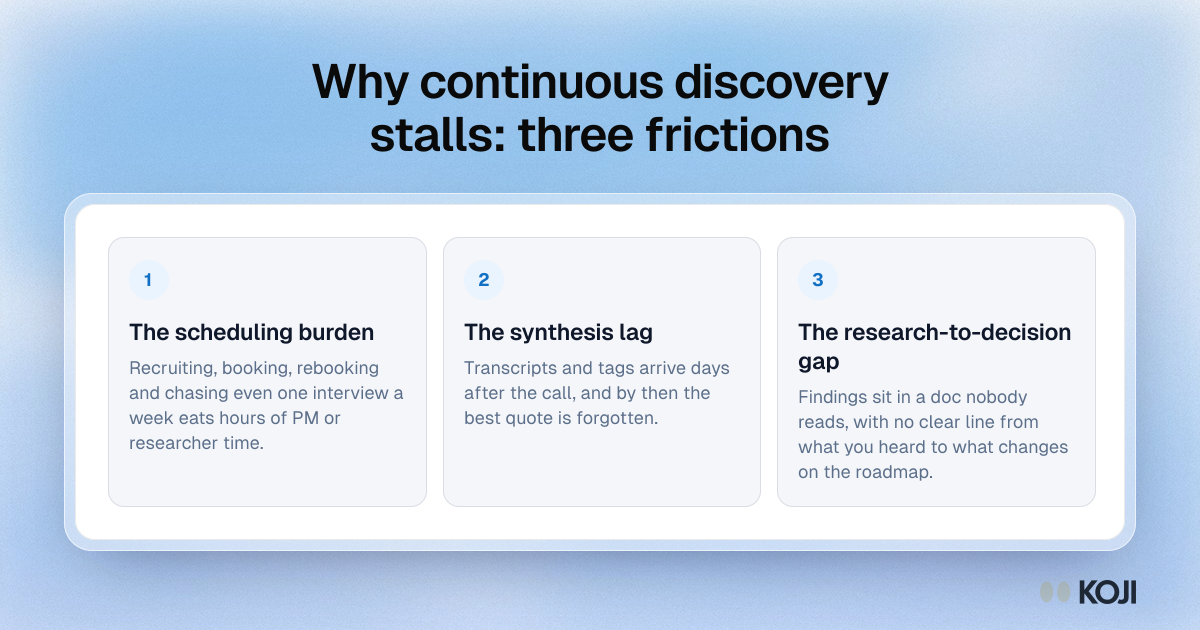
Framework of three frictions that stall continuous discovery: the scheduling burden, the synthesis lag and the gap between research and decisions.

Framework

Why continuous discovery stalls: three frictions
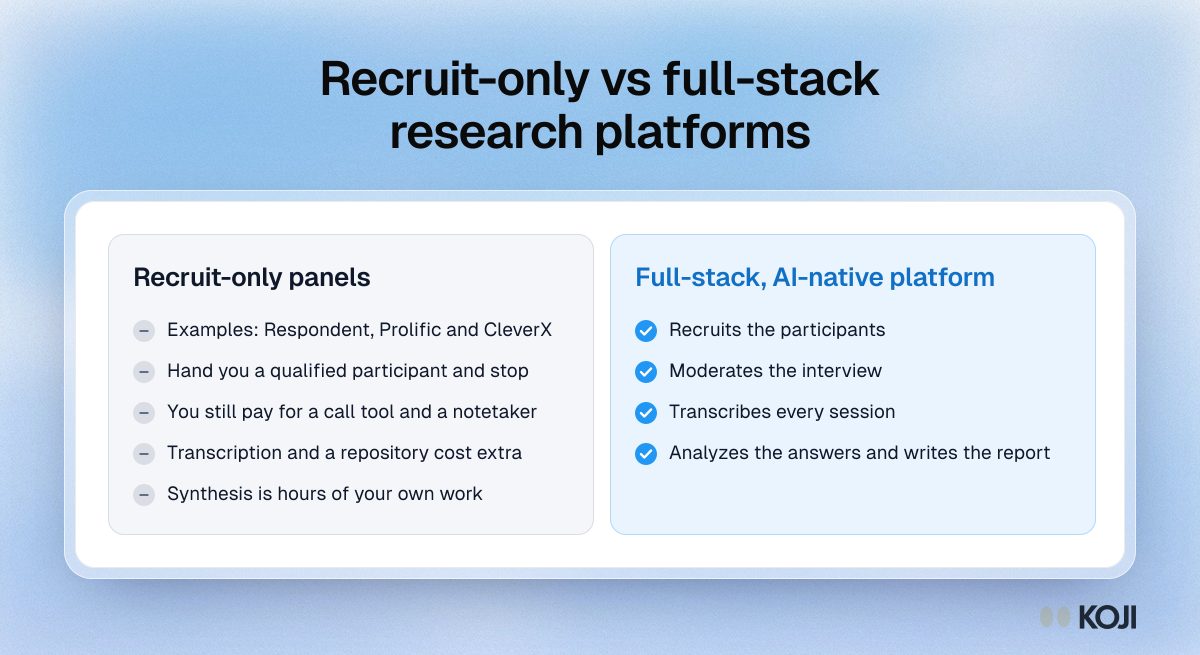
Comparison of recruit-only panels, which hand over a participant and stop, with full-stack platforms that recruit, moderate, transcribe and report.

Comparison

Recruit-only vs full-stack research platforms
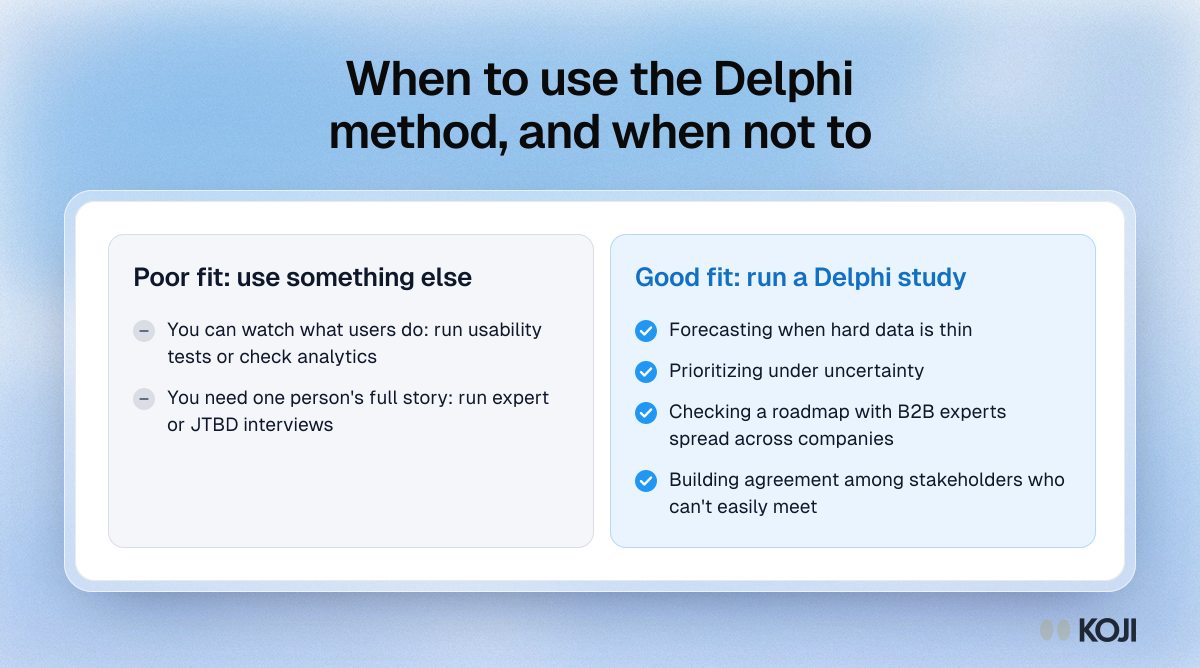
Comparison of when the Delphi method fits: forecasts and priorities that rest on expert judgment, against cases where you can observe behavior instead.

Comparison

When to use the Delphi method, and when not to
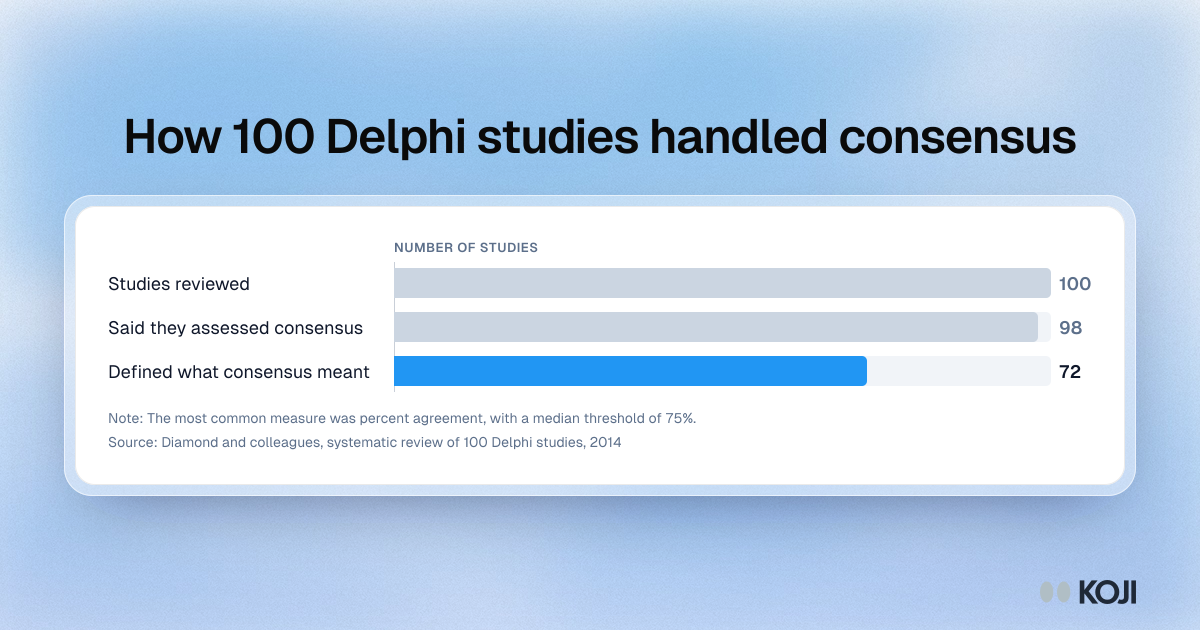
Bar chart of a review of 100 Delphi studies: 98 said they assessed consensus, but only 72 defined what consensus meant.

Bar chart

How 100 Delphi studies handled consensus
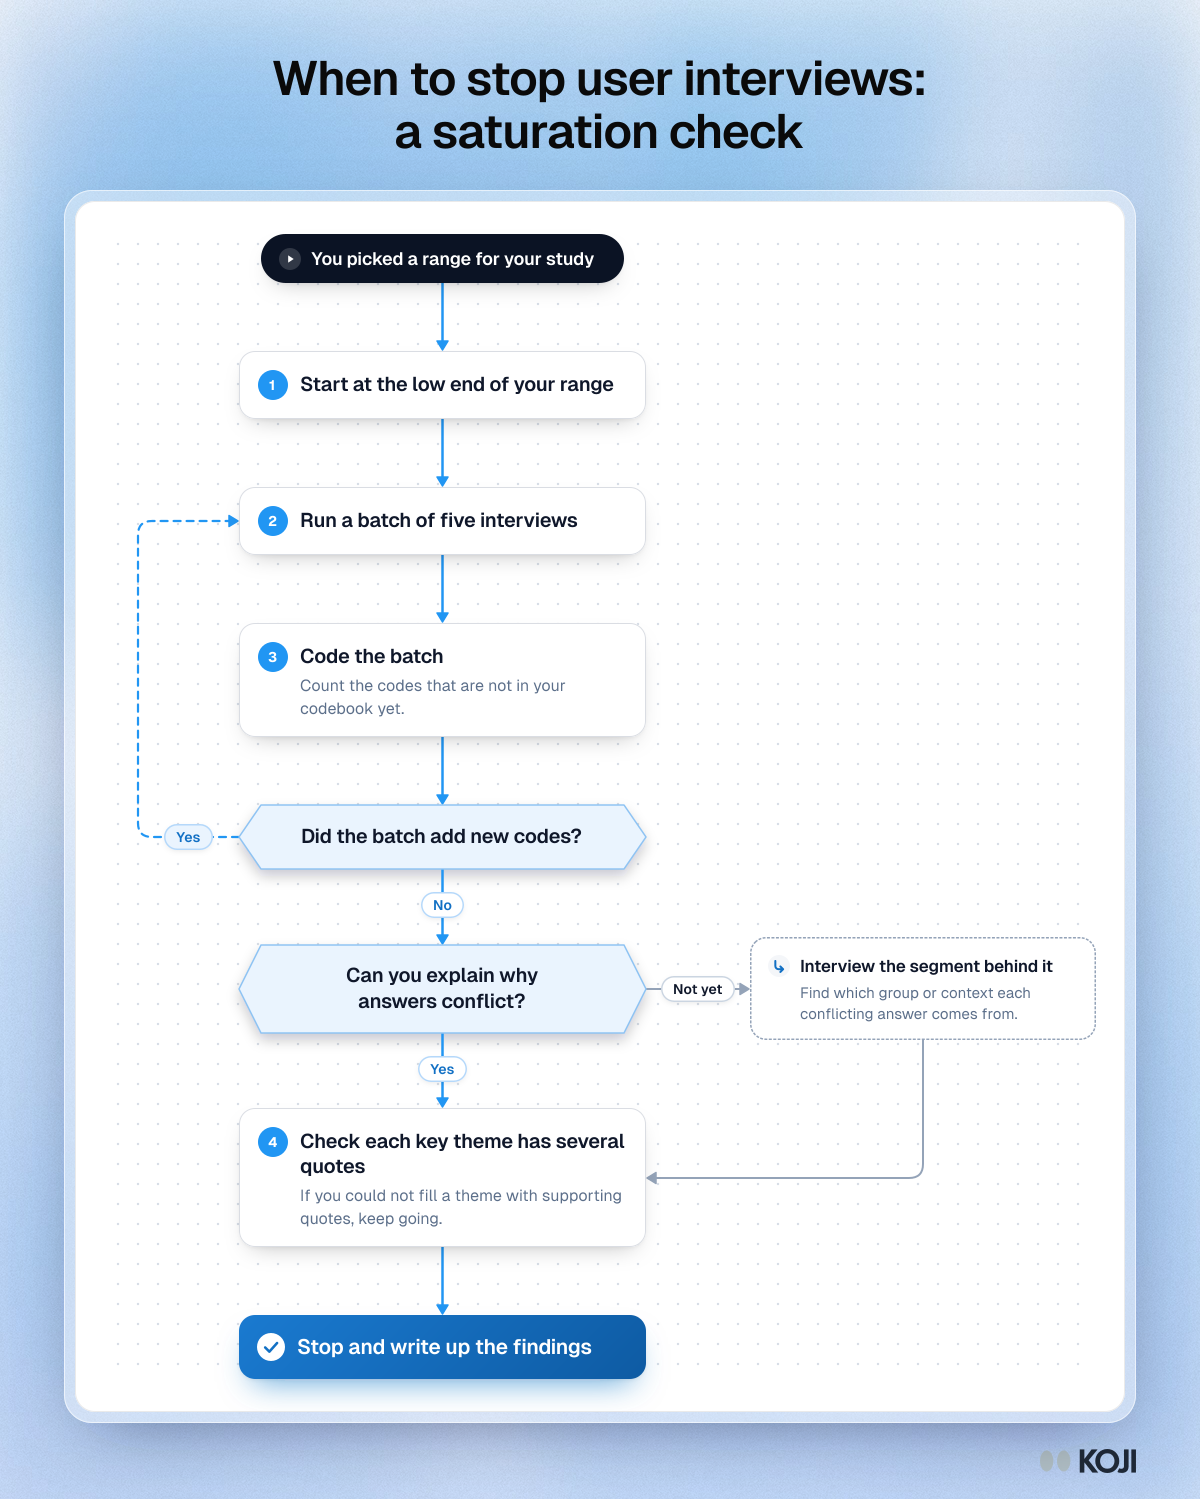
Flowchart for deciding when to stop user interviews: run batches of five, loop while new codes appear, explain conflicts, then write up.

Flowchart

When to stop user interviews: a saturation check
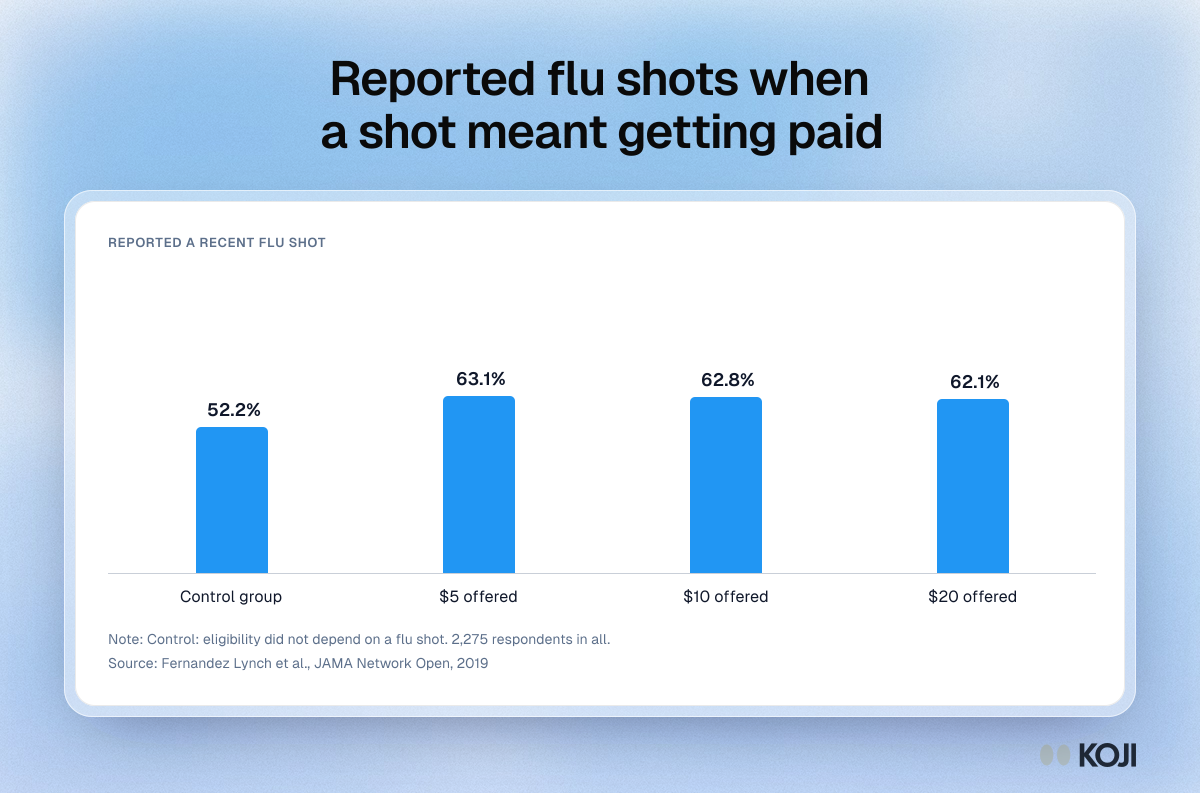
Column chart: 52.2% reported a recent flu shot when it made no difference, and about 62% to 63% when it made them eligible for pay.

Column chart

Reported flu shots when a shot meant getting paid
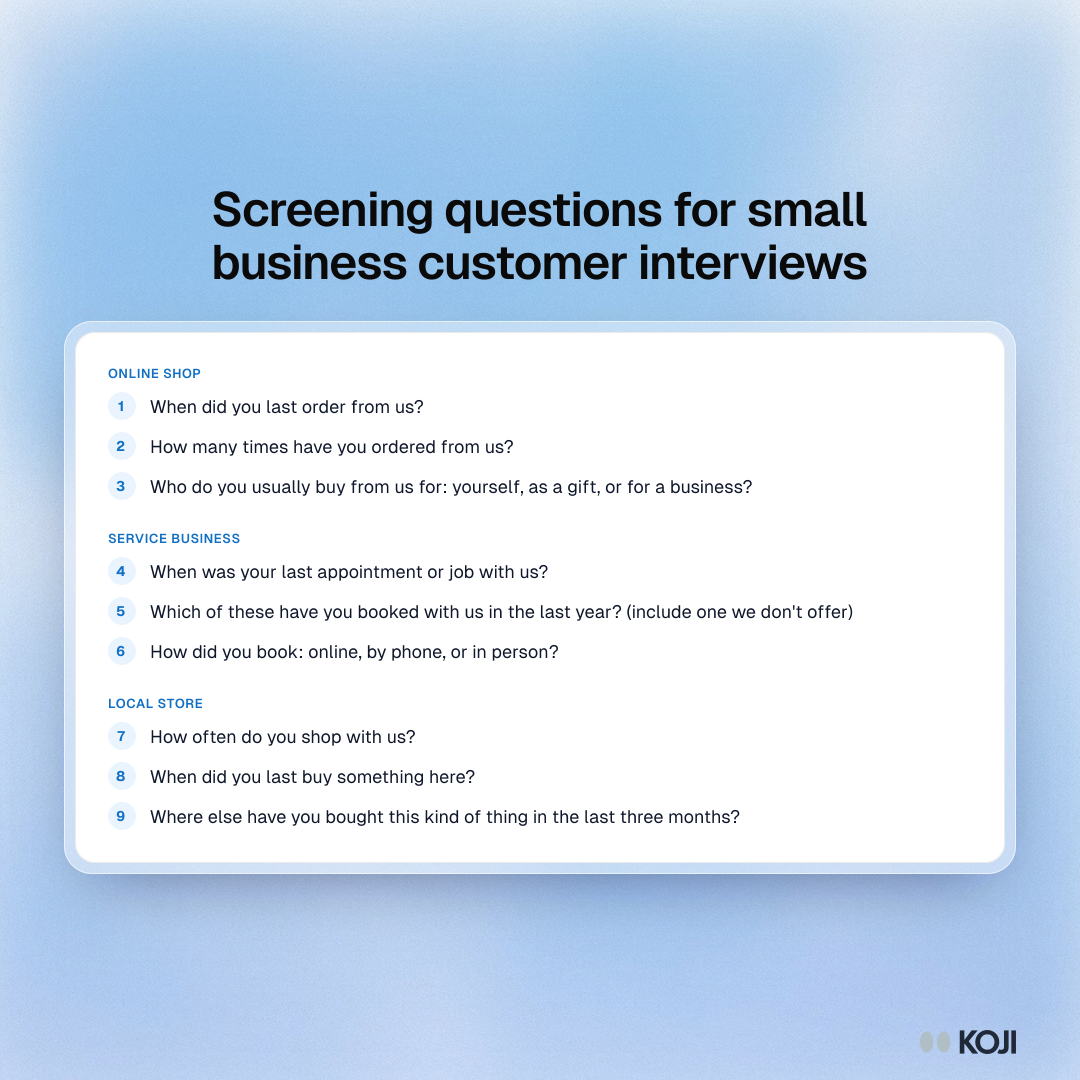
Question bank of screening questions for small business customer interviews, in sections for online shops, service businesses and local stores.

Question bank

Screening questions for small business customer interviews
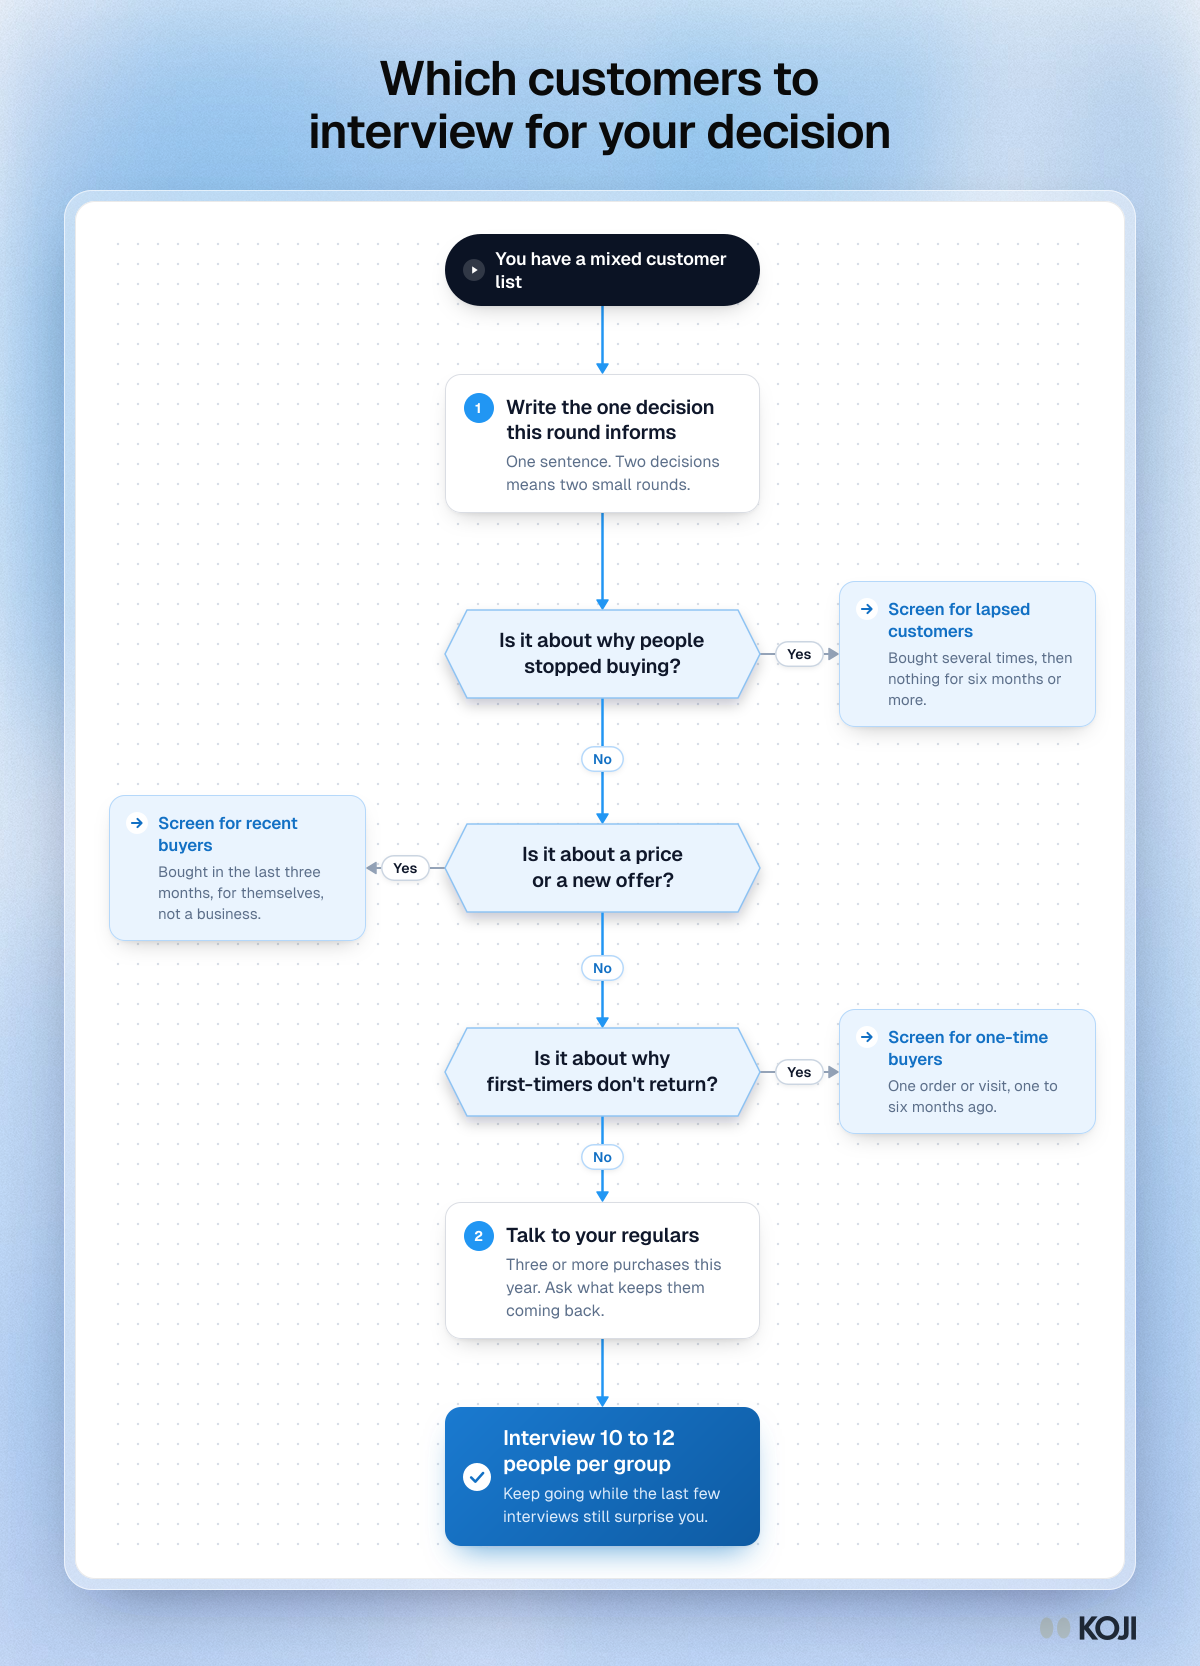
Flowchart for choosing which small business customers to interview: three yes or no questions lead to lapsed, recent or one-time buyers, otherwise regulars.

Flowchart

Which customers to interview for your decision
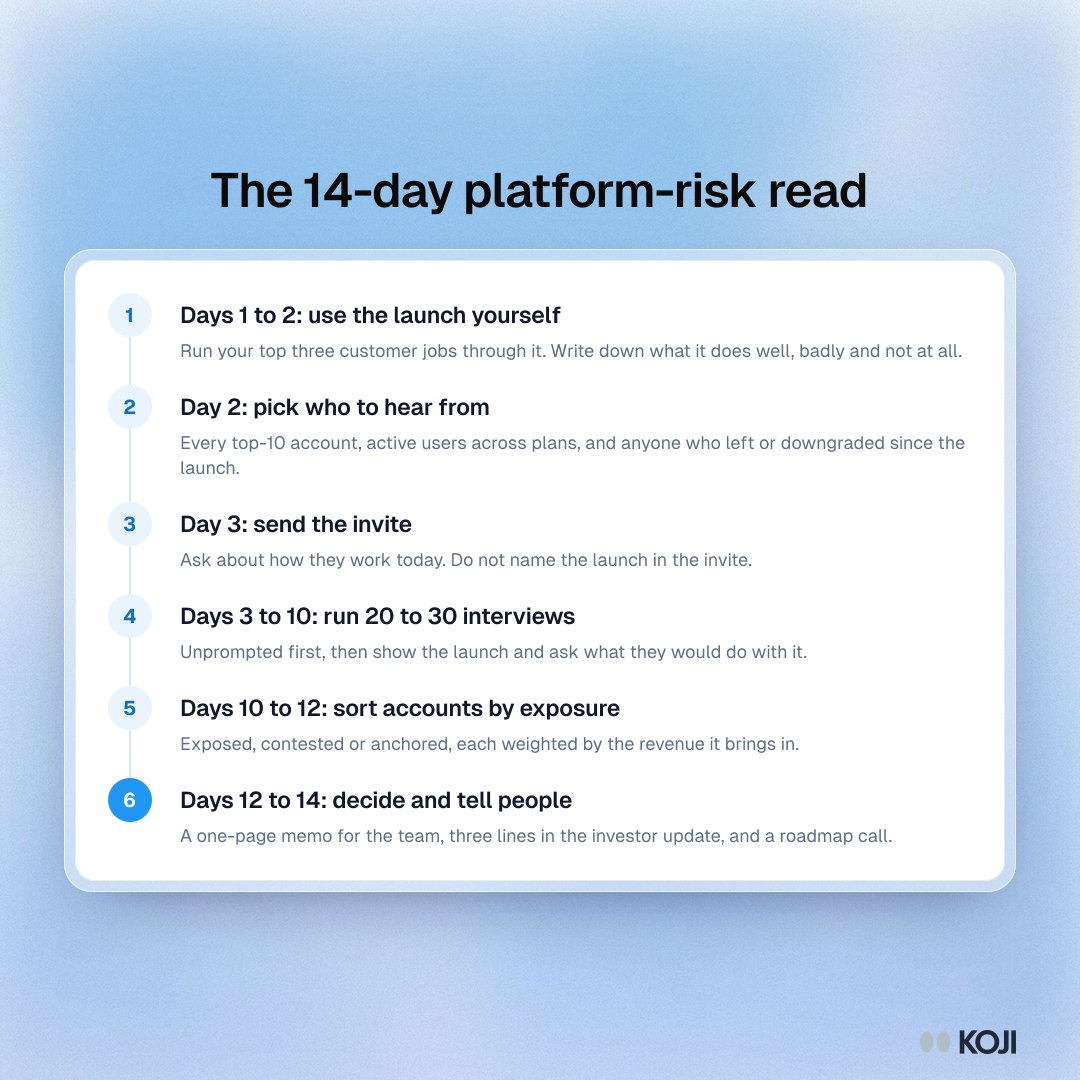
Process for a 14-day platform-risk read: use the launch, pick who to hear, invite, run 20 to 30 interviews, sort by exposure, decide

Process

The 14-day platform-risk read
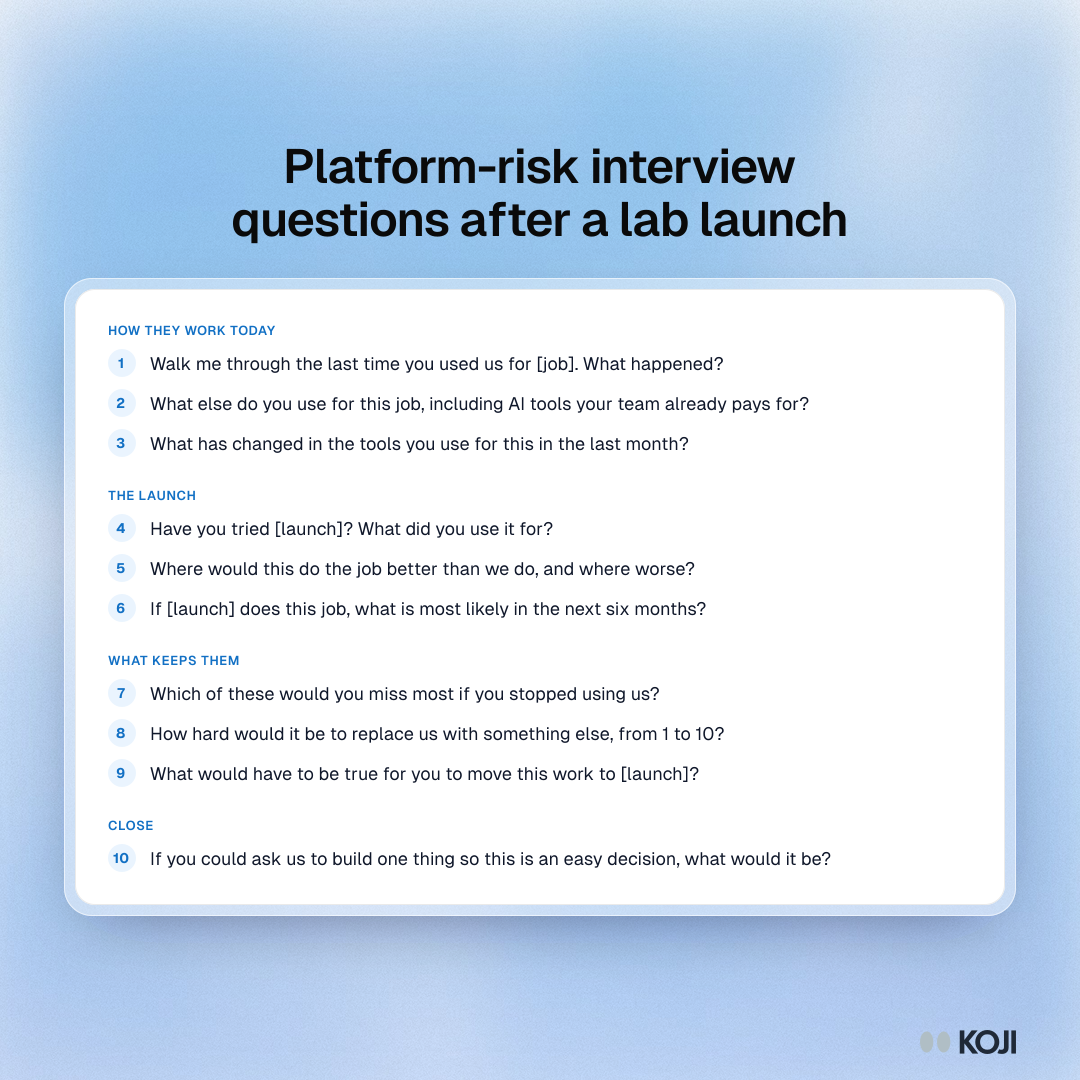
Question bank for platform-risk interviews after a frontier-lab launch, grouped into how they work today, the launch, and what keeps them

Question bank

Platform-risk interview questions after a lab launch
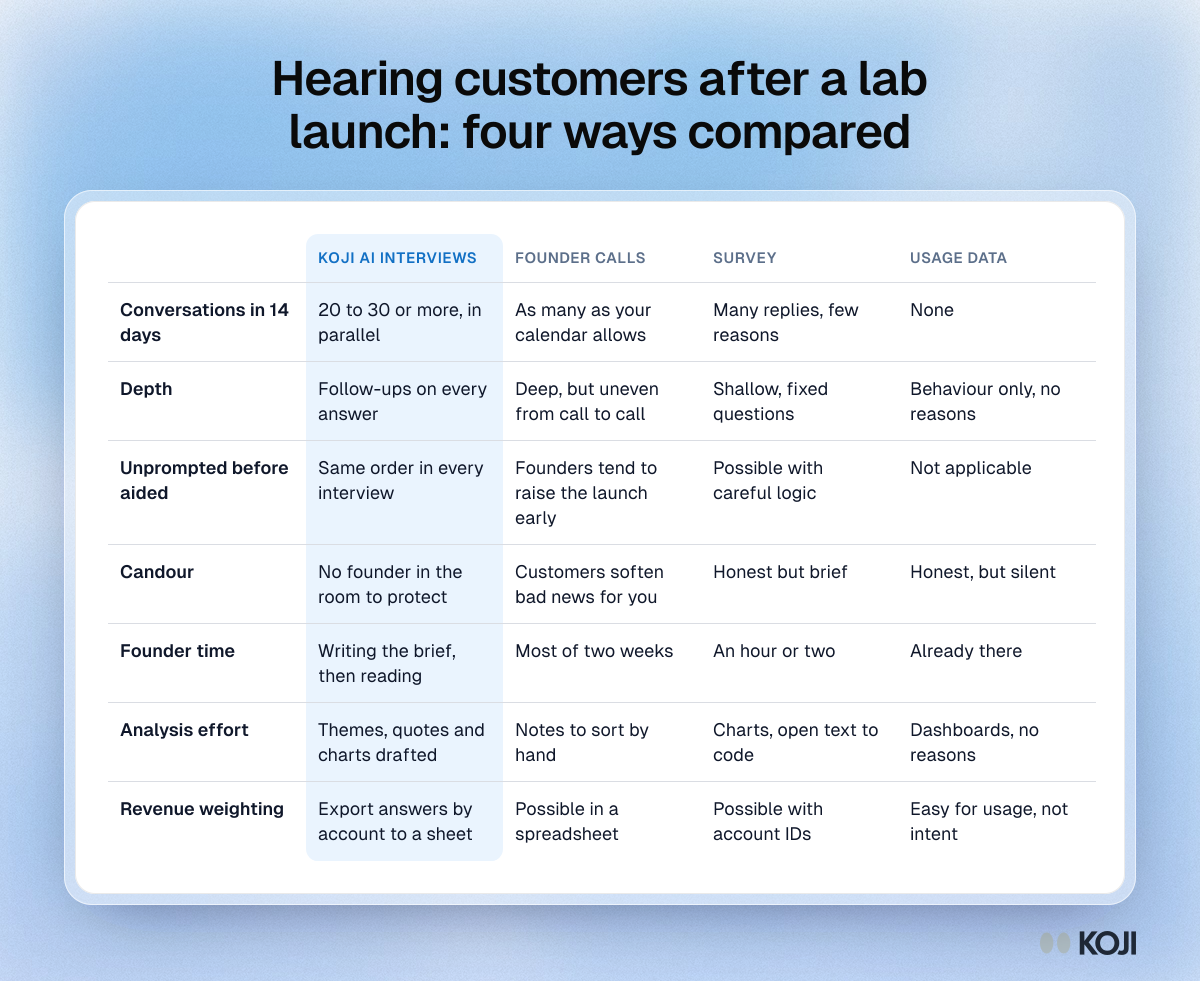
Table comparing Koji AI interviews, founder calls, surveys and usage data for hearing customers in the 14 days after a lab launch

Reference table

Hearing customers after a lab launch: four ways compared
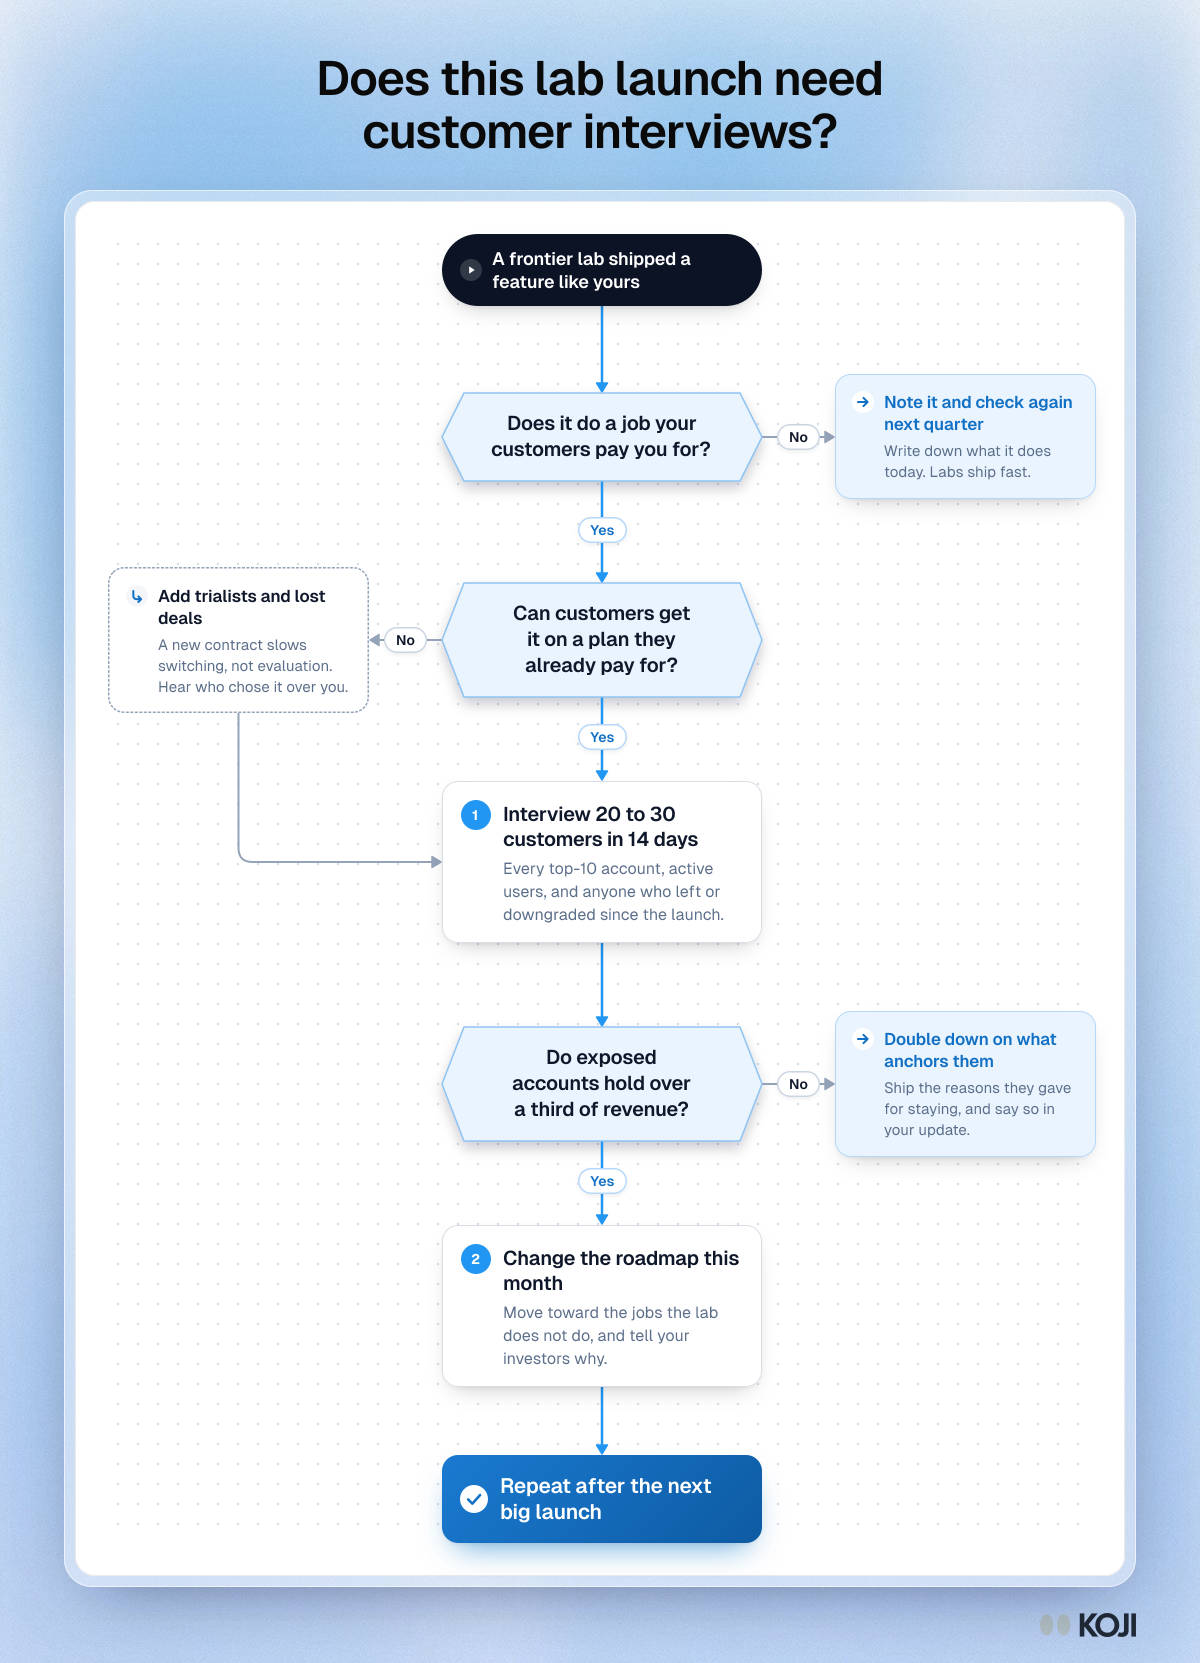
Flowchart for deciding if a lab launch needs customer interviews: two overlap questions, 20 to 30 interviews, then a revenue check

Flowchart

Does this lab launch need customer interviews?
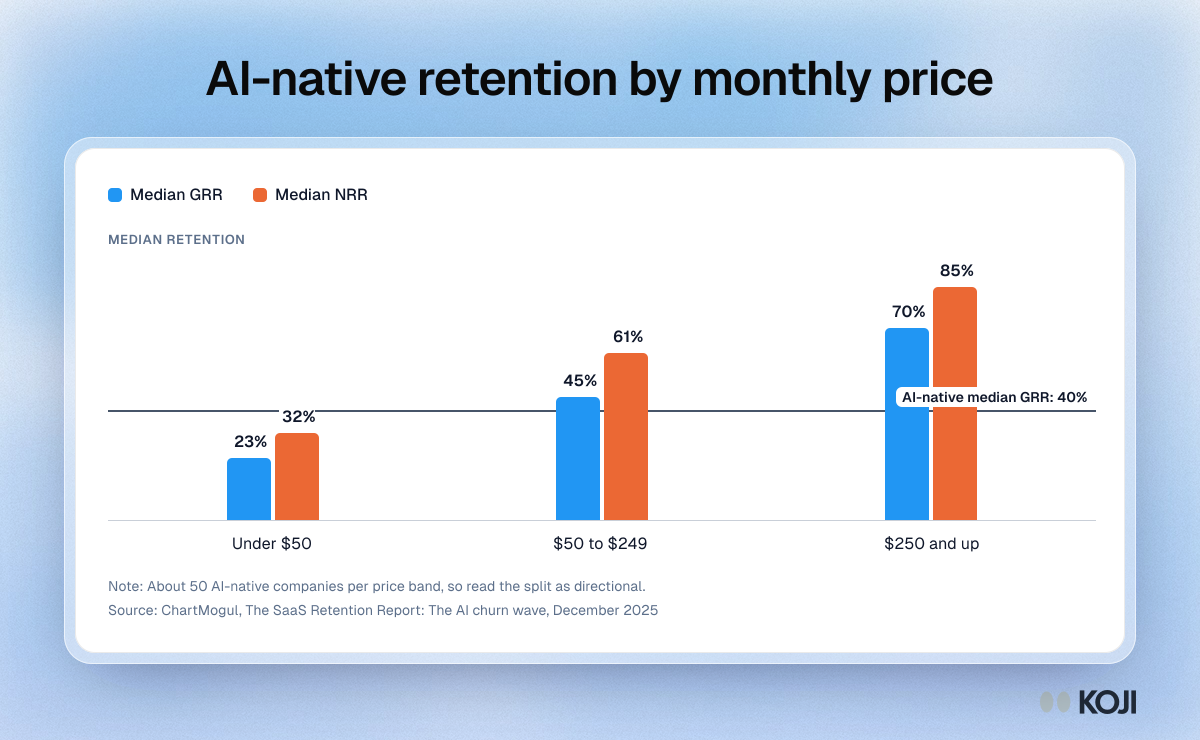
Column chart of AI-native median retention by monthly price: GRR of 23% under $50, 45% at $50 to $249 and 70% at $250 and up

Column chart

AI-native retention by monthly price
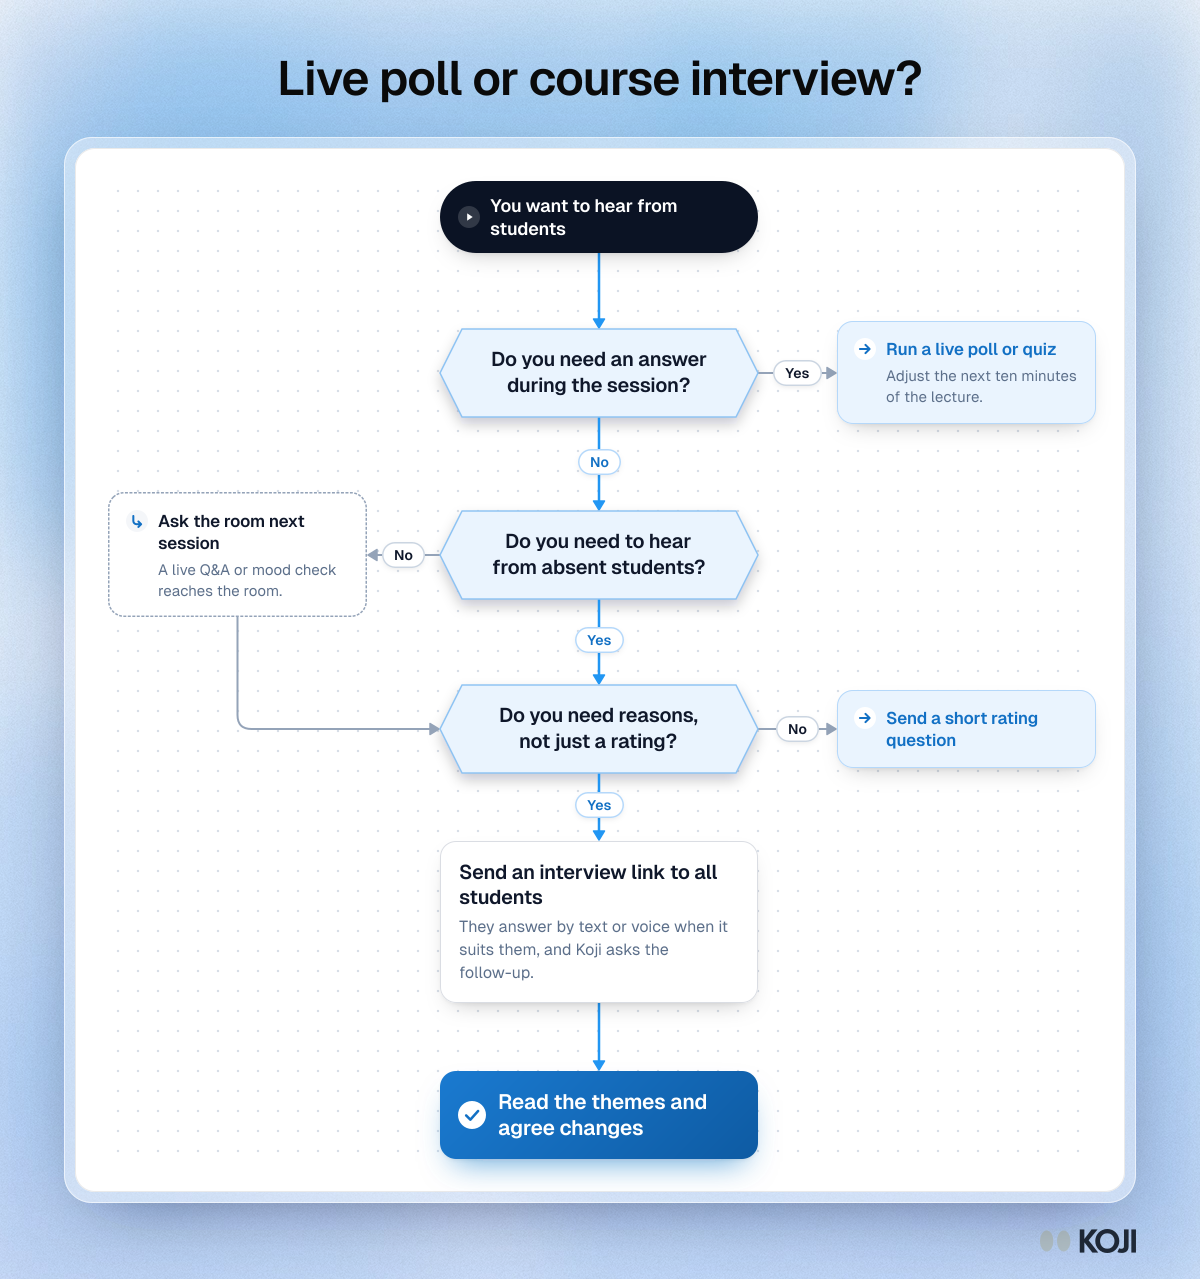
Flowchart for choosing between a live poll and a course interview: three questions, one side step, ending in reading the themes and agreeing changes.

Flowchart

Live poll or course interview?
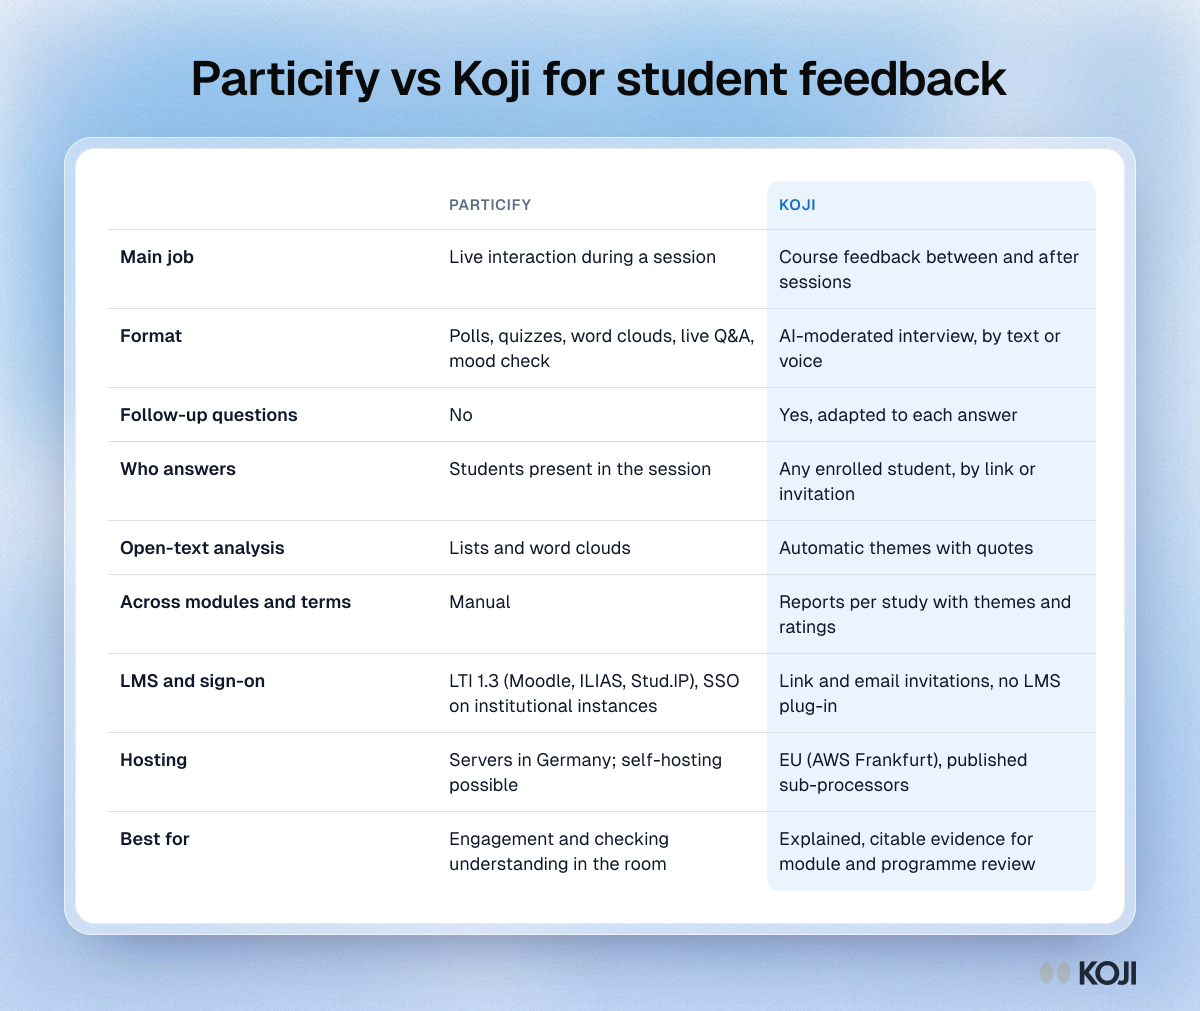
Comparison table of Particify and Koji: main job, format, follow-up questions, who answers, analysis, LMS integration, hosting and best fit.

Reference table

Particify vs Koji for student feedback
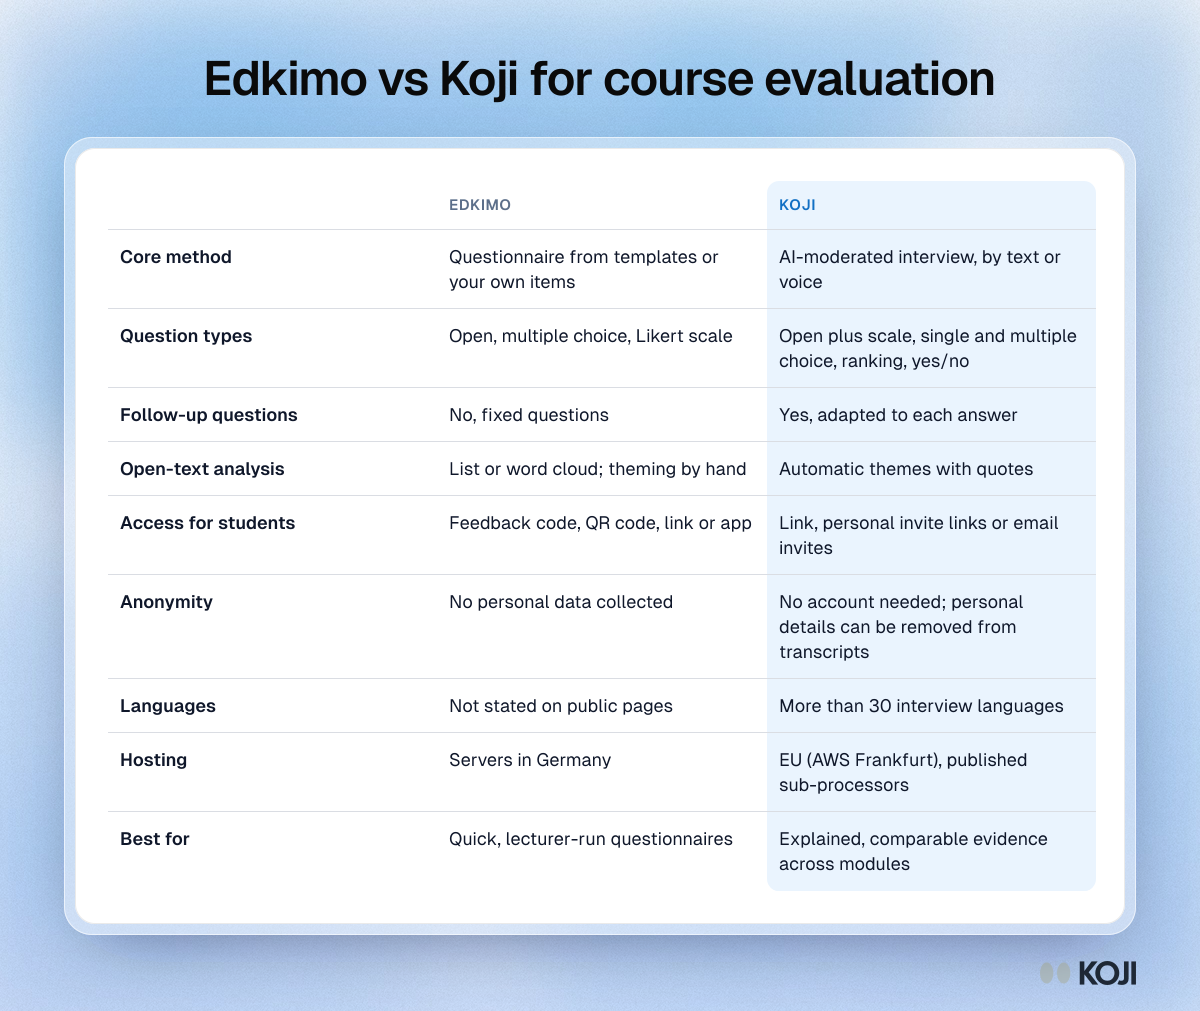
Comparison table of Edkimo and Koji for course evaluation, covering method, follow-up questions, open-text analysis, access, hosting and best fit.

Reference table

Edkimo vs Koji for course evaluation
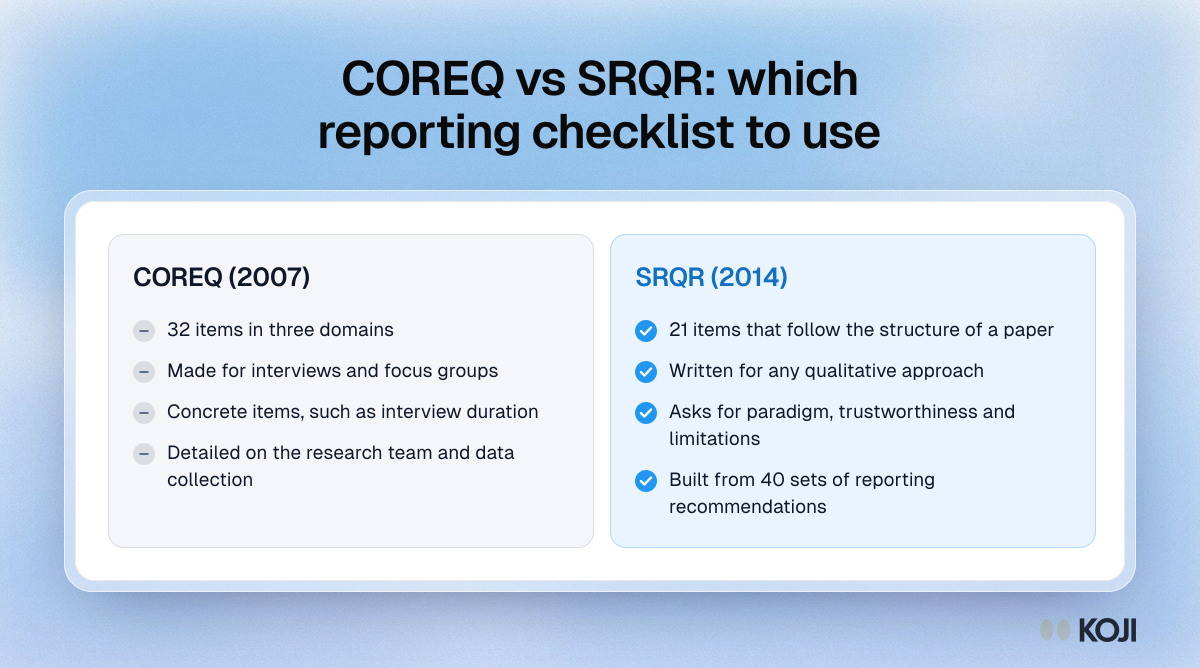
Comparison of COREQ and SRQR: 32 items for interviews and focus groups versus 21 items for any qualitative approach.

Comparison

COREQ vs SRQR: which reporting checklist to use
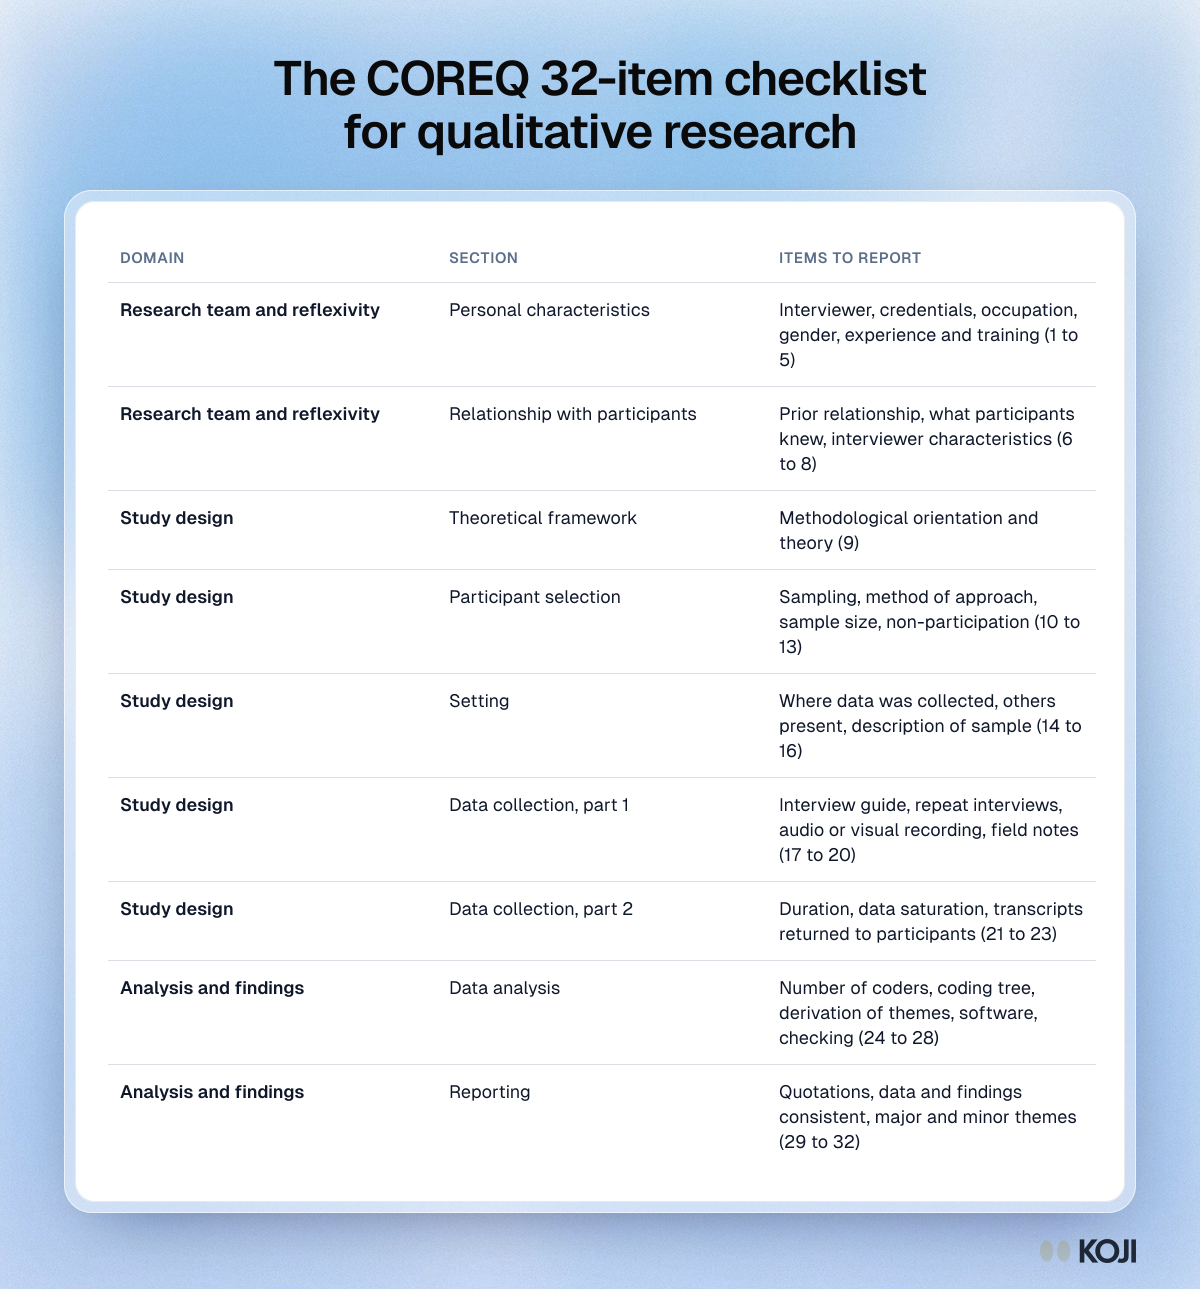
Table of the 32 COREQ items grouped into three domains: research team and reflexivity, study design, and analysis and findings.

Reference table

The COREQ 32-item checklist for qualitative research
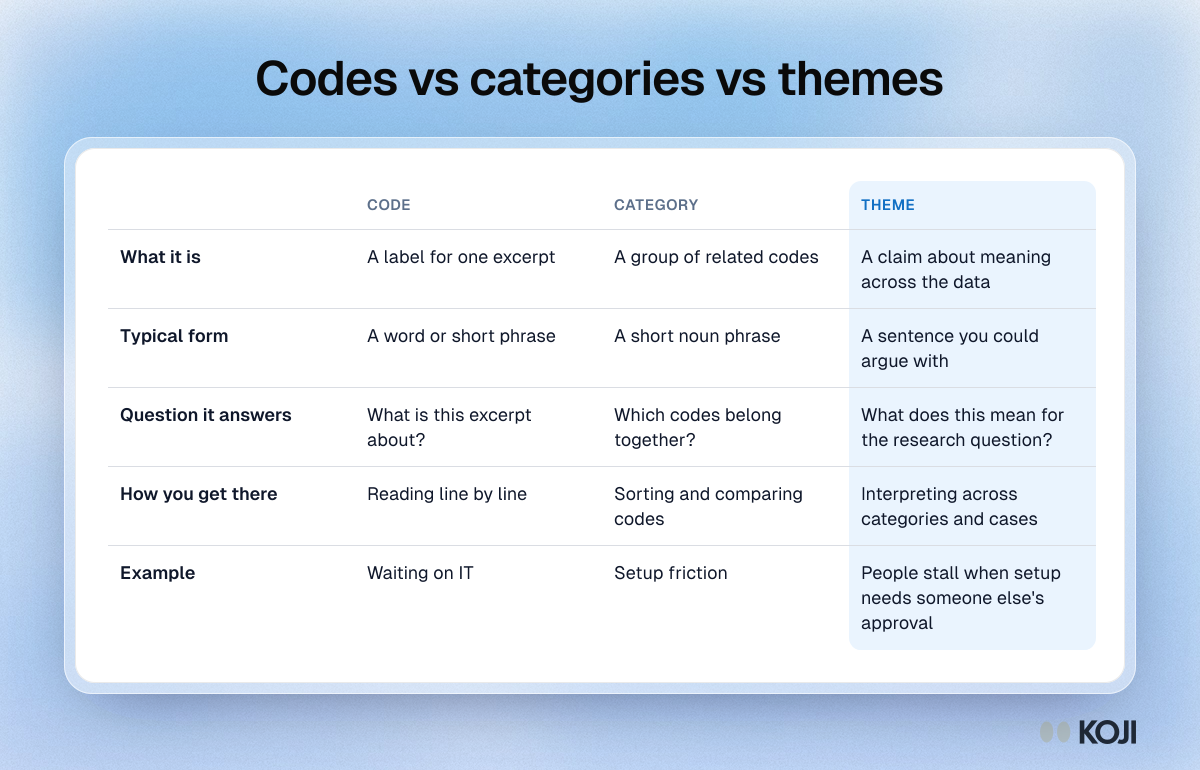
Table comparing codes, categories and themes by what each is, its typical form, the question it answers, how you get there and an example.

Reference table

Codes vs categories vs themes
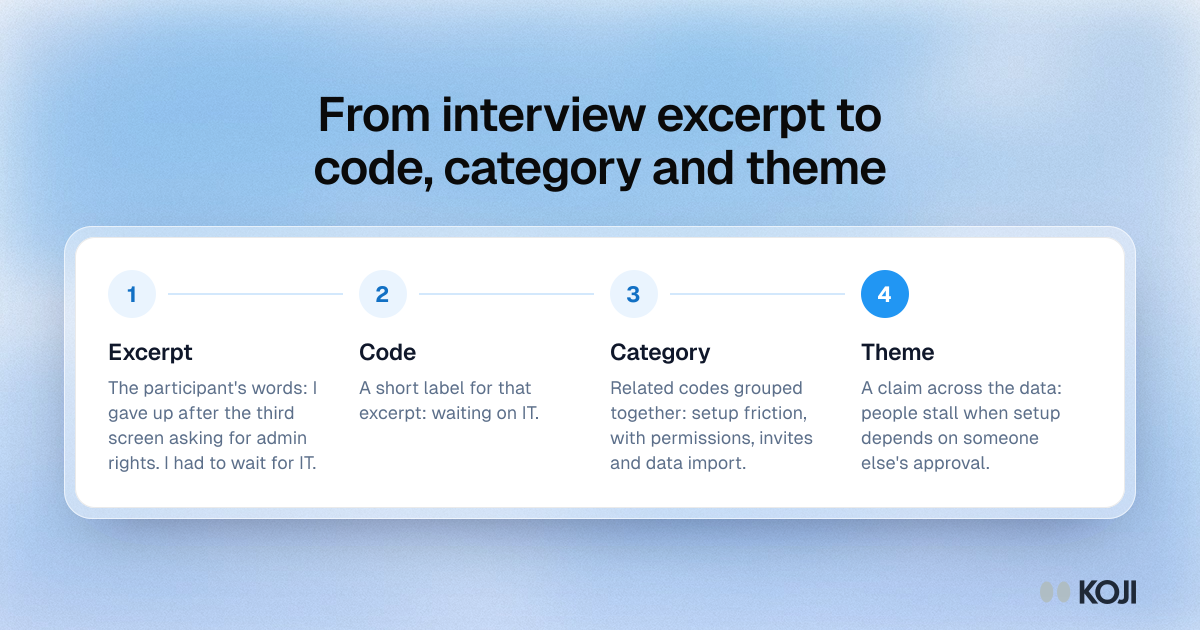
Process showing one interview excerpt becoming a code, then a category, then a theme about stalling when setup needs approval.

Process

From interview excerpt to code, category and theme
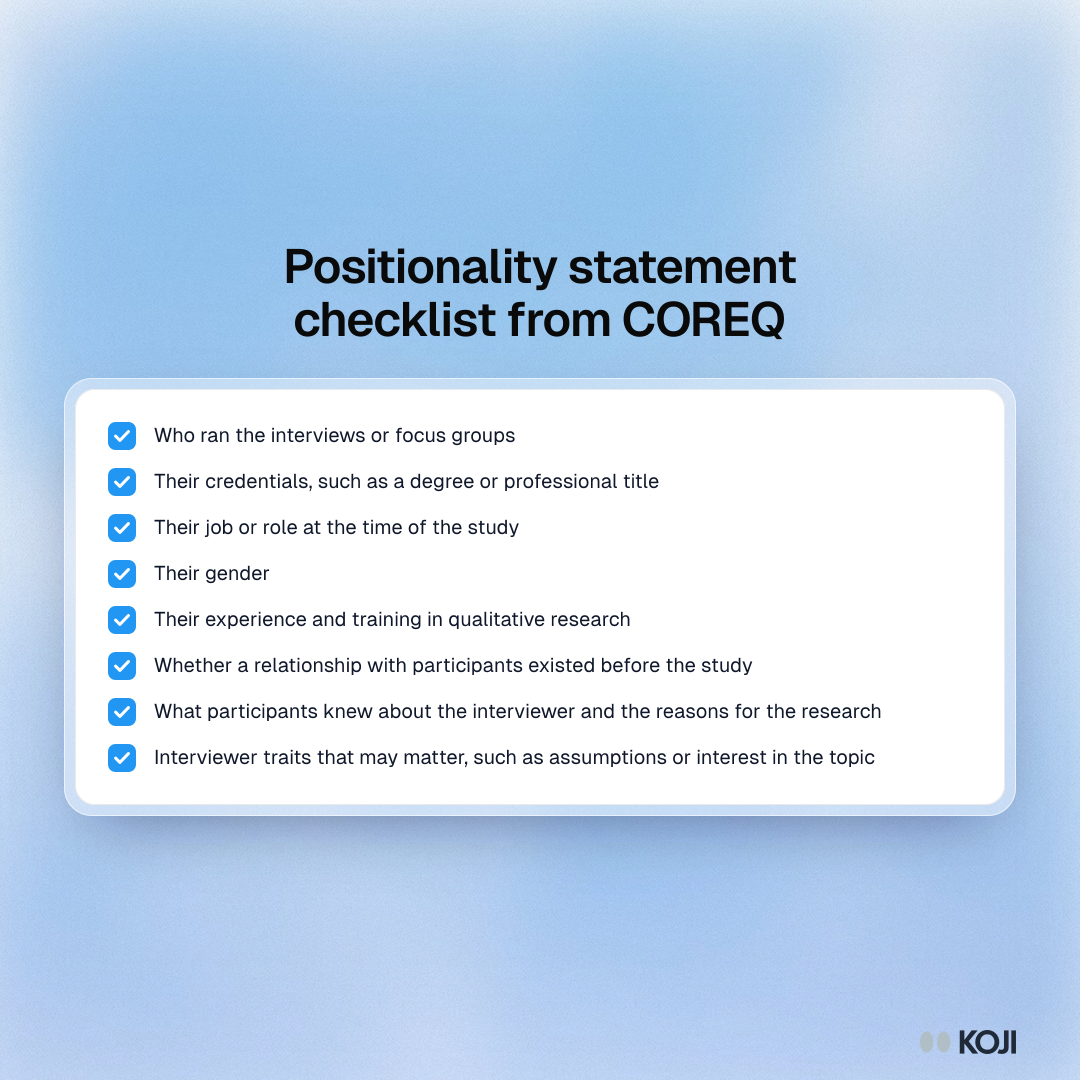
Checklist of eight items to cover in a positionality statement, from who ran the interviews to what participants knew about the interviewer.

Checklist

Positionality statement checklist from COREQ
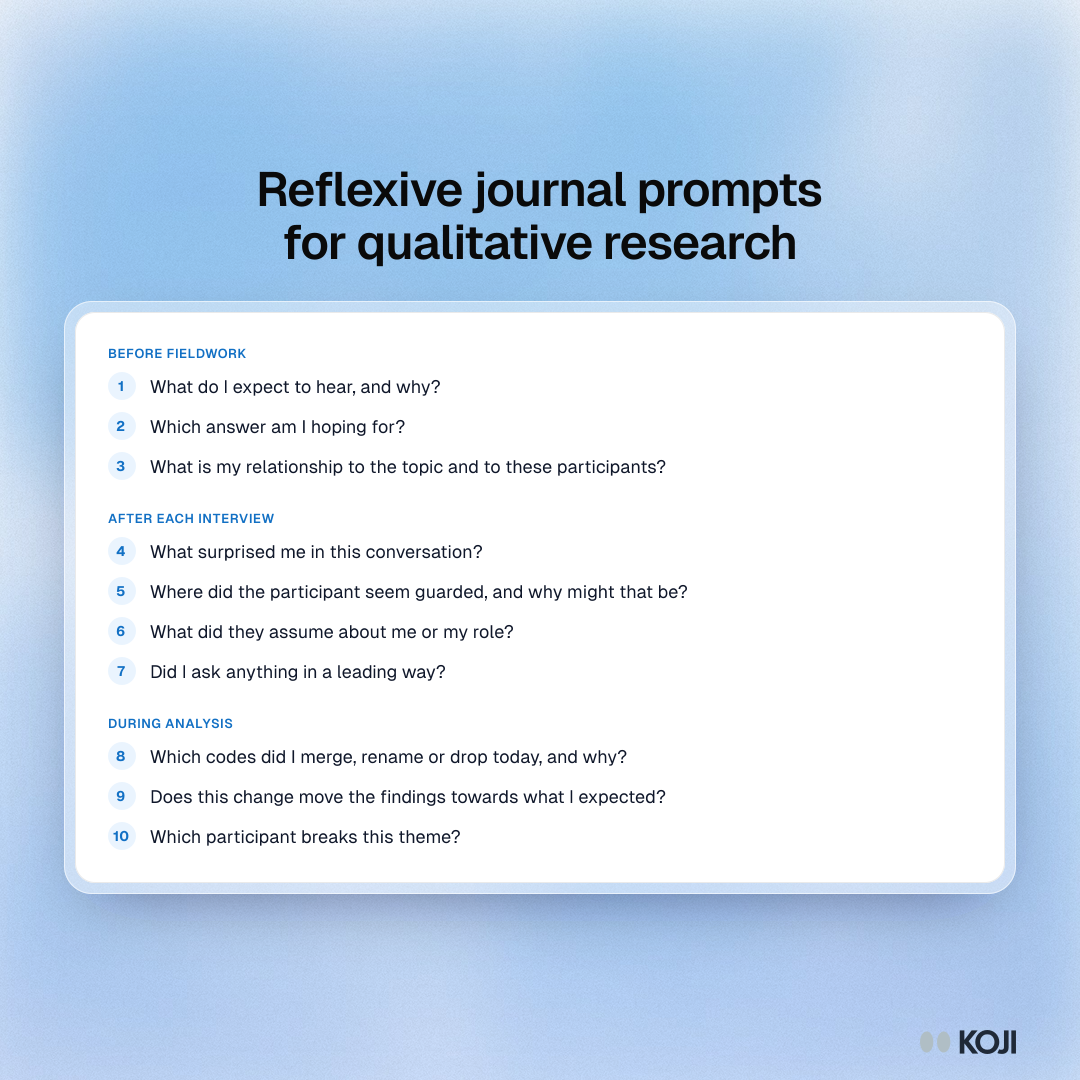
Question bank of ten reflexive journal prompts in three sections: before fieldwork, after each interview and during analysis.

Question bank

Reflexive journal prompts for qualitative research
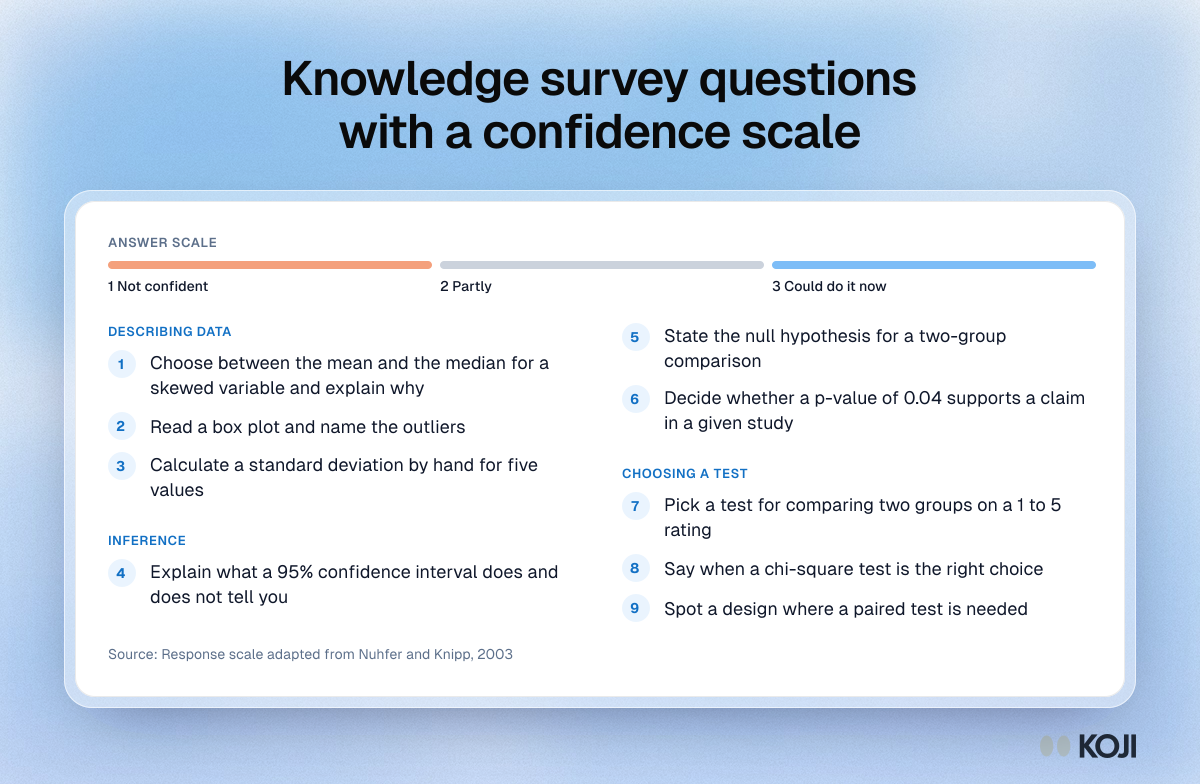
Question bank of nine knowledge survey items for an introductory statistics course, in three sections, rated on a three-point confidence scale.

Question bank

Knowledge survey questions with a confidence scale
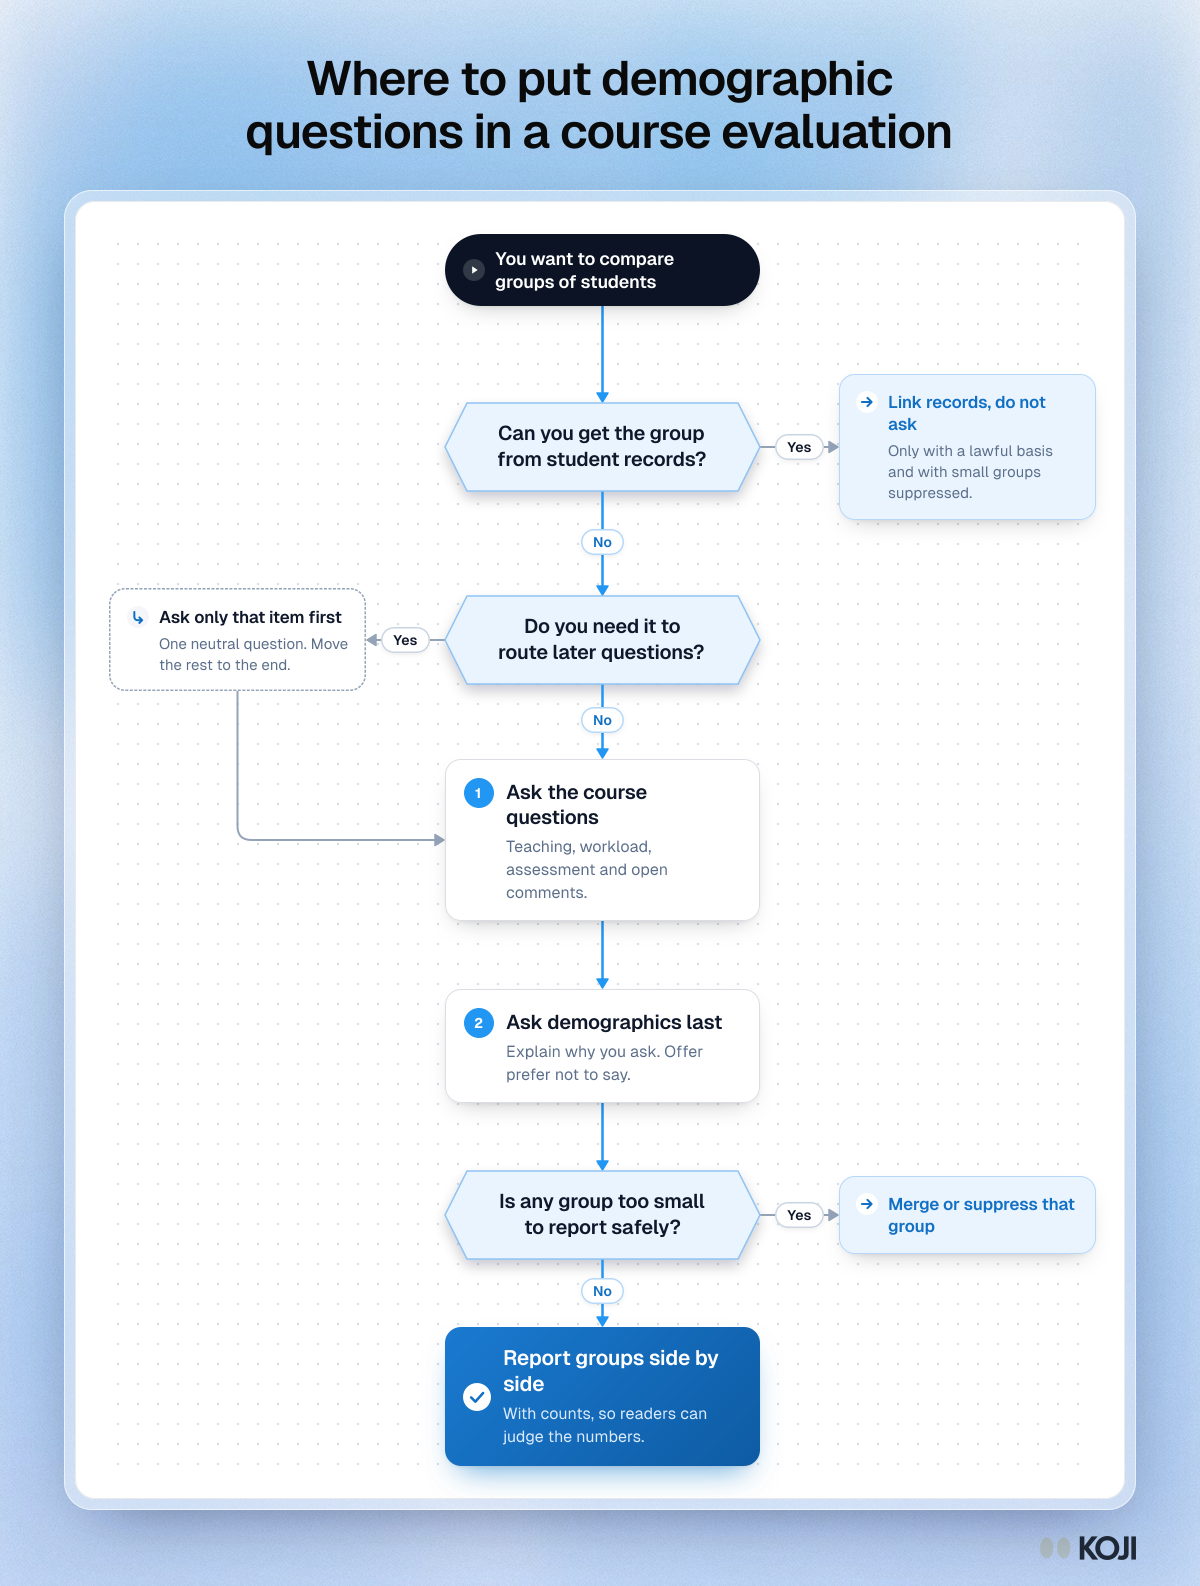
Flowchart for placing demographic questions: use records where you can, ask only what routing needs at the start, and put the rest at the end.

Flowchart

Where to put demographic questions in a course evaluation
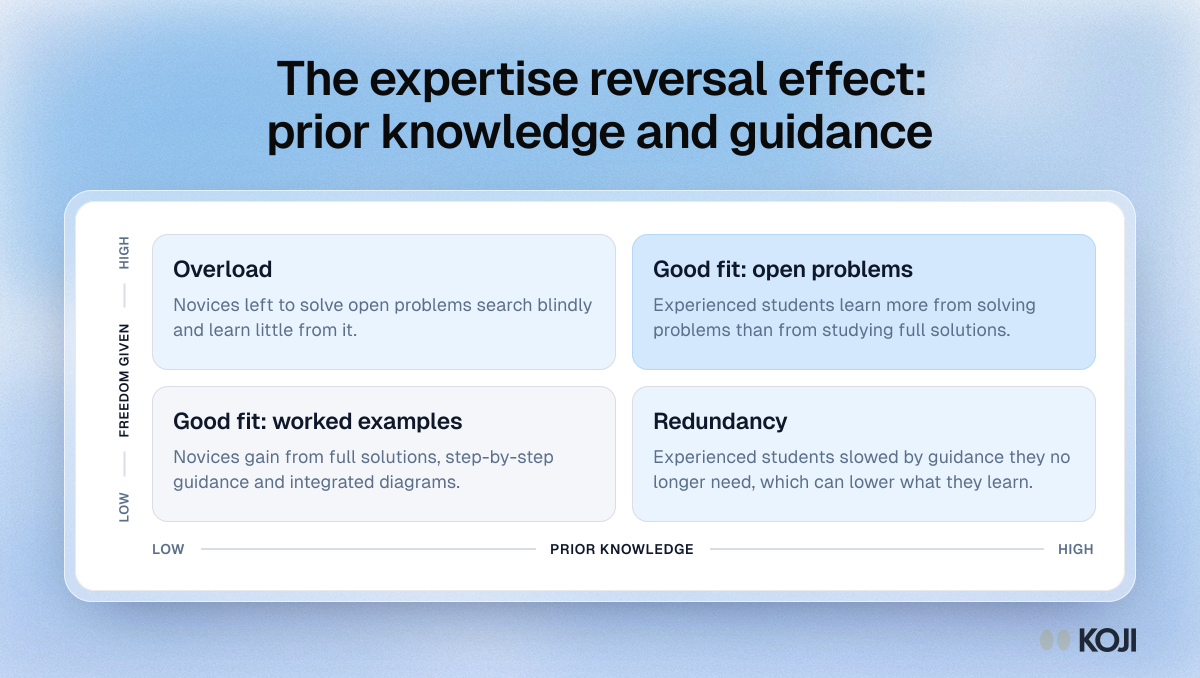
Matrix of prior knowledge against freedom given: full guidance suits novices, open problems suit experienced students, mismatches cause overload or redundancy.

Matrix

The expertise reversal effect: prior knowledge and guidance
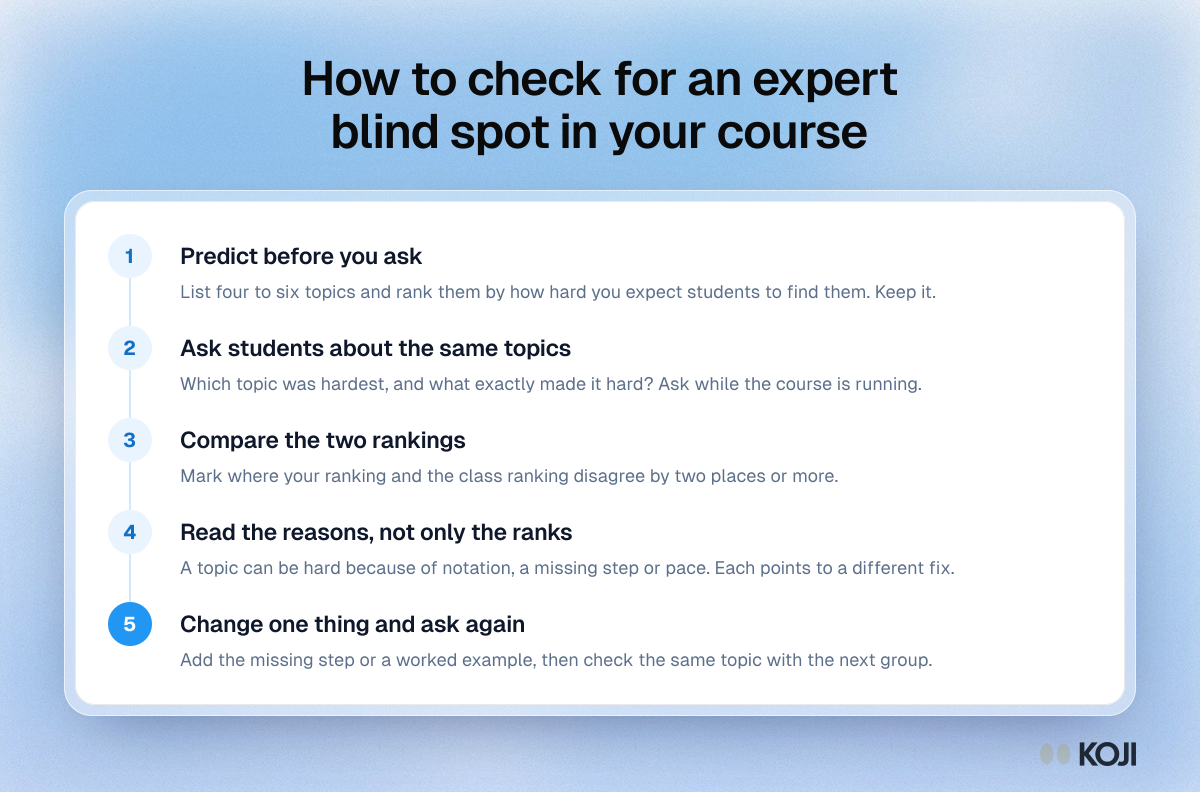
Process in five steps for checking an expert blind spot: predict difficulty, ask students, compare, look at the gaps, change one thing.

Process

How to check for an expert blind spot in your course
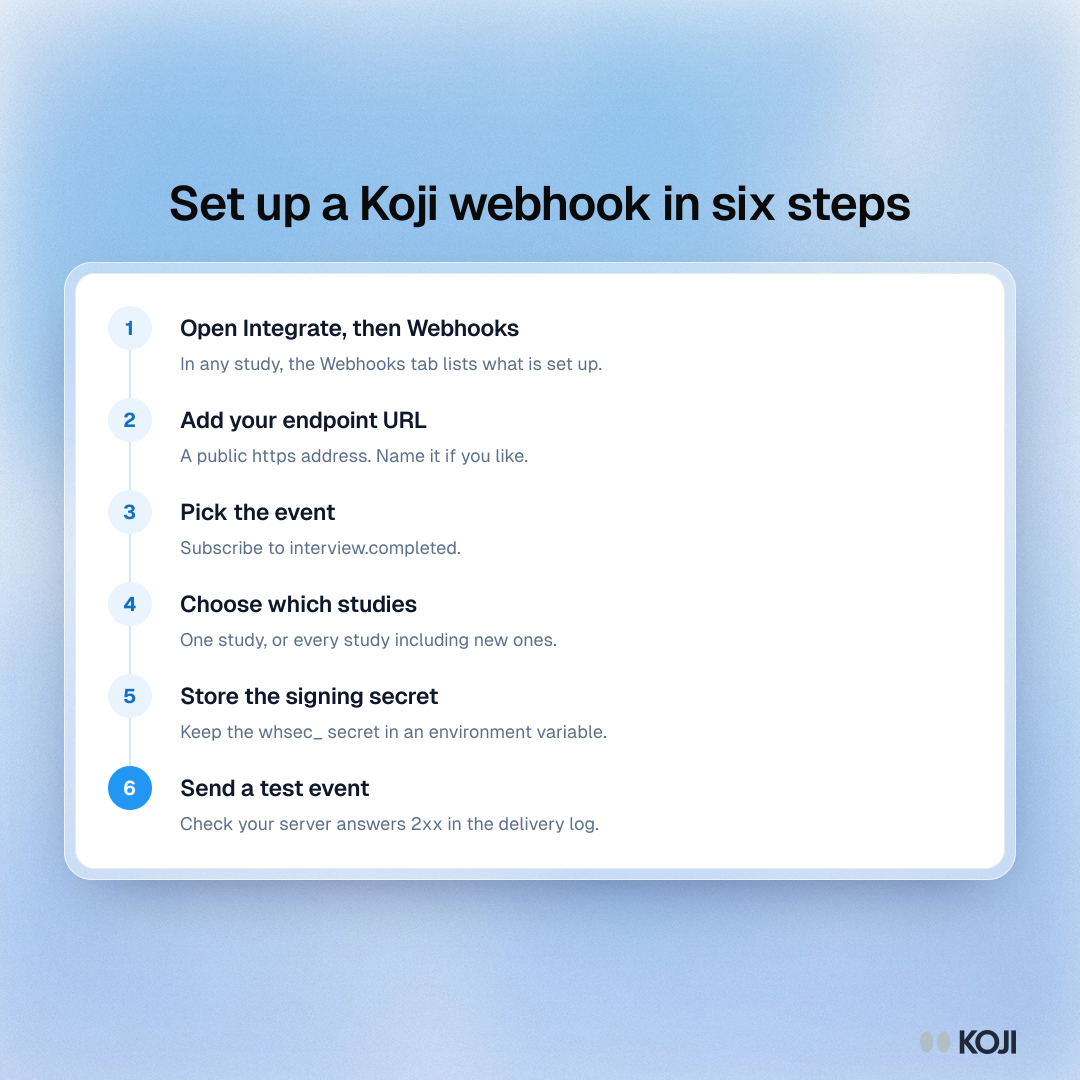
Process showing six steps to set up a Koji webhook, from opening Integrate to sending a test event and watching the delivery log.

Process

Set up a Koji webhook in six steps
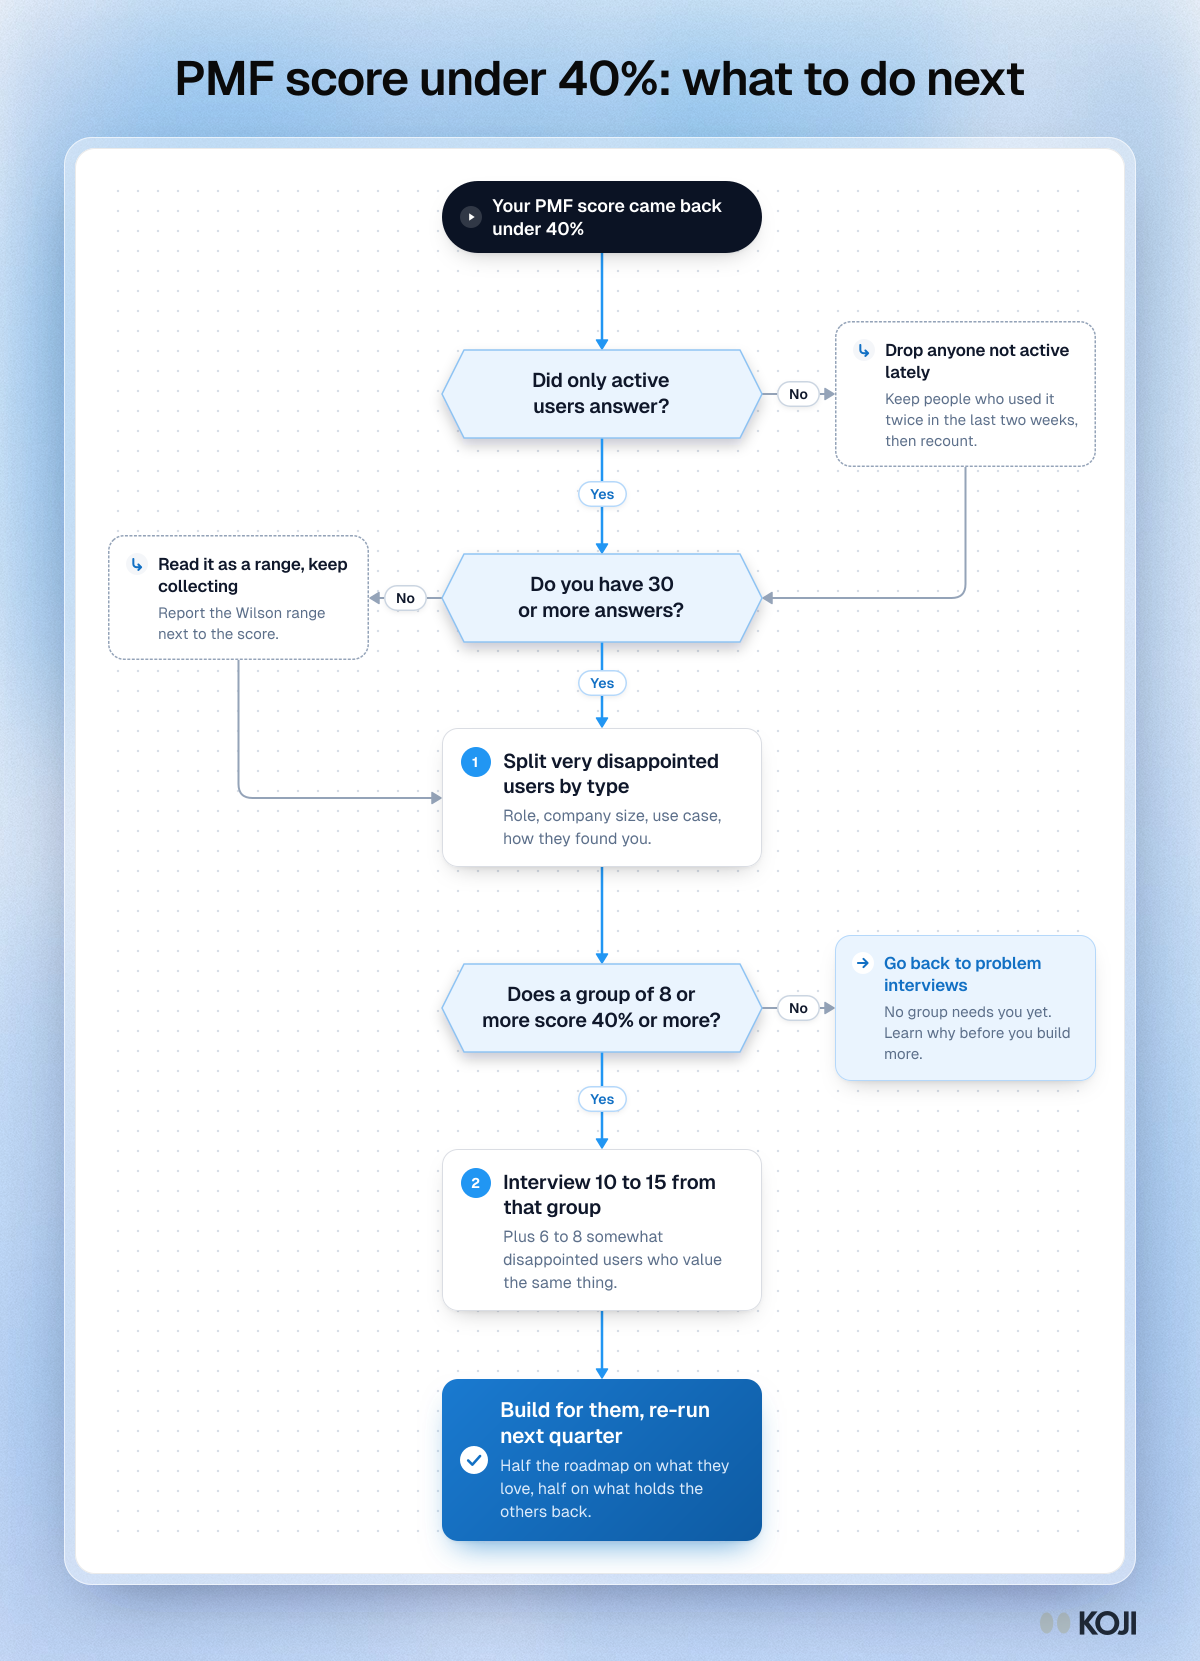
Flowchart for a PMF score under 40%: check active users and answer count, split by type, then build for a 40% group or go back to problem interviews.

Flowchart

PMF score under 40%: what to do next
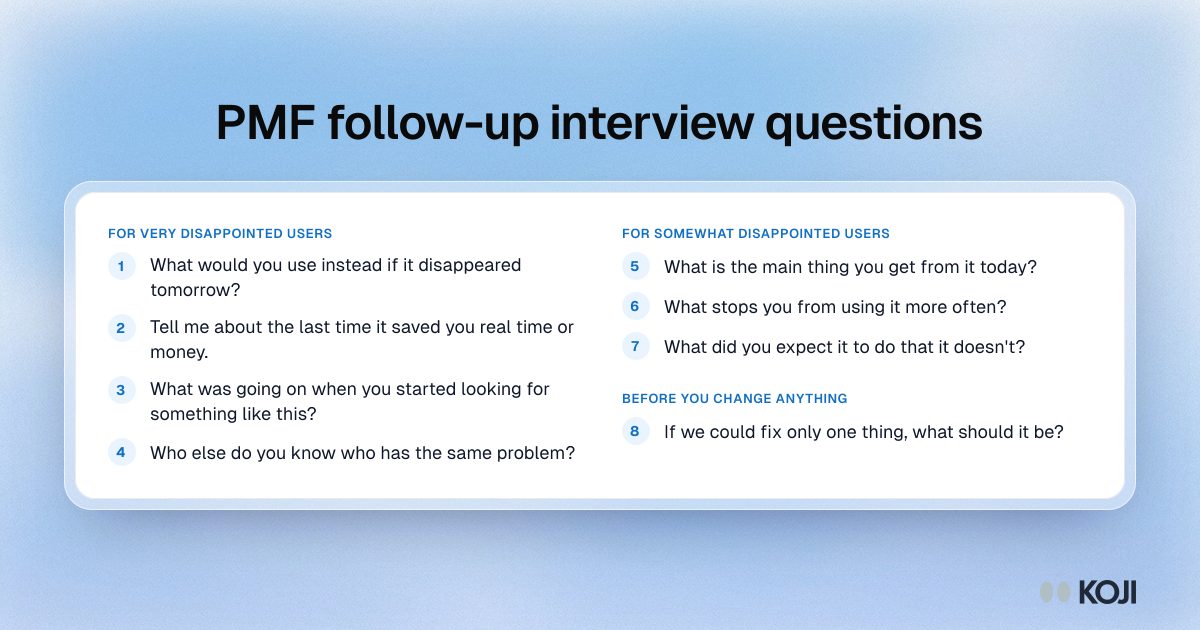
Question bank of eight PMF follow-up questions for very disappointed users, somewhat disappointed users and before you change anything.

Question bank

PMF follow-up interview questions
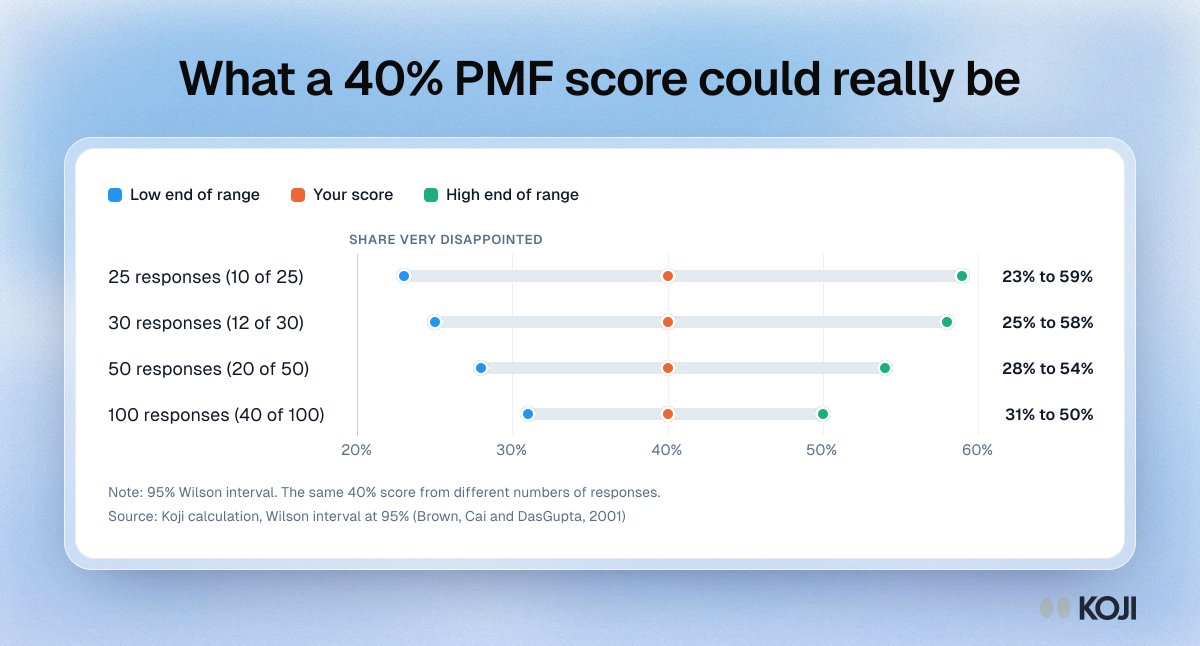
Range chart of the 95% Wilson interval around a 40% PMF score: 23% to 59% at 25 responses, 25% to 58% at 30, 28% to 54% at 50 and 31% to 50% at 100.

Benchmark range

What a 40% PMF score could really be
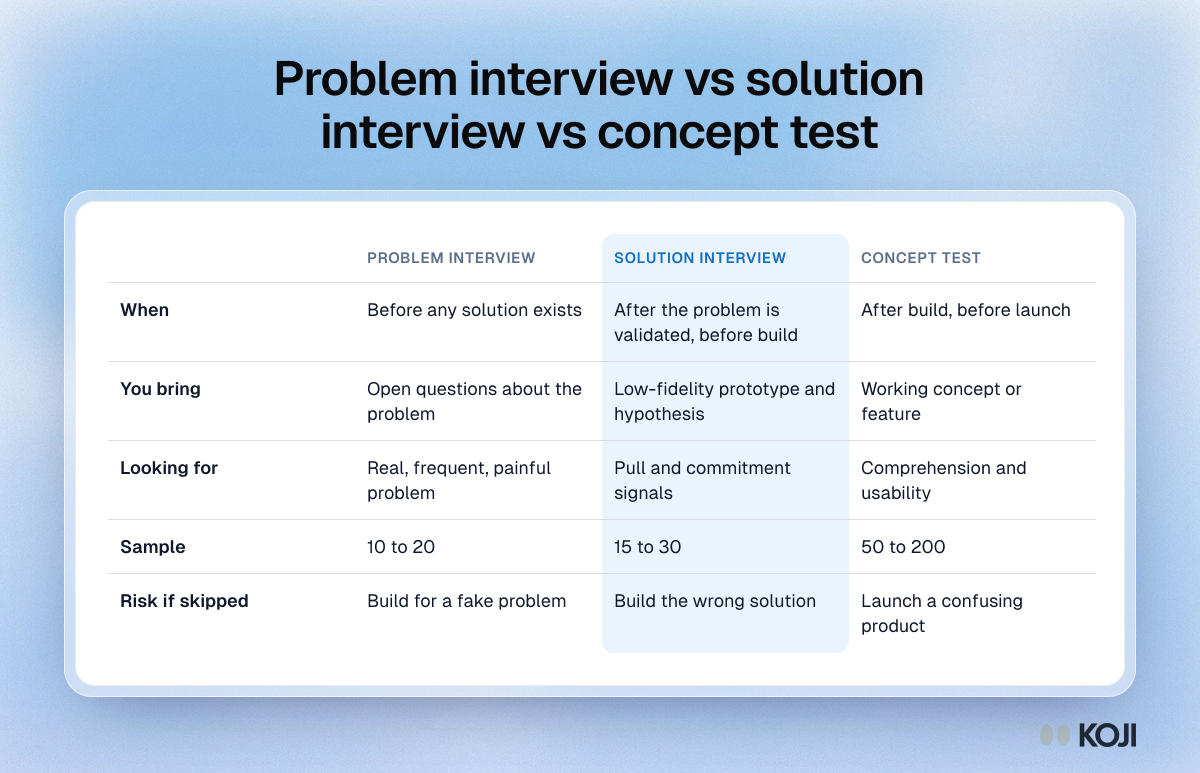
Table comparing problem interviews, solution interviews and concept tests by timing, what you bring, what you look for, sample size and risk if skipped.

Reference table

Problem interview vs solution interview vs concept test
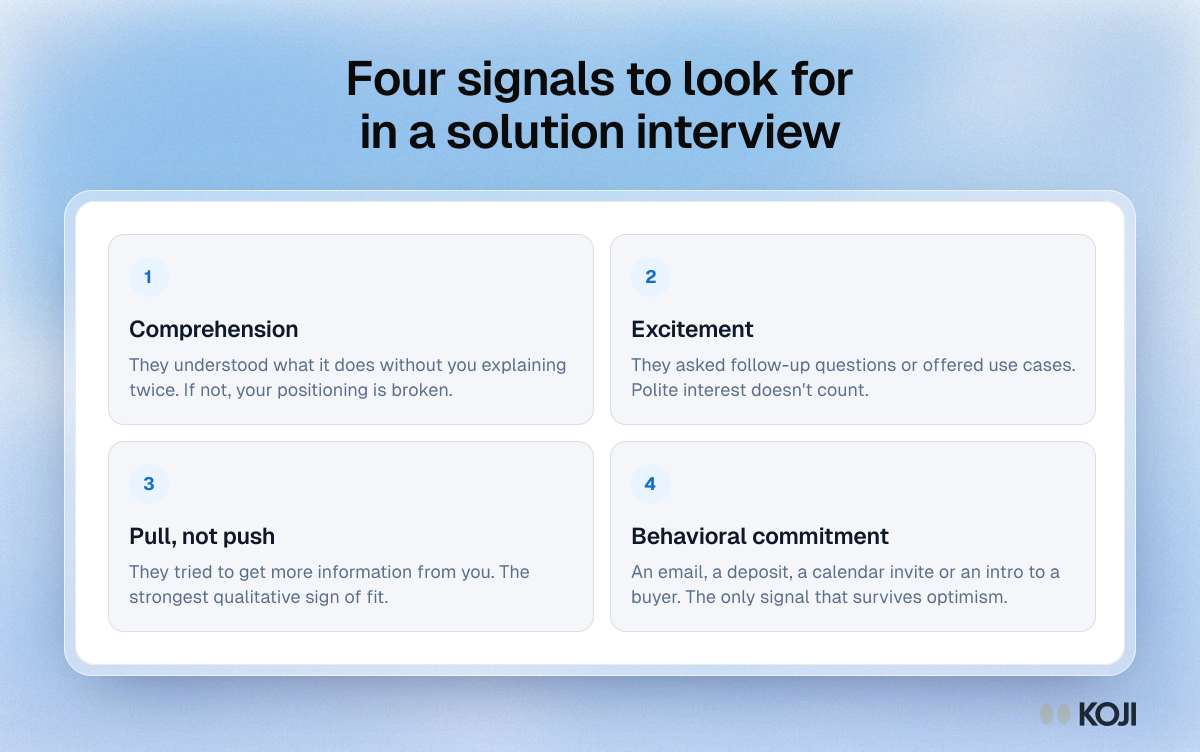
Framework of four solution interview signals in rising order of value: comprehension, excitement, pull rather than push, and behavioral commitment.

Framework

Four signals to look for in a solution interview
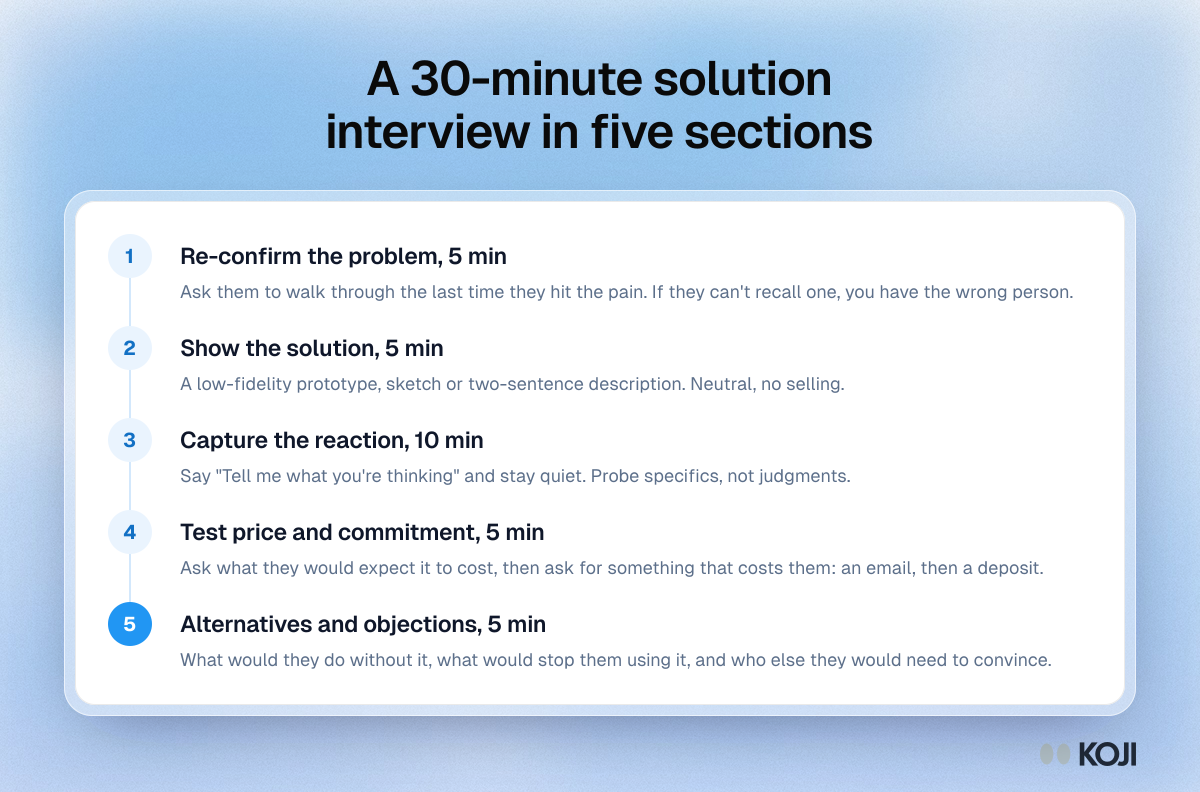
Process showing a 30-minute solution interview in five timed sections: re-confirm the problem, show the solution, reaction, commitment and objections.

Process

A 30-minute solution interview in five sections
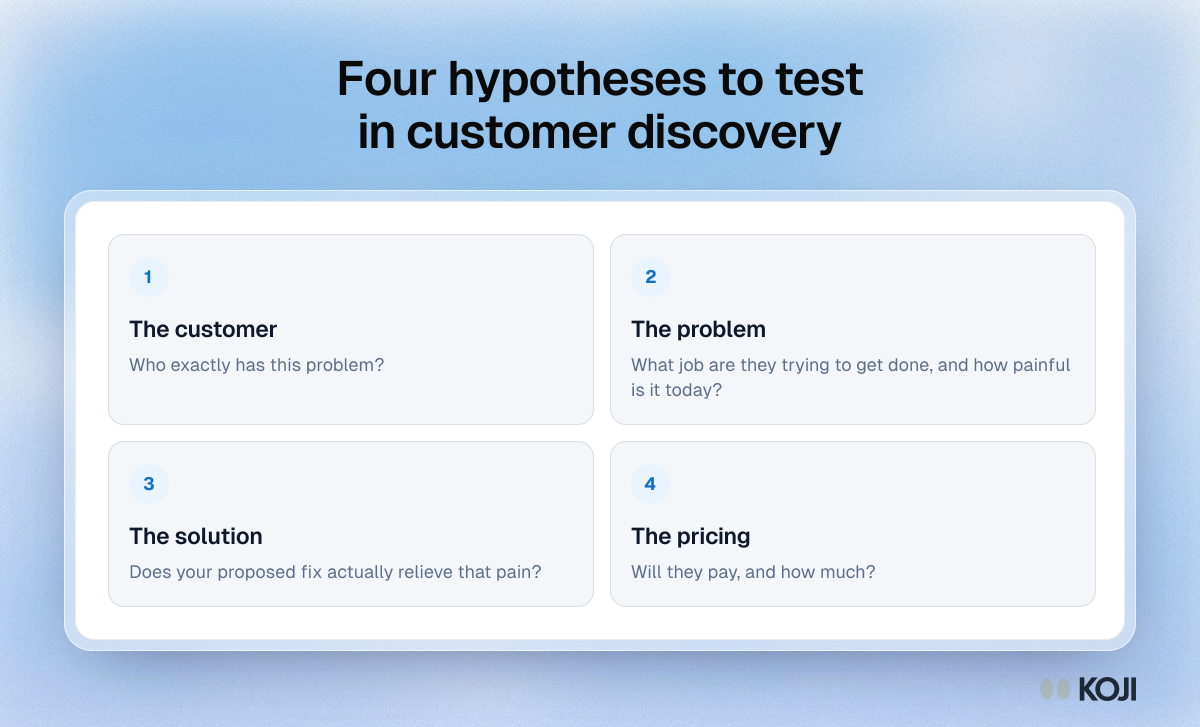
Framework of four customer discovery hypotheses to write down before interviews: the customer, the problem, the solution and the pricing.

Framework

Four hypotheses to test in customer discovery
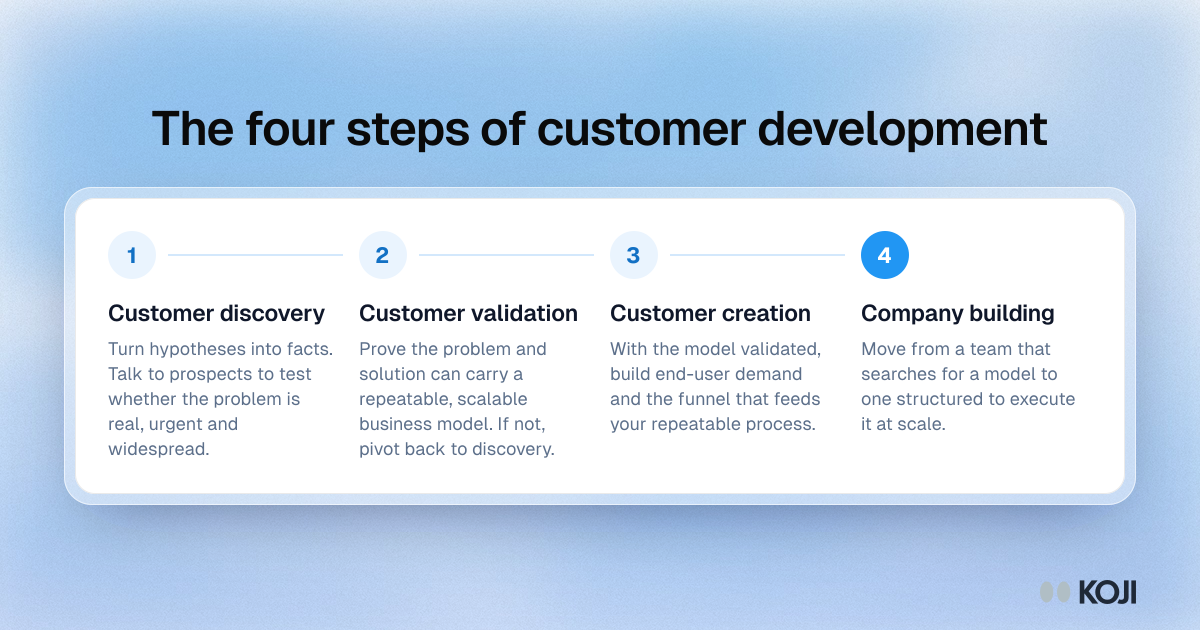
Process showing the four steps of customer development: customer discovery, customer validation, customer creation and company building.

Process

The four steps of customer development
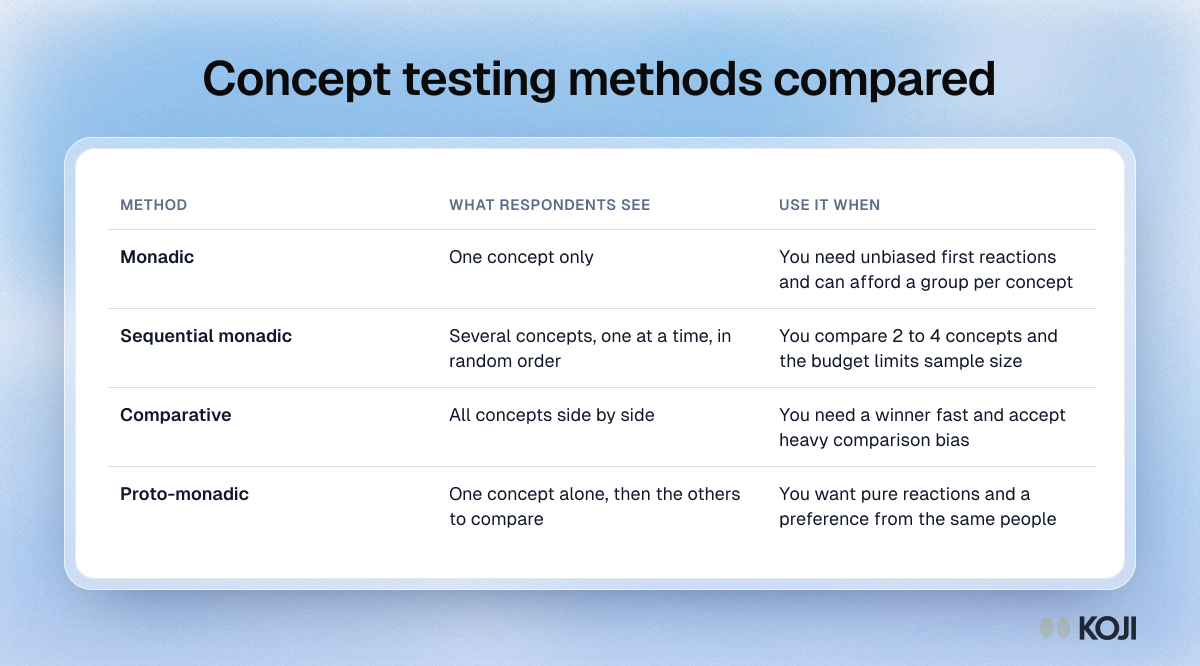
Table comparing four concept testing methods, monadic, sequential monadic, comparative and proto-monadic, by what respondents see and when to use each.

Reference table

Concept testing methods compared
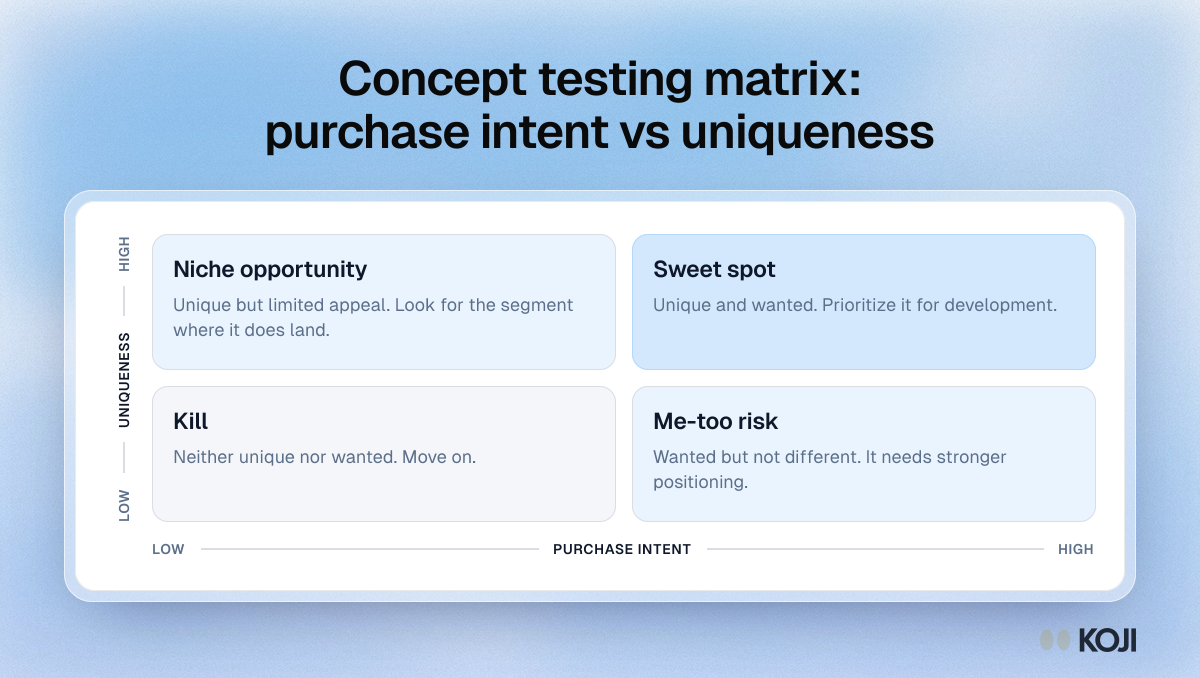
Matrix placing tested concepts by purchase intent and uniqueness: sweet spot, niche opportunity, me-too risk and kill, with what to do for each.

Matrix

Concept testing matrix: purchase intent vs uniqueness
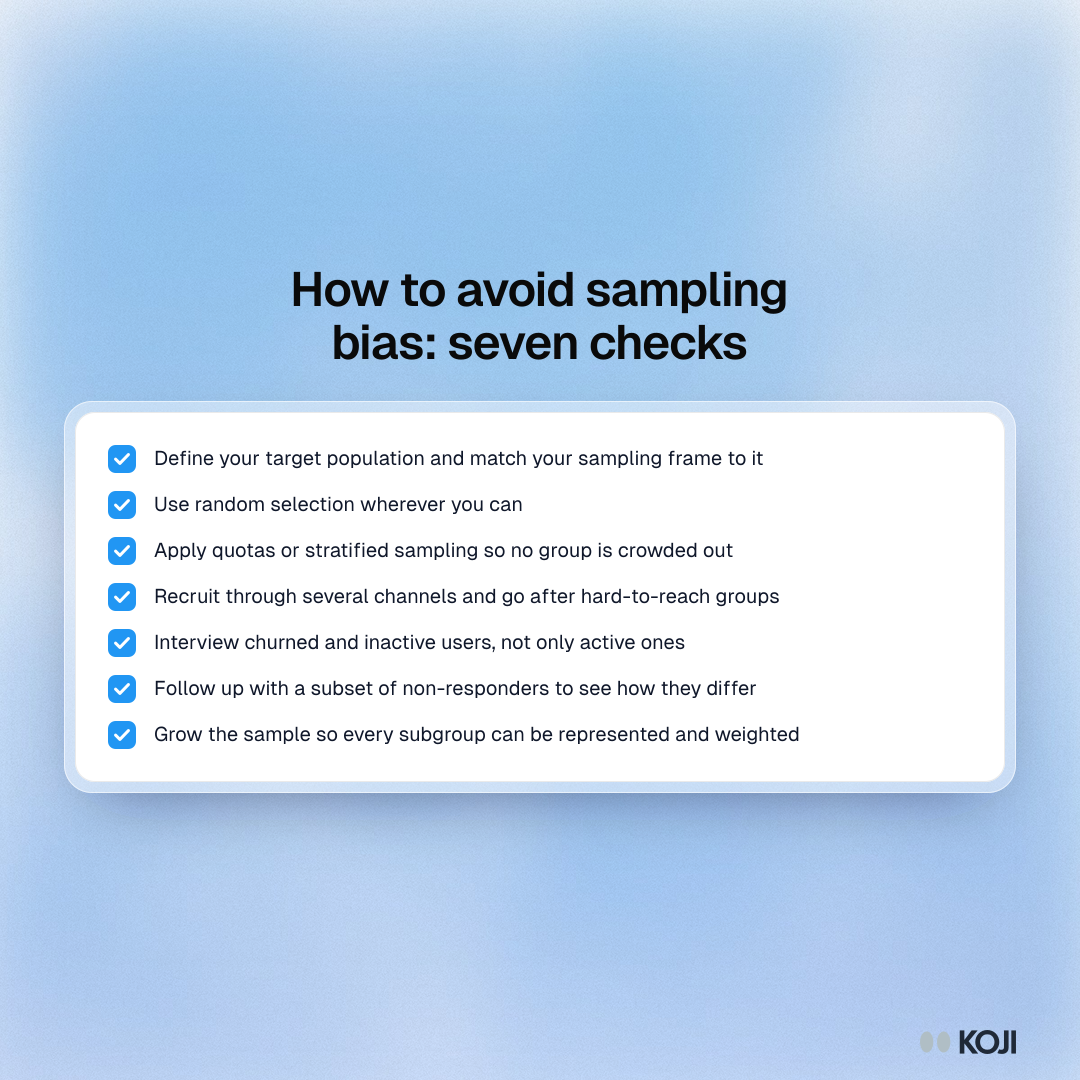
Checklist of seven ways to avoid sampling bias, from defining the sampling frame and random selection to quotas, churned users and non-responders.

Checklist

How to avoid sampling bias: seven checks
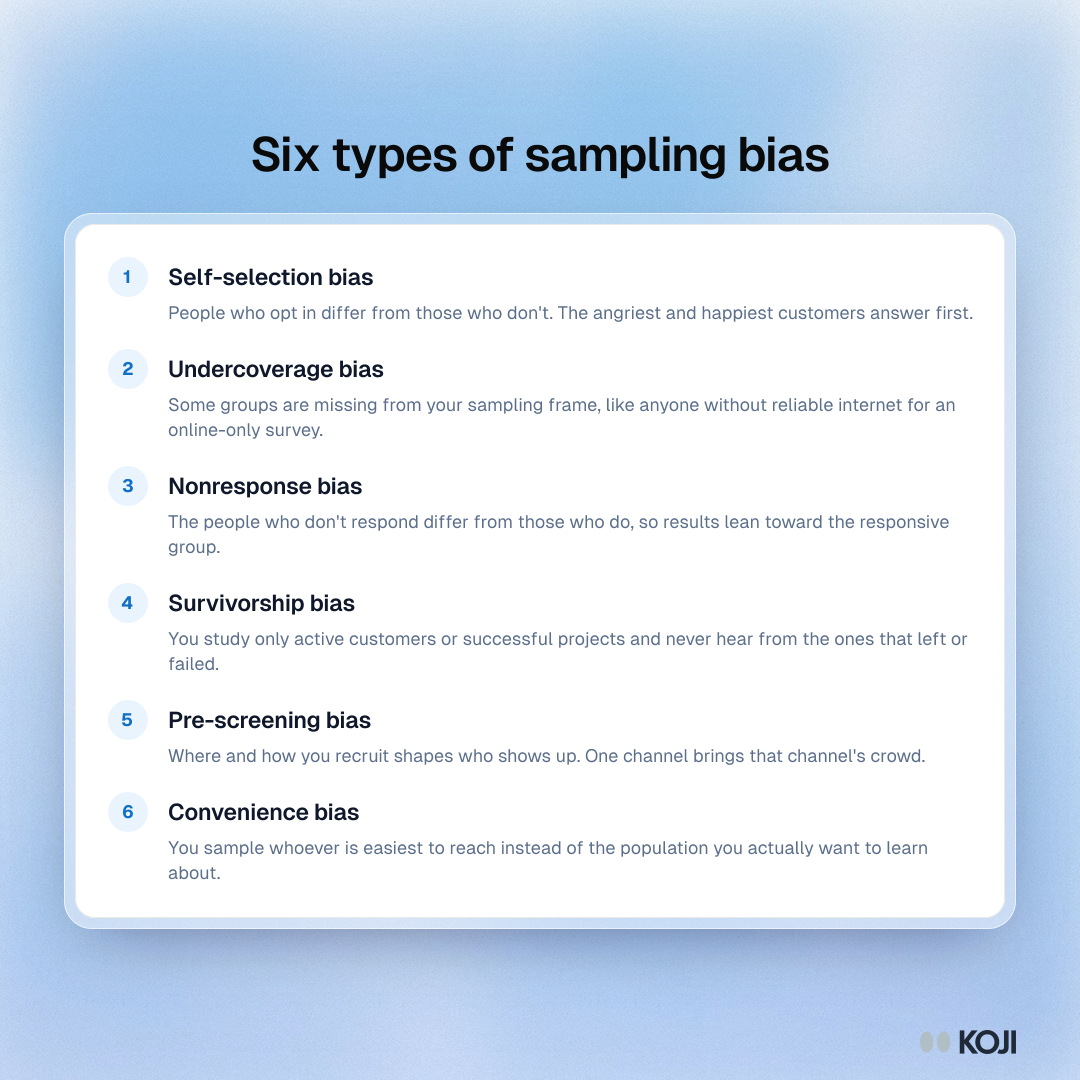
List of six types of sampling bias: self-selection, undercoverage, nonresponse, survivorship, pre-screening and convenience, each with a short example.

Guide

Six types of sampling bias

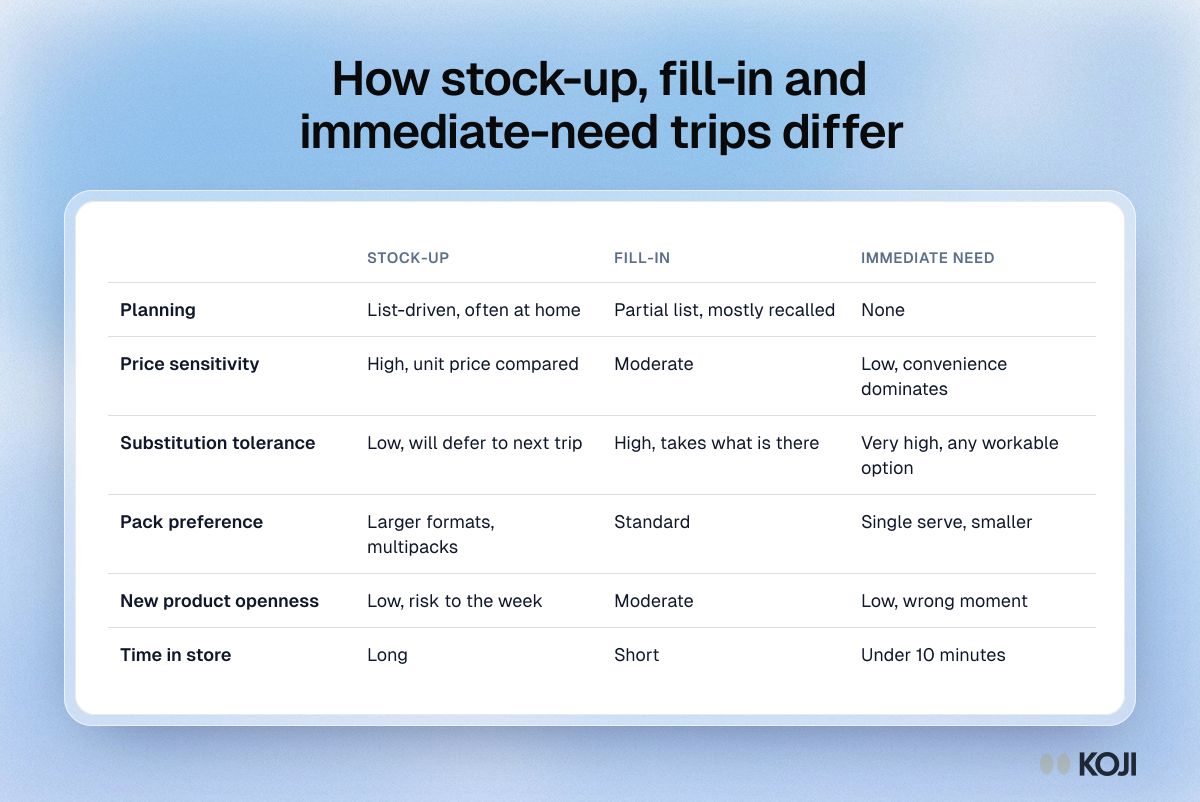
Table comparing stock-up, fill-in and immediate-need shopping trips on planning, price sensitivity, substitution, pack size, new products and time in store.

Reference table

How stock-up, fill-in and immediate-need trips differ
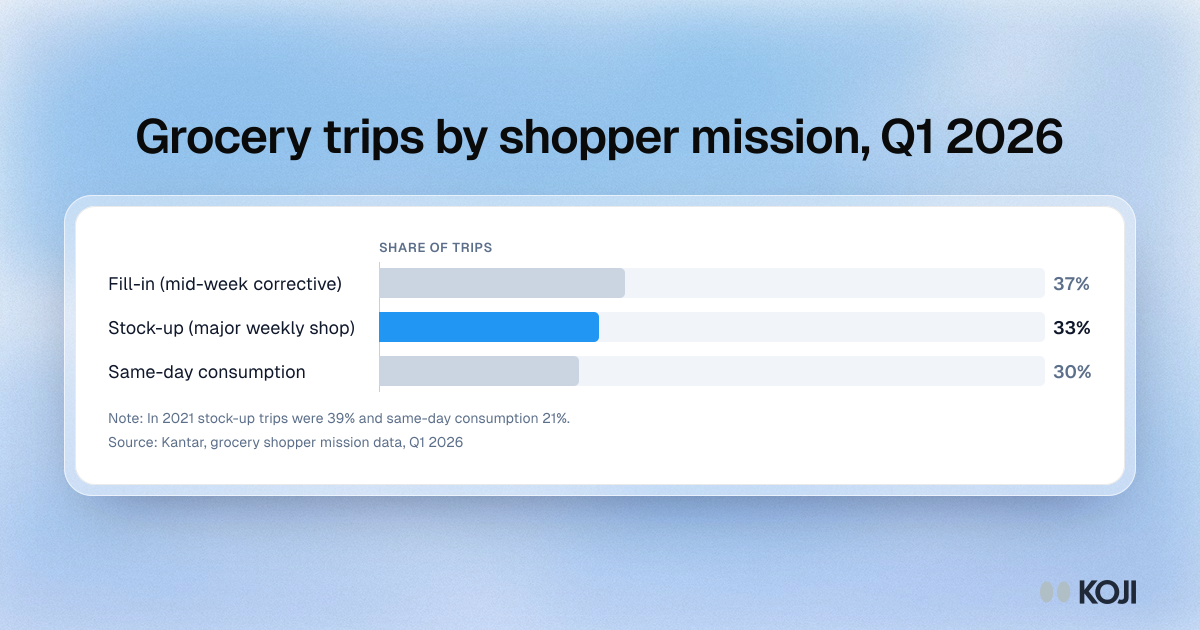
Bar chart of grocery trips by shopper mission in Q1 2026: fill-in 37%, stock-up 33% and same-day consumption 30%, per Kantar data.

Bar chart

Grocery trips by shopper mission, Q1 2026
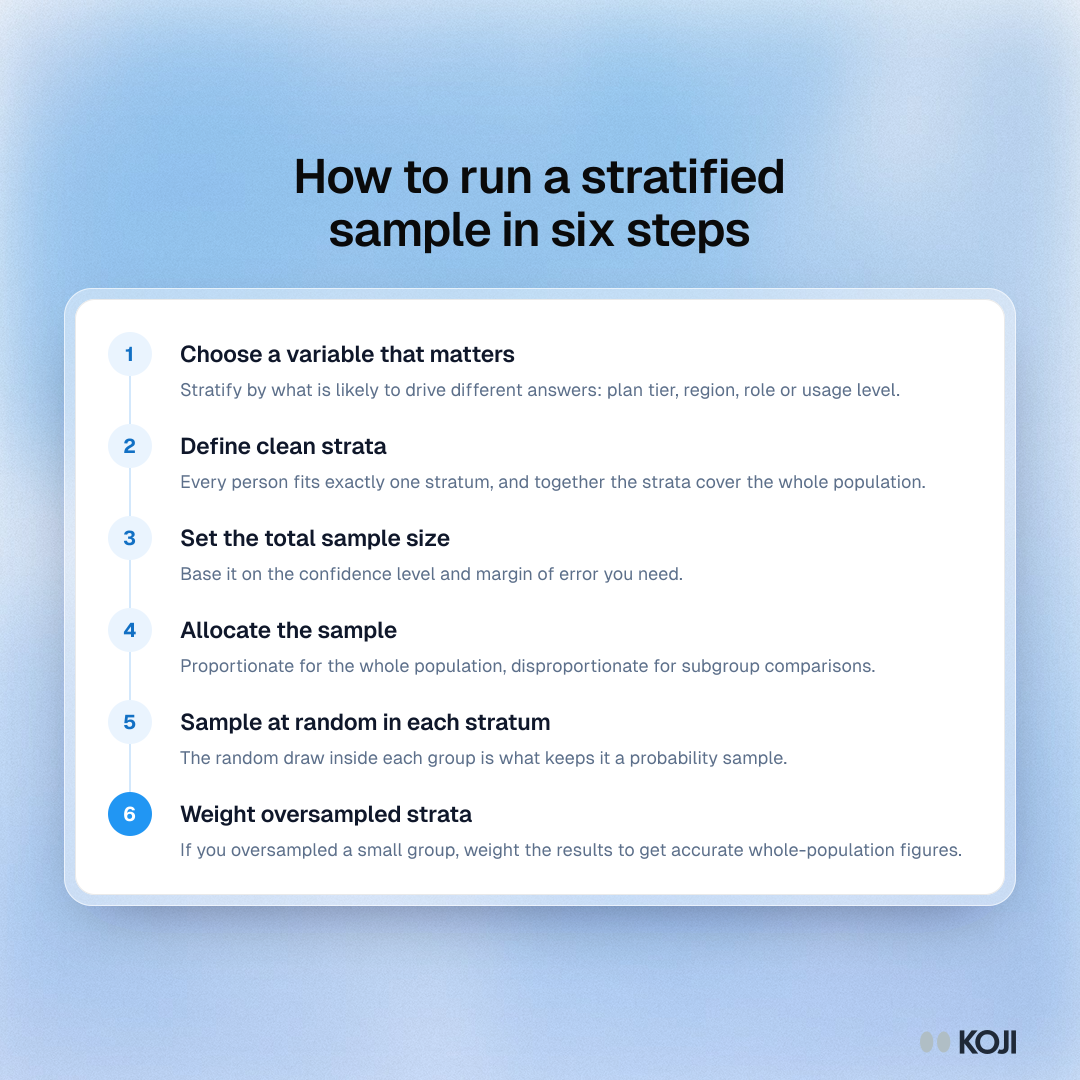
Process showing six steps for stratified sampling, from choosing a stratifying variable and defining strata to random draws and weighting.

Process

How to run a stratified sample in six steps
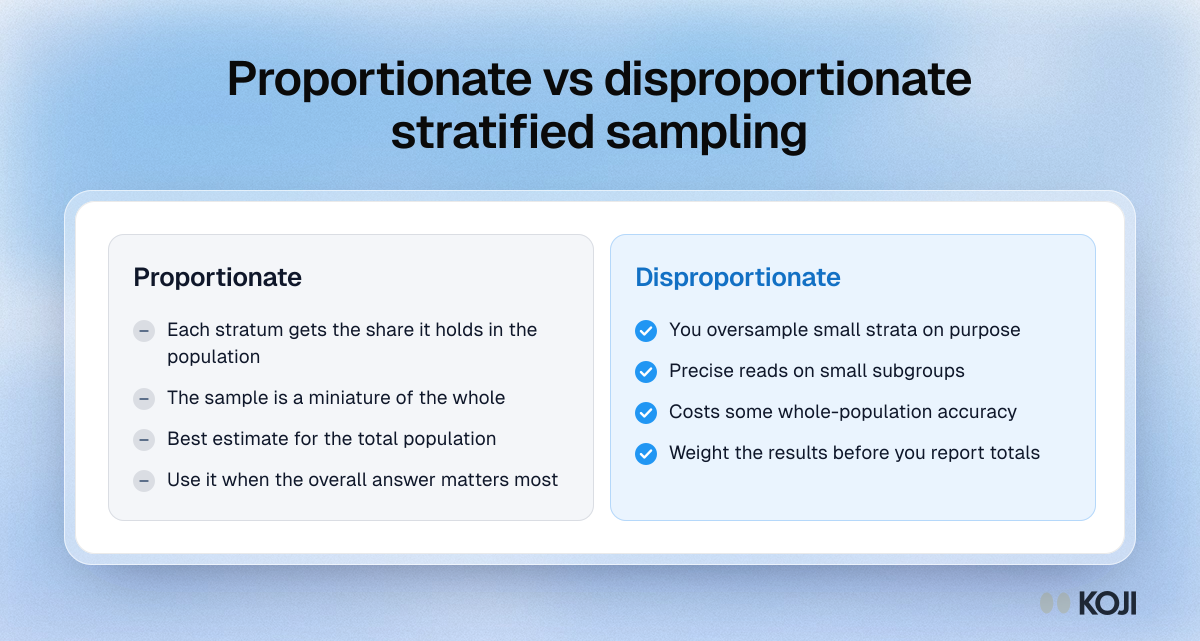
Comparison of proportionate and disproportionate stratified sampling: mirror population shares for totals, or oversample small groups for subgroup reads.

Comparison

Proportionate vs disproportionate stratified sampling
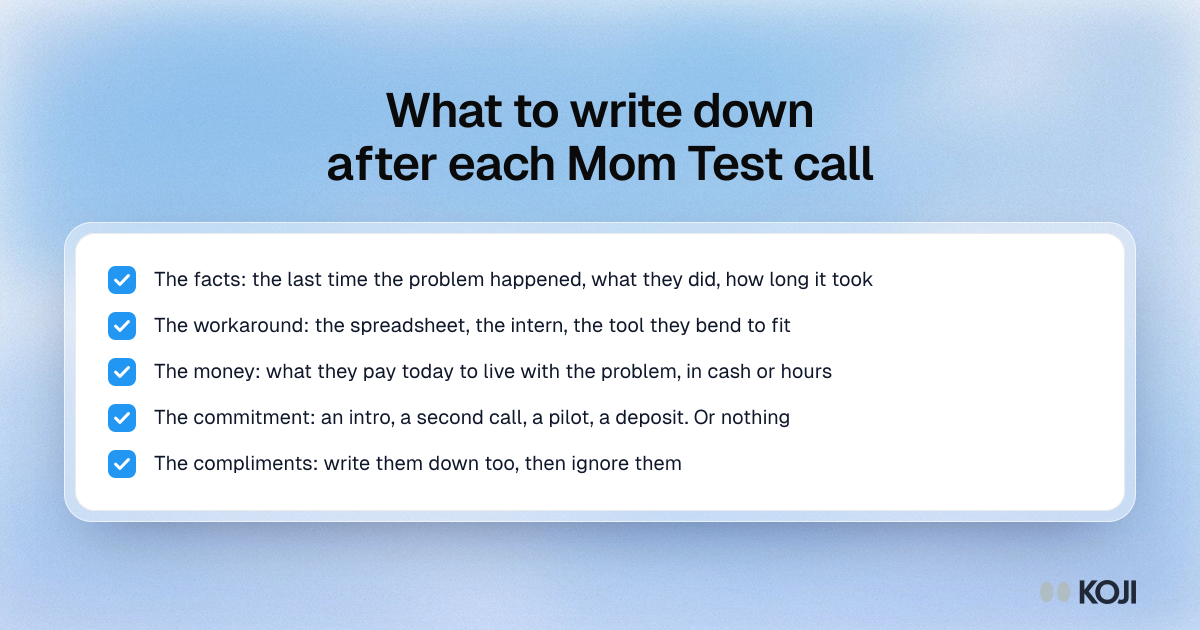
Checklist of five things to log after a Mom Test customer call: the facts, the workaround, the money, any commitment and the compliments.

Checklist

What to write down after each Mom Test call
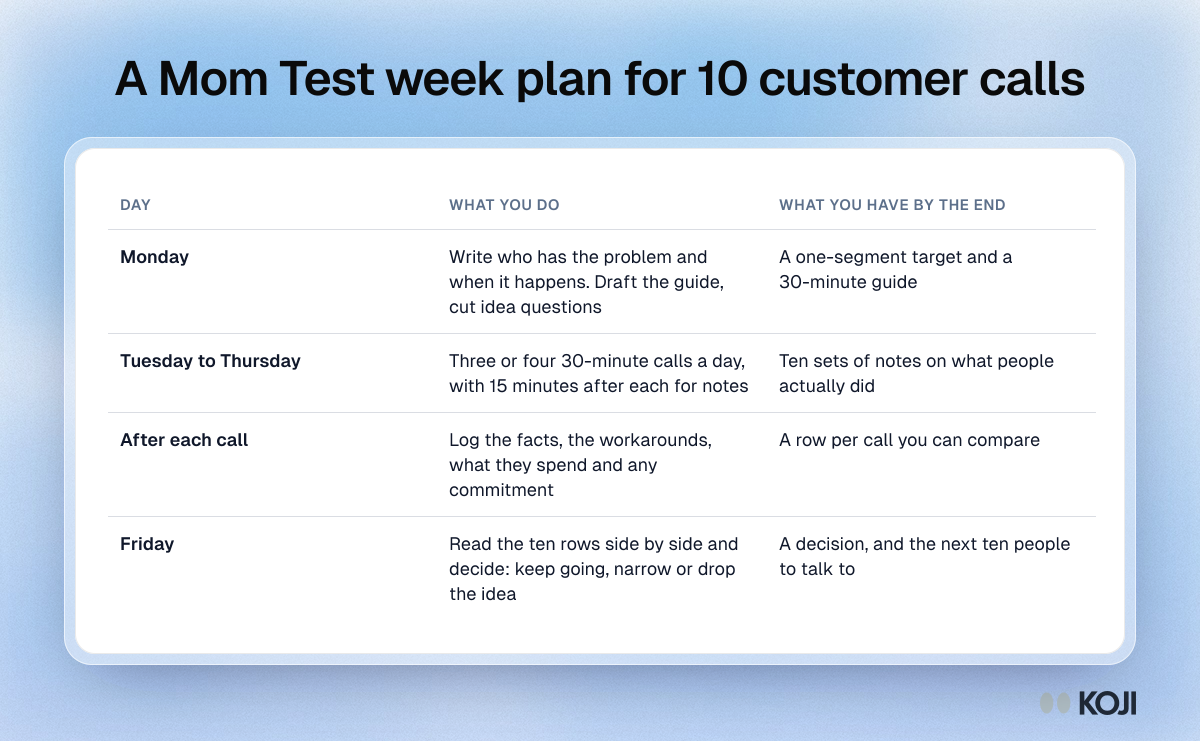
Table of a week plan for ten Mom Test customer calls: prepare on Monday, call Tuesday to Thursday, log each call and decide on Friday.

Reference table

A Mom Test week plan for 10 customer calls
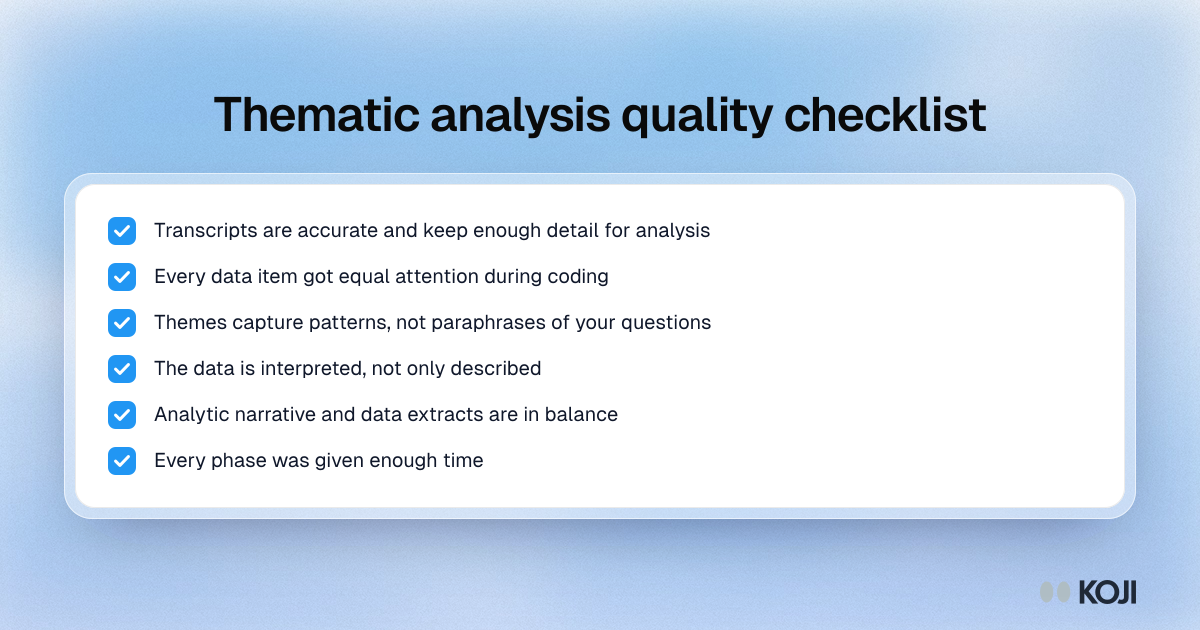
Checklist of six quality checks for thematic analysis, from accurate transcripts and even coding to themes that interpret the data.

Checklist

Thematic analysis quality checklist
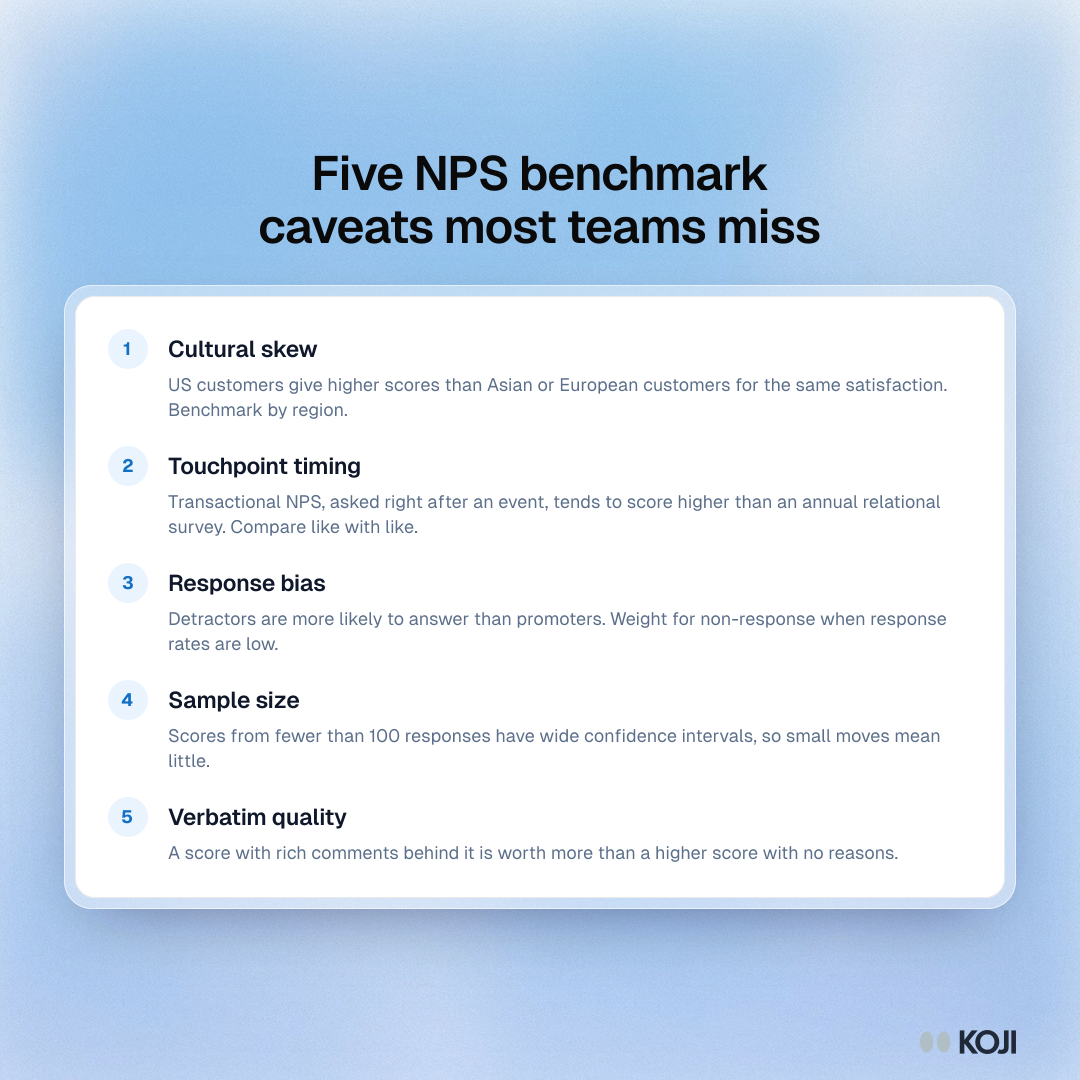
List of five NPS benchmark caveats: cultural skew, touchpoint timing, response bias, small samples and the quality of the comments behind a score.

Guide

Five NPS benchmark caveats most teams miss
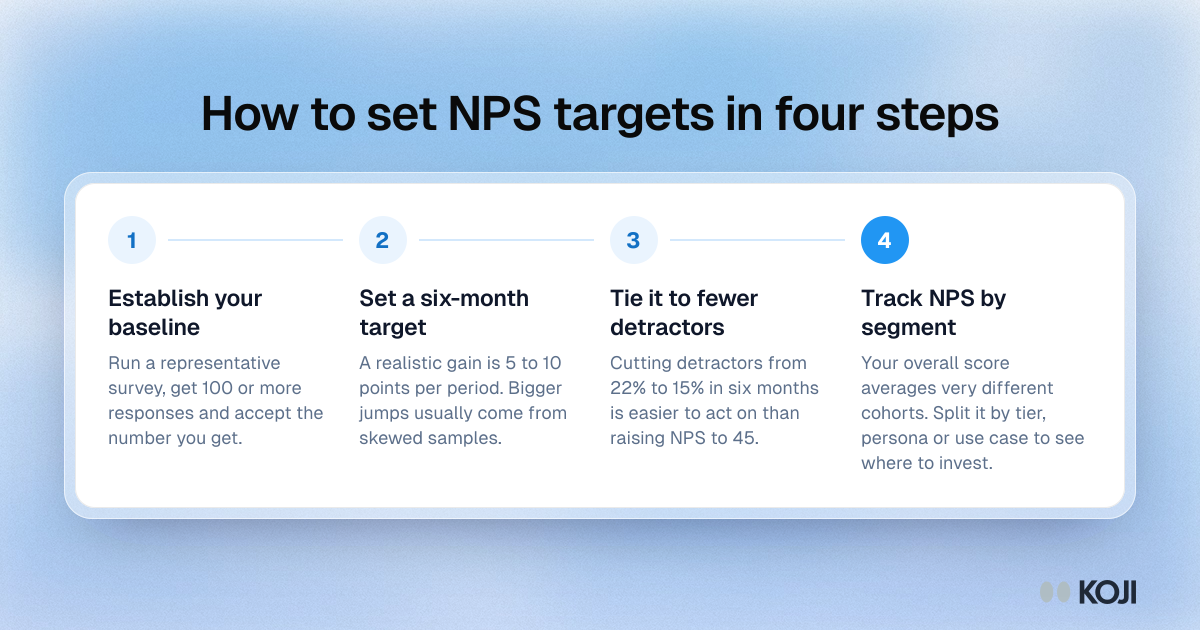
Process showing four steps for setting NPS targets: set a baseline, pick a six-month goal, tie it to fewer detractors and track each segment.

Process

How to set NPS targets in four steps