Free to save and share

Frameworks and cheat sheets for customer research

Every framework, checklist and comparison from our guides, as an image you can download, drop into a deck or share with your team.
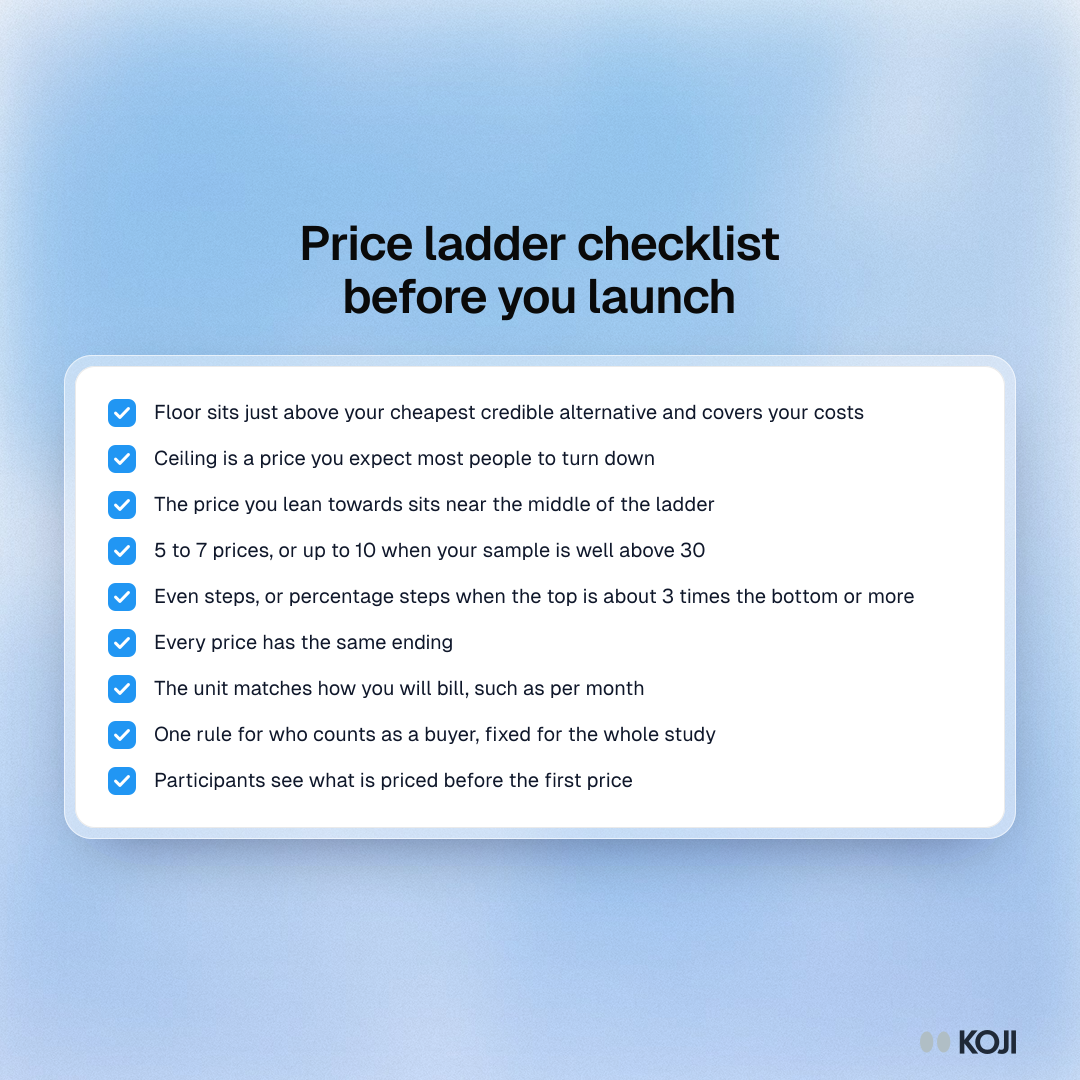
Checklist of nine checks before running a price test, covering the floor and ceiling, spacing, price endings, the unit and who counts as a buyer.

Checklist

Price ladder checklist before you launch
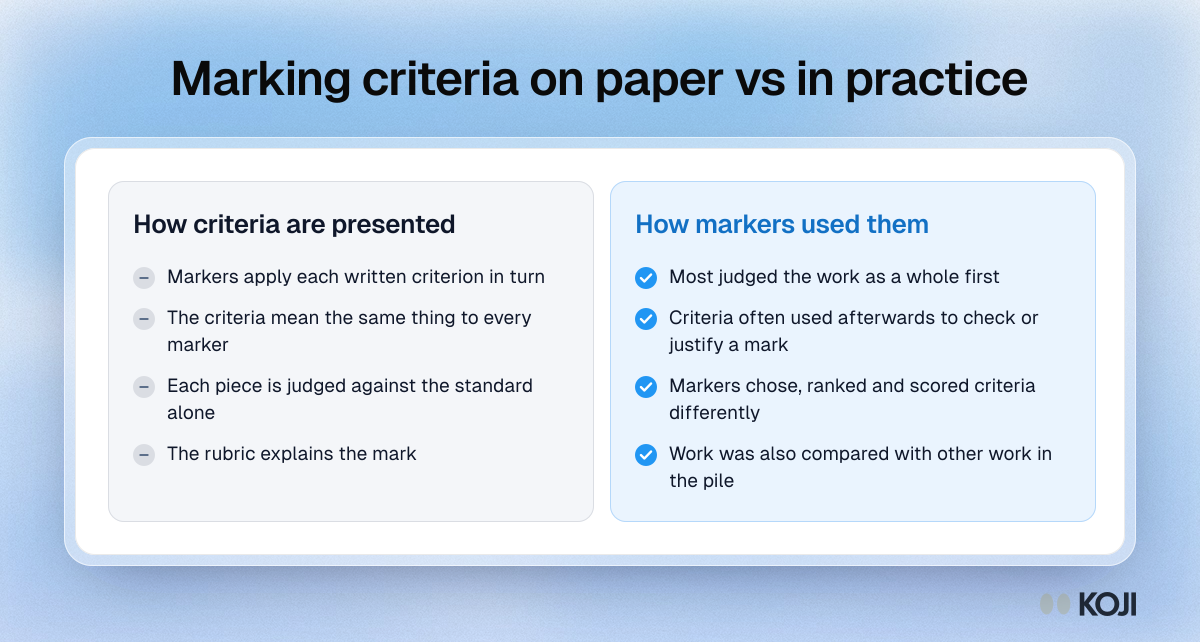
Comparison of how marking criteria are presented to students with how UK assessors used them in practice, in studies by Bloxham and colleagues.

Comparison

Marking criteria on paper vs in practice
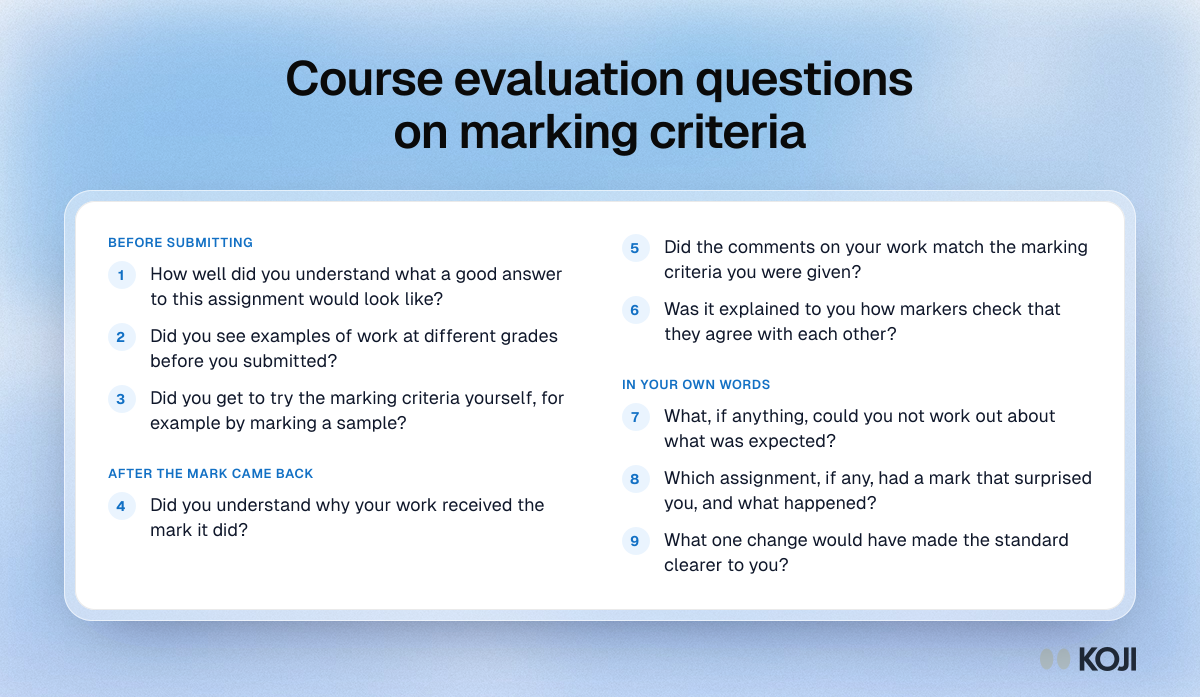
Question bank for course evaluations on marking criteria, with nine questions on how students understood the standard before and after marking.

Question bank

Course evaluation questions on marking criteria
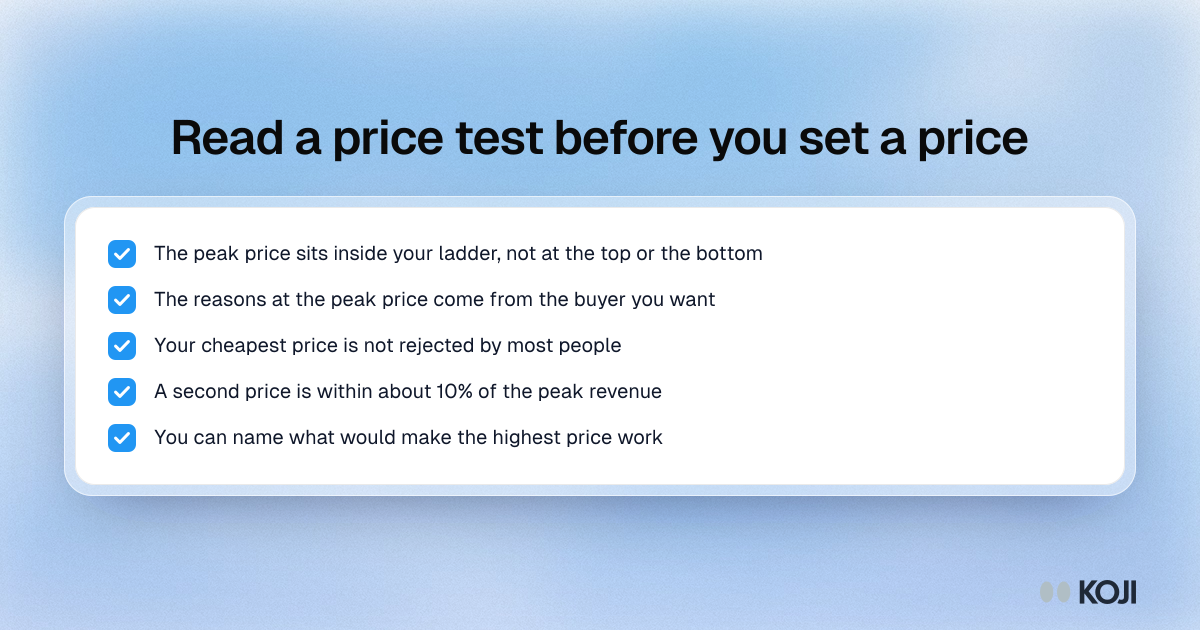
Checklist of five checks for reading a price test: where the peak falls, who gives the reasons, the cheapest price, a close second price and the top price.

Checklist

Read a price test before you set a price
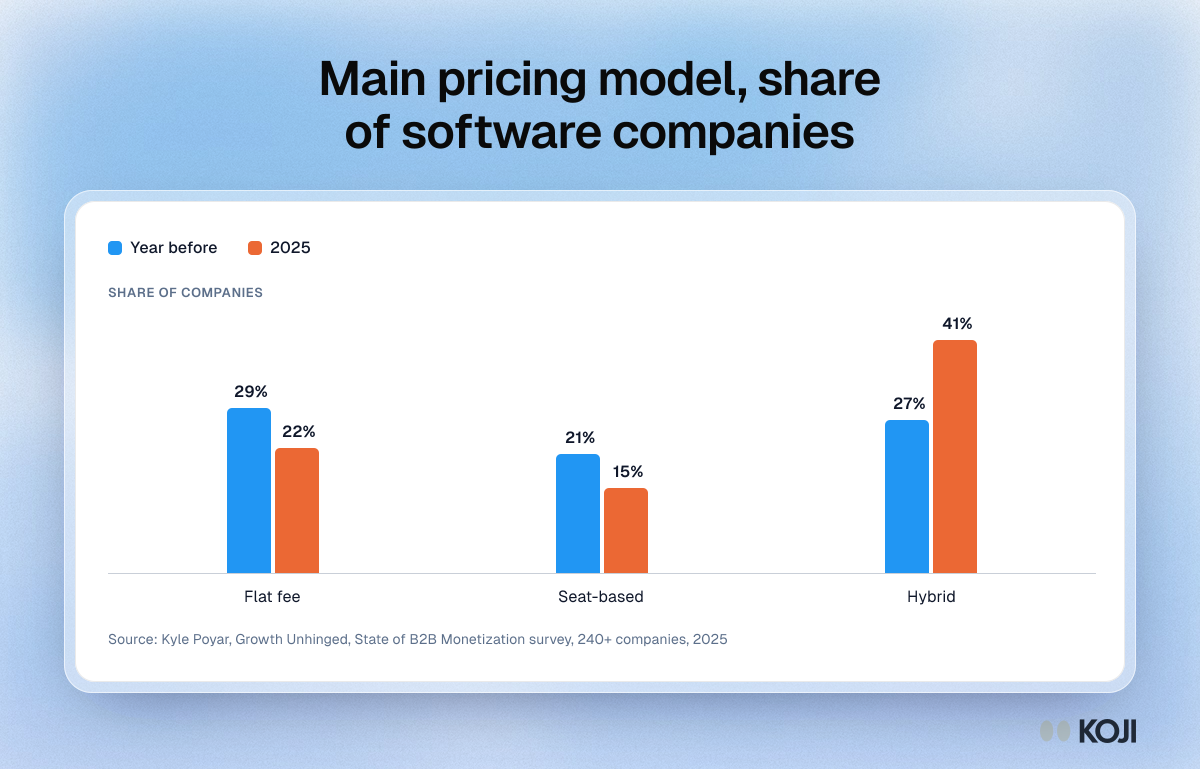
Column chart of the main pricing model at software companies: flat fee fell from 29% to 22%, seat-based from 21% to 15%, hybrid rose from 27% to 41%.

Column chart

Main pricing model, share of software companies
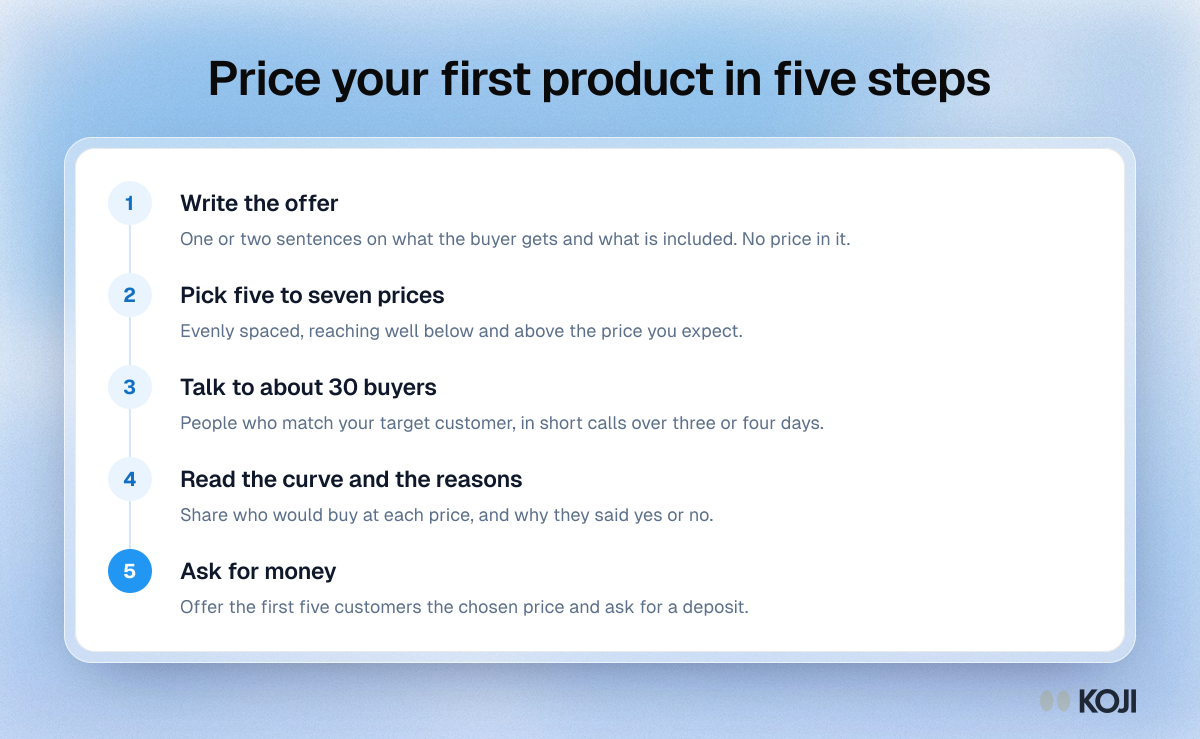
Process showing five steps to price a first product: write the offer, pick prices, talk to about 30 buyers, read the curve, ask for money.

Process

Price your first product in five steps
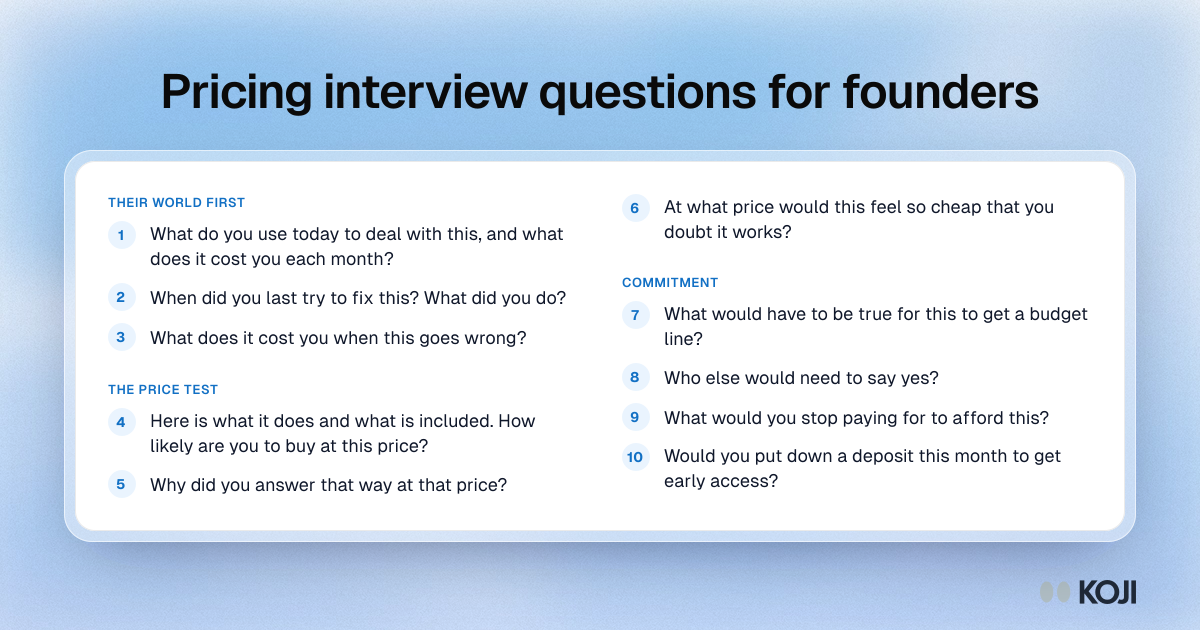
Question bank for pricing interviews with early customers, in three parts: their current spend, the price test and commitment.

Question bank

Pricing interview questions for founders
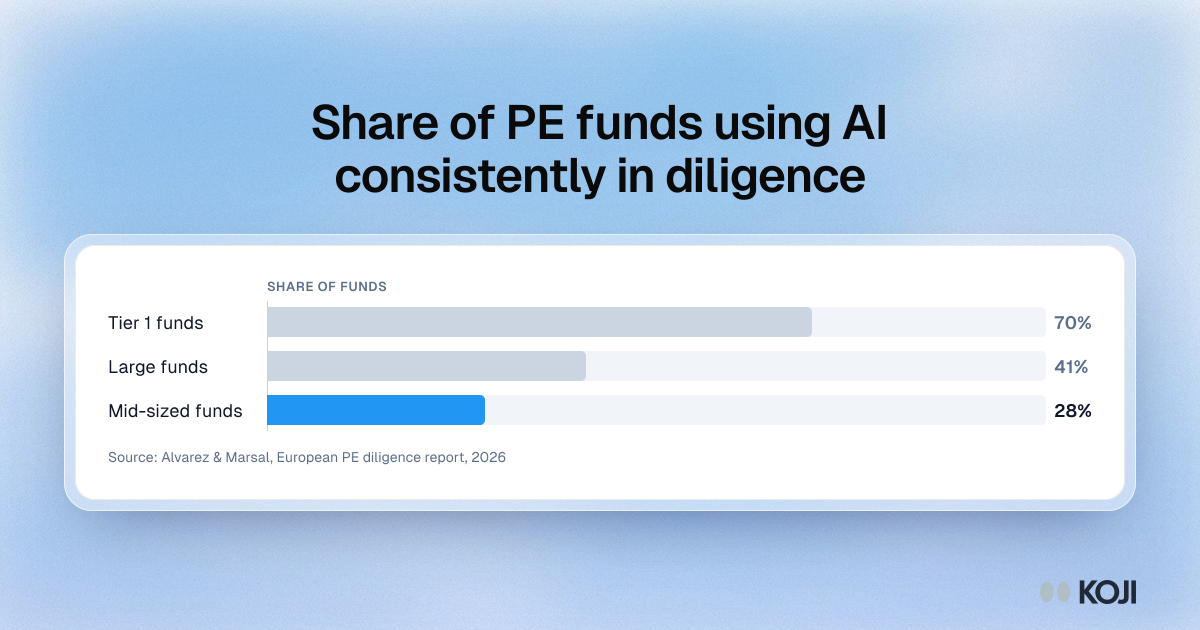
Bar chart of the share of private equity funds using AI consistently in diligence: 70% of Tier 1 funds, 41% of large funds and 28% of mid-sized funds.

Bar chart

Share of PE funds using AI consistently in diligence
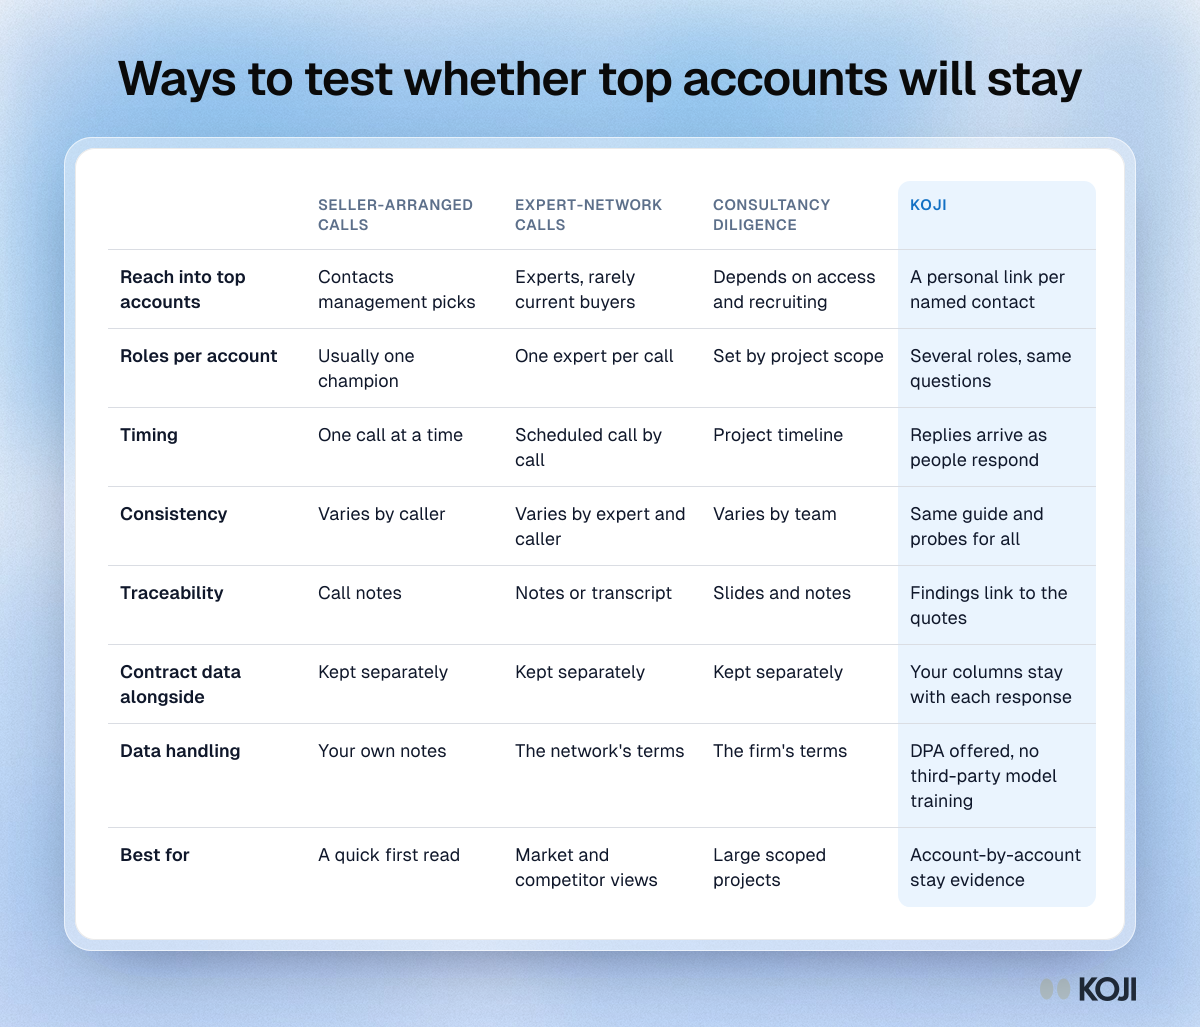
Table comparing seller-arranged calls, expert-network calls, consultancy diligence and Koji for top-account interviews on reach, roles, timing and traceability.

Reference table

Ways to test whether top accounts will stay
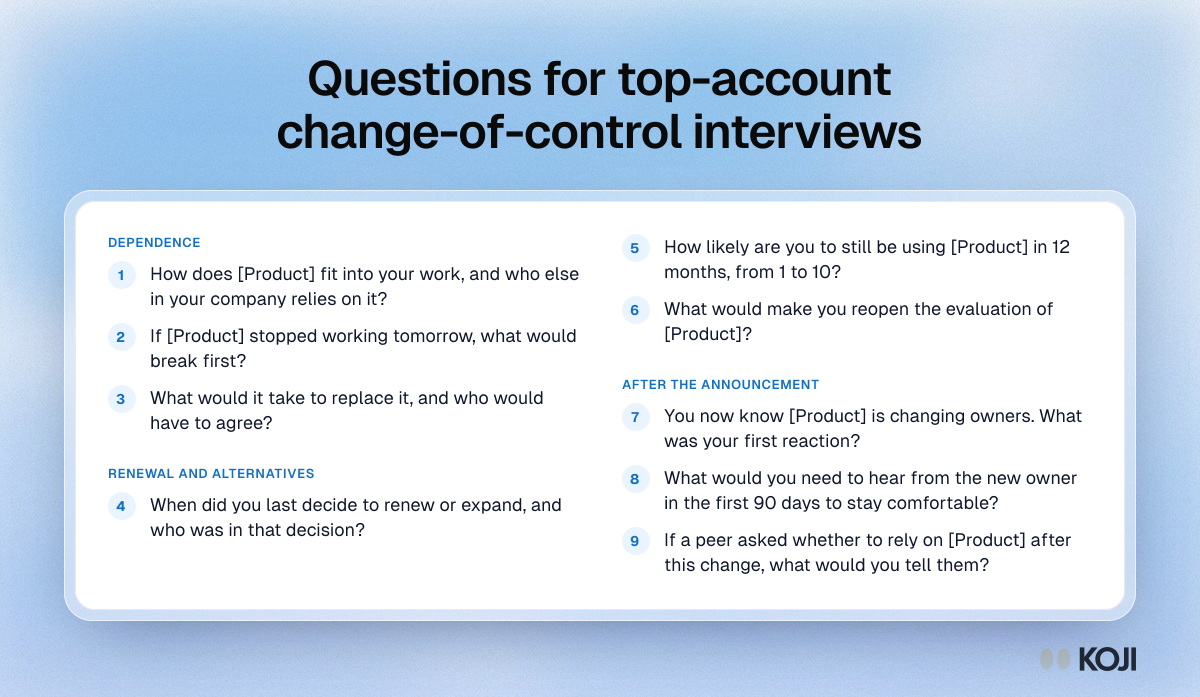
Question bank for interviewing a target's top customers in due diligence, covering dependence, renewal and the period after the announcement.

Question bank

Questions for top-account change-of-control interviews
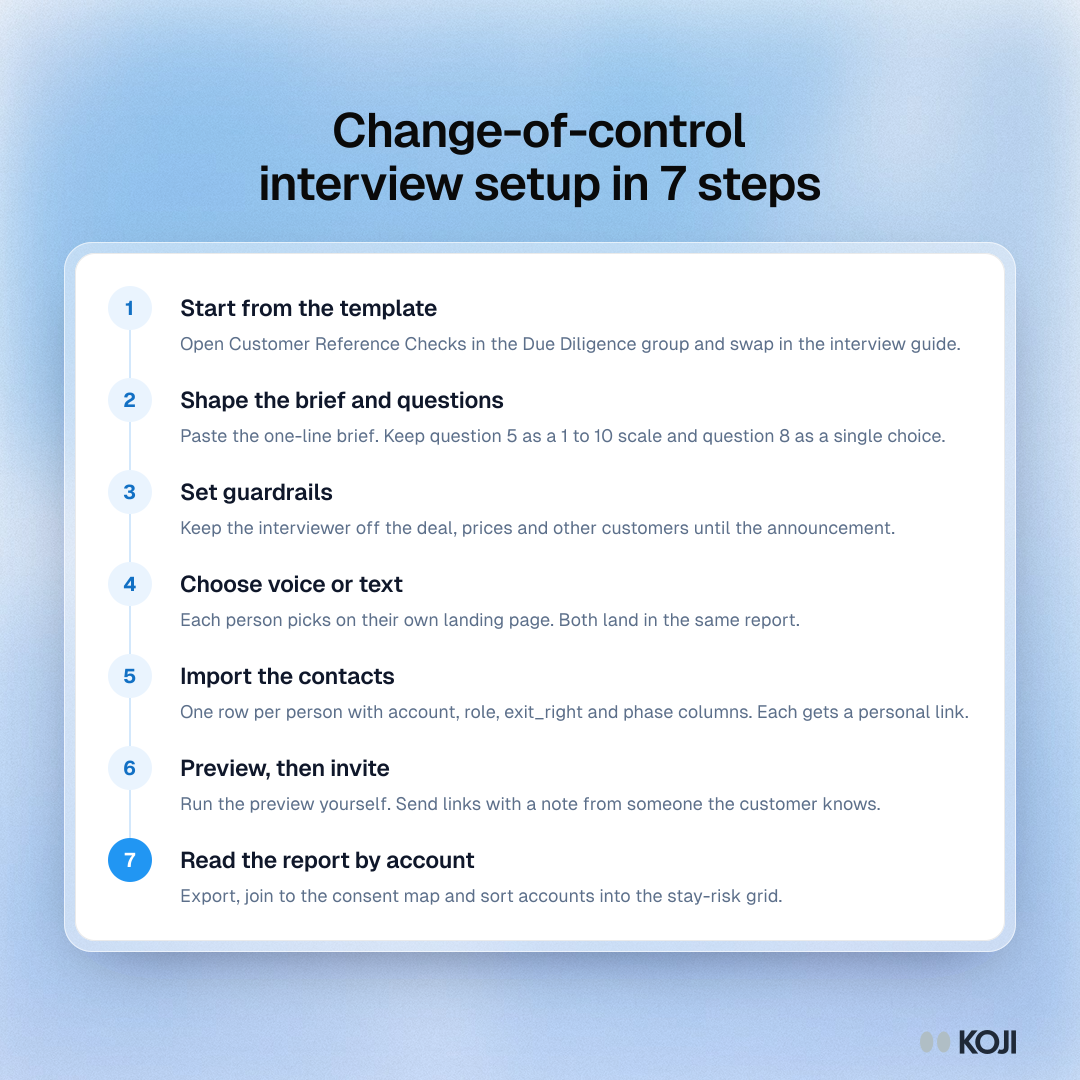
Process showing seven steps to set up change-of-control customer interviews in Koji, from the template to a report read by account.

Process

Change-of-control interview setup in 7 steps
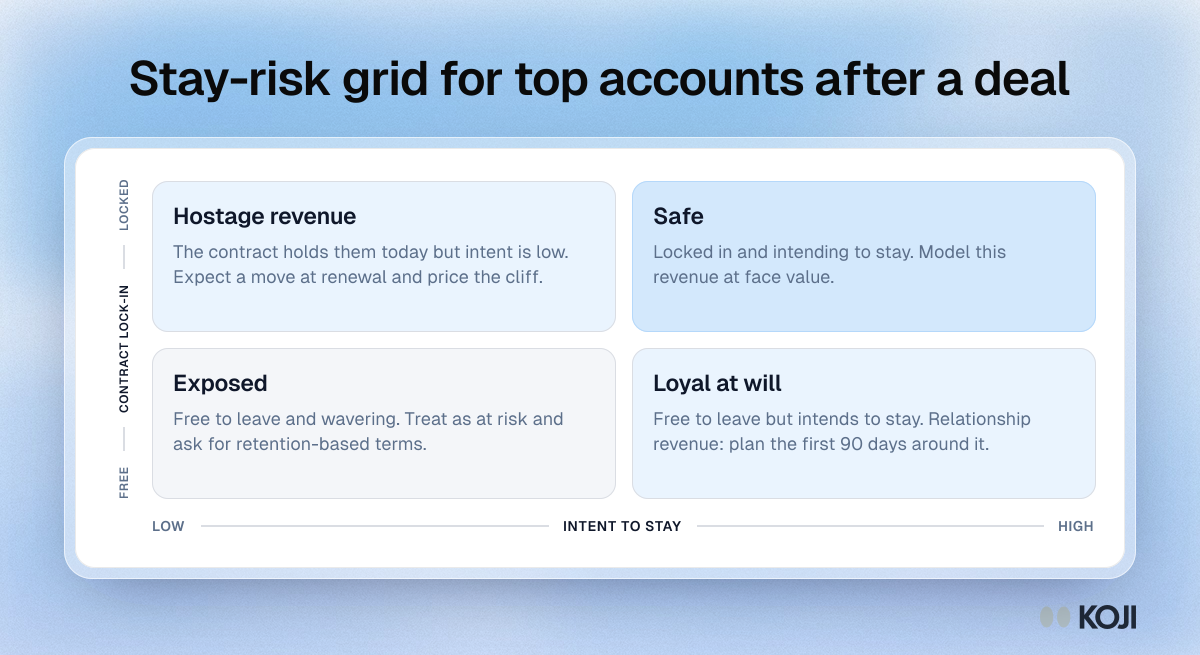
Matrix of contract lock-in against intent to stay that sorts top accounts into safe, hostage revenue, loyal at will and exposed.

Matrix

Stay-risk grid for top accounts after a deal
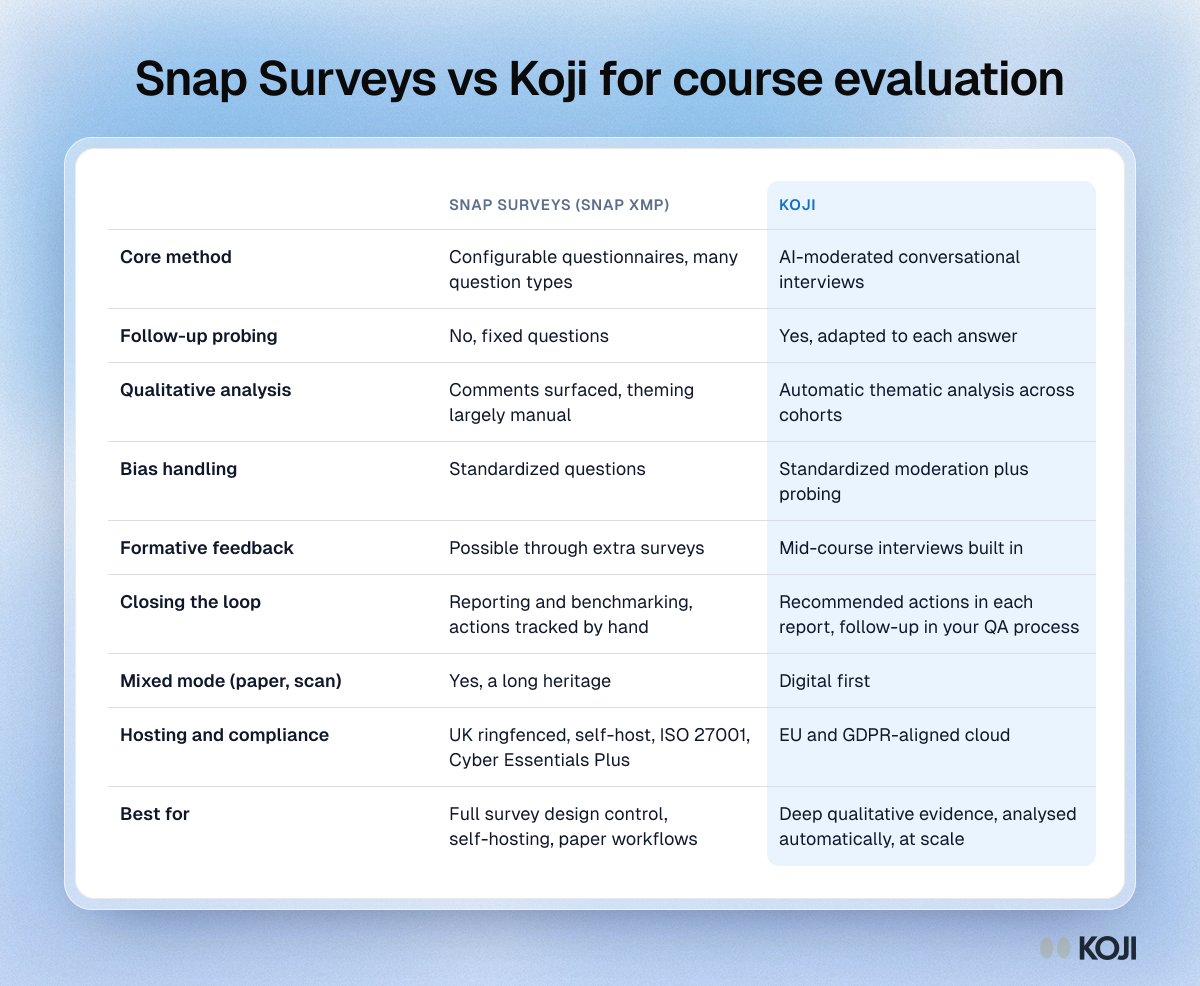
Comparison table of Snap Surveys and Koji for course evaluation: method, follow-up probing, analysis, formative feedback, hosting and best fit.

Reference table

Snap Surveys vs Koji for course evaluation
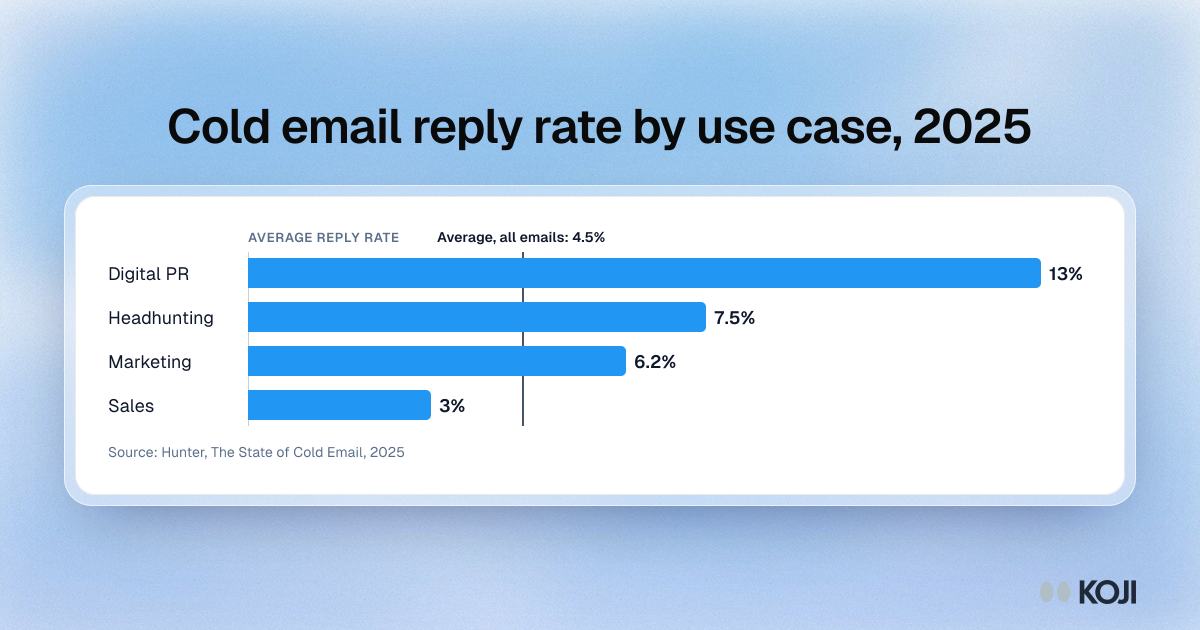
Bar chart of average cold email reply rates by use case in 2025: digital PR 13%, headhunting 7.5%, marketing 6.2% and sales 3%, against a 4.5% average.

Bar chart

Cold email reply rate by use case, 2025
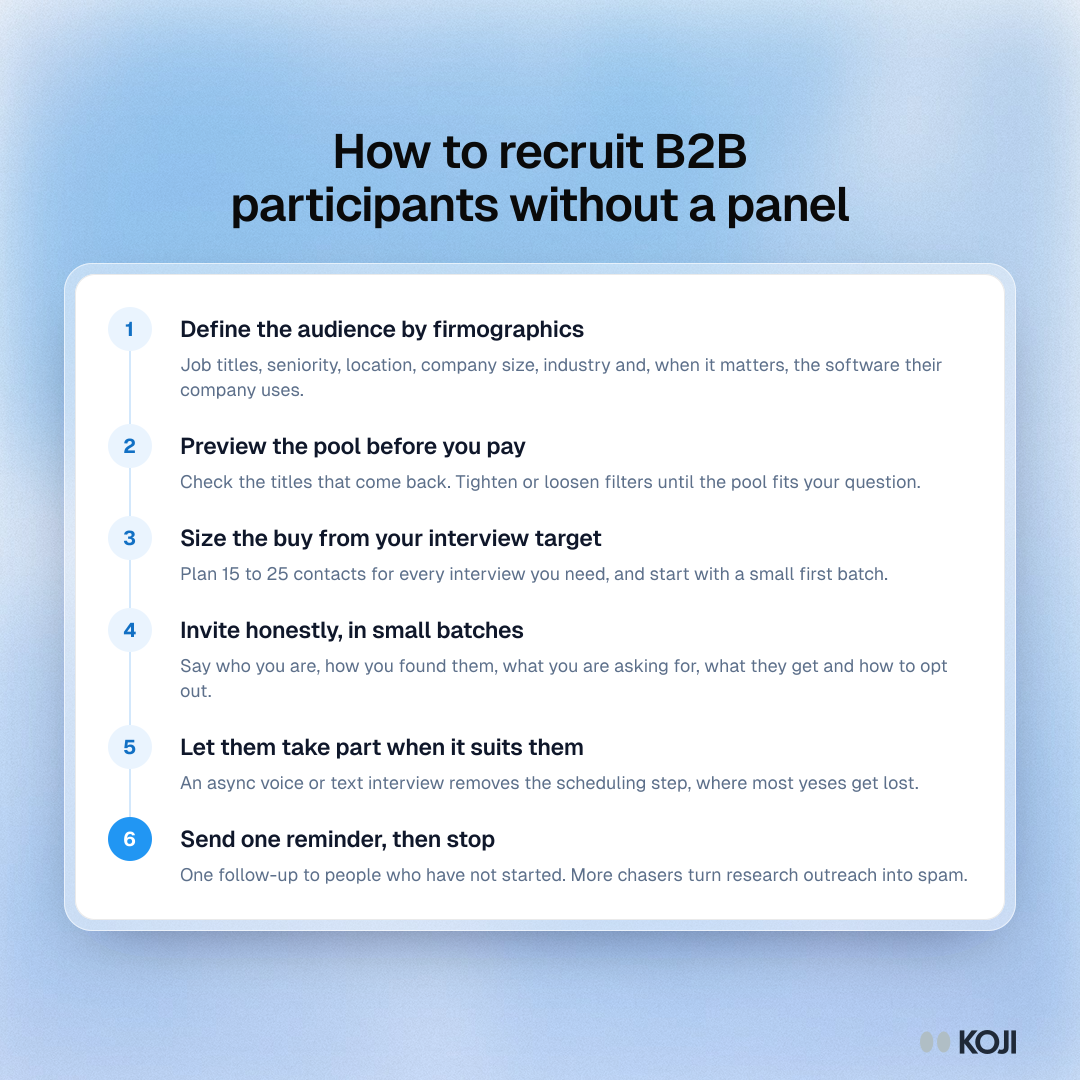
Process in six steps for recruiting B2B research participants through direct outreach, from defining the audience to following up.

Process

How to recruit B2B participants without a panel
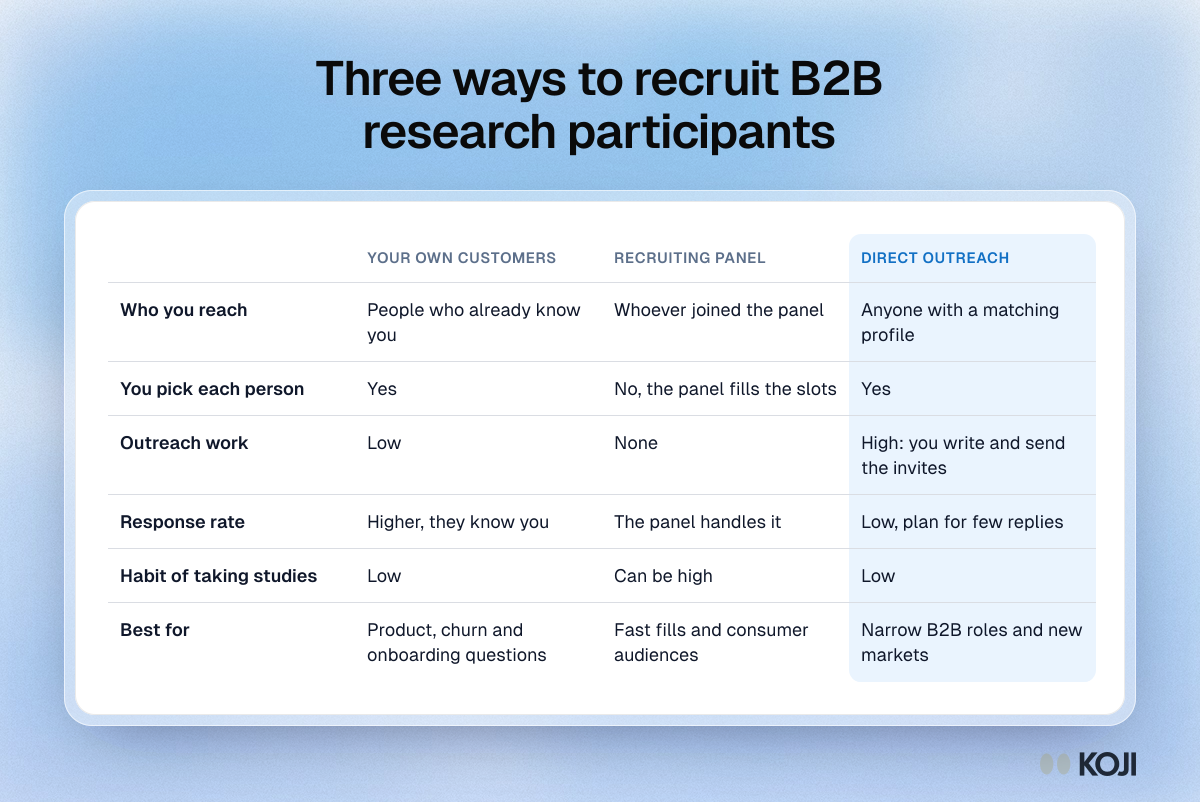
Table comparing three ways to recruit B2B research participants: your own customers, a recruiting panel and direct outreach, by reach, control and effort.

Reference table

Three ways to recruit B2B research participants
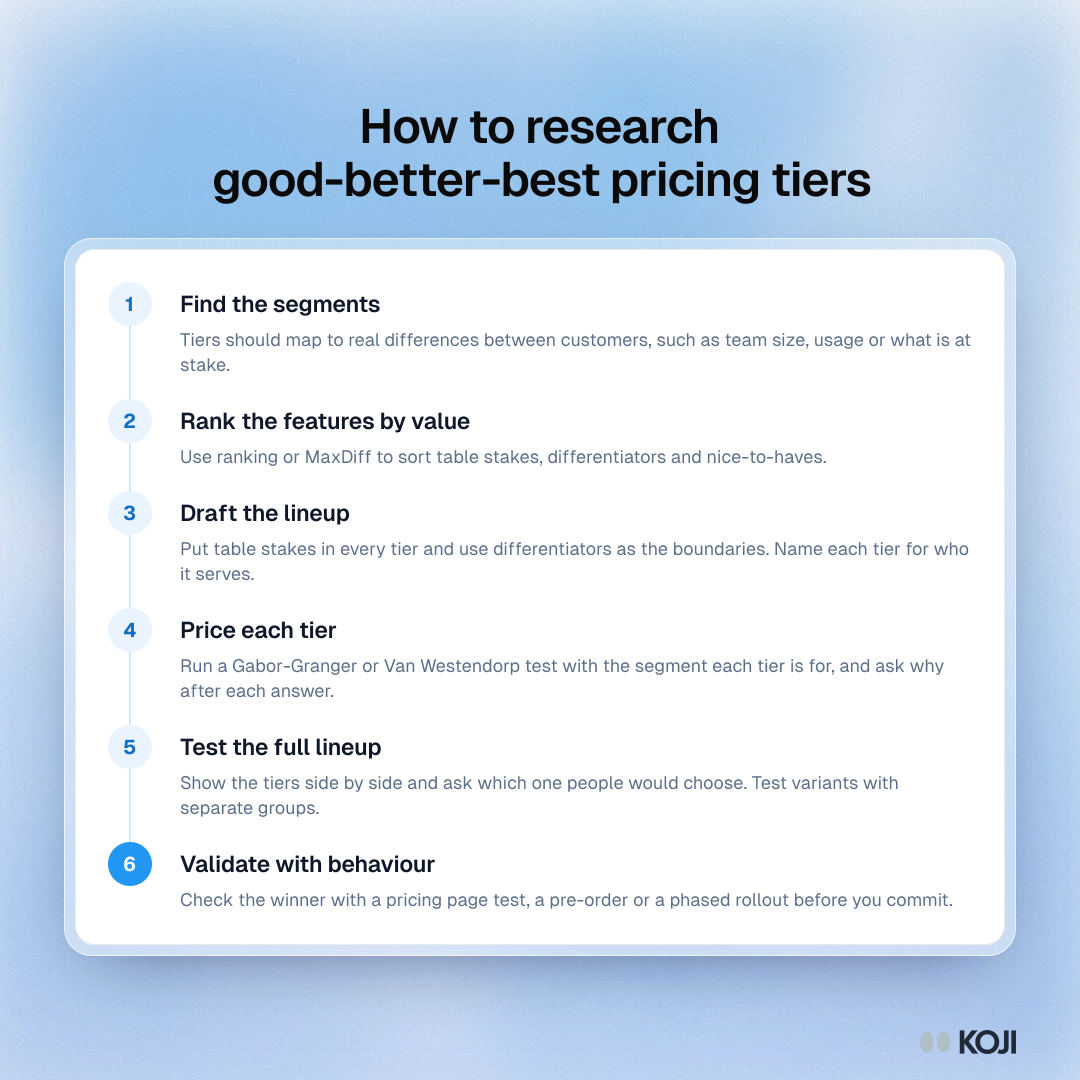
Process for researching good-better-best pricing tiers in six steps, from finding segments to testing the full lineup and validating with behaviour

Process

How to research good-better-best pricing tiers
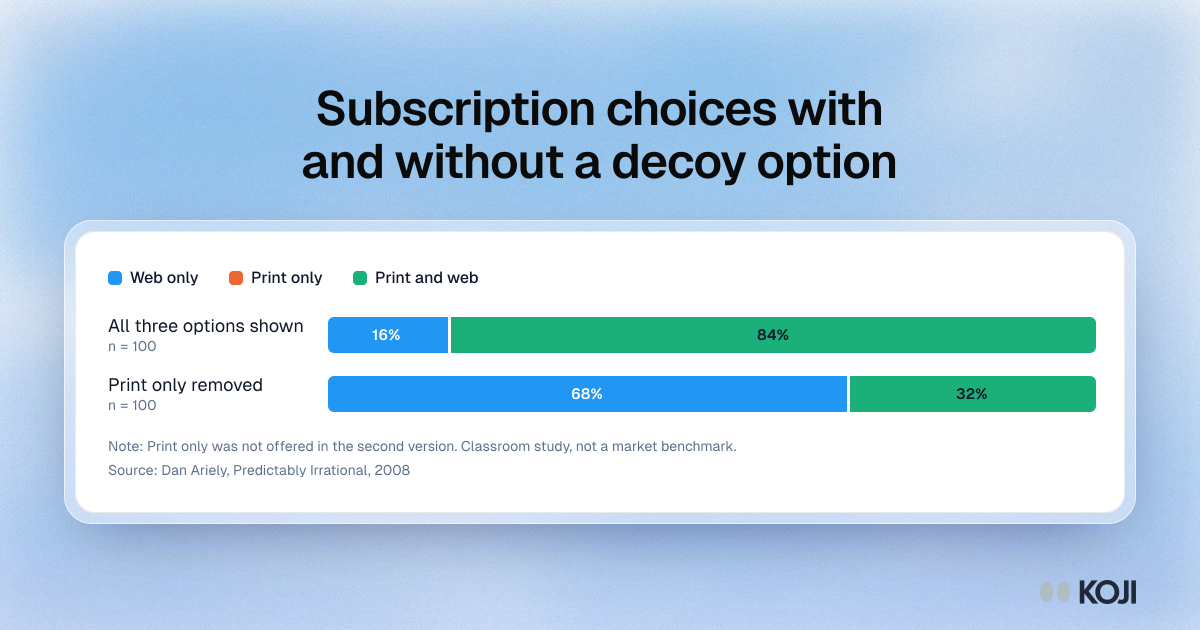
Stacked chart of how 100 students chose a subscription with and without a print-only decoy, showing print and web falling from 84 to 32

Stacked bar chart

Subscription choices with and without a decoy option
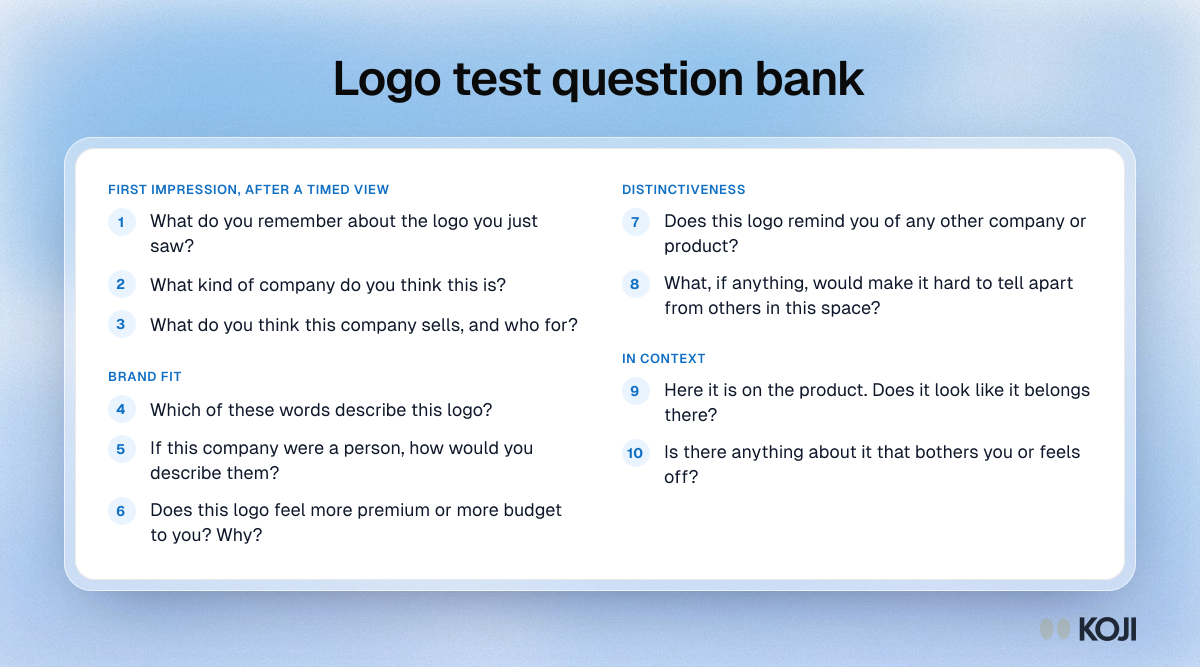
Question bank for a logo test, with questions for a first impression after a timed view, brand fit, distinctiveness and context

Question bank

Logo test question bank
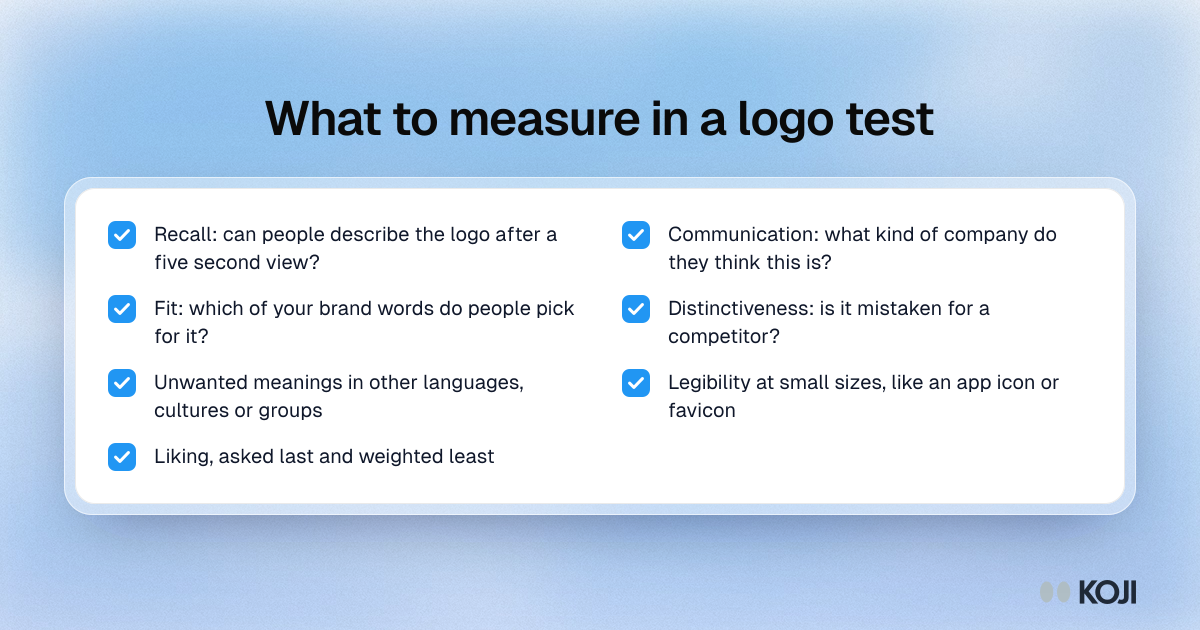
Checklist of what to measure in a logo test, from recall after a short view to unwanted associations and legibility at small sizes

Checklist

What to measure in a logo test
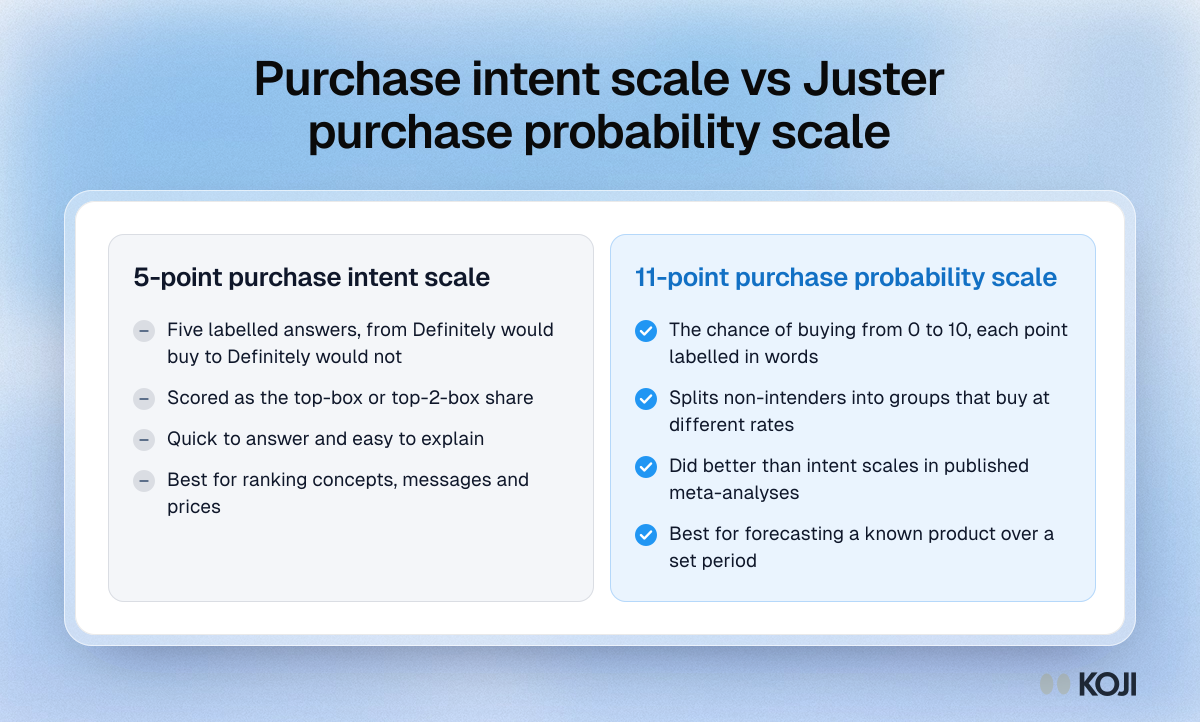
Comparison of the 5-point purchase intent scale and the 11-point Juster purchase probability scale, with what each is best for

Comparison

Purchase intent scale vs Juster purchase probability scale
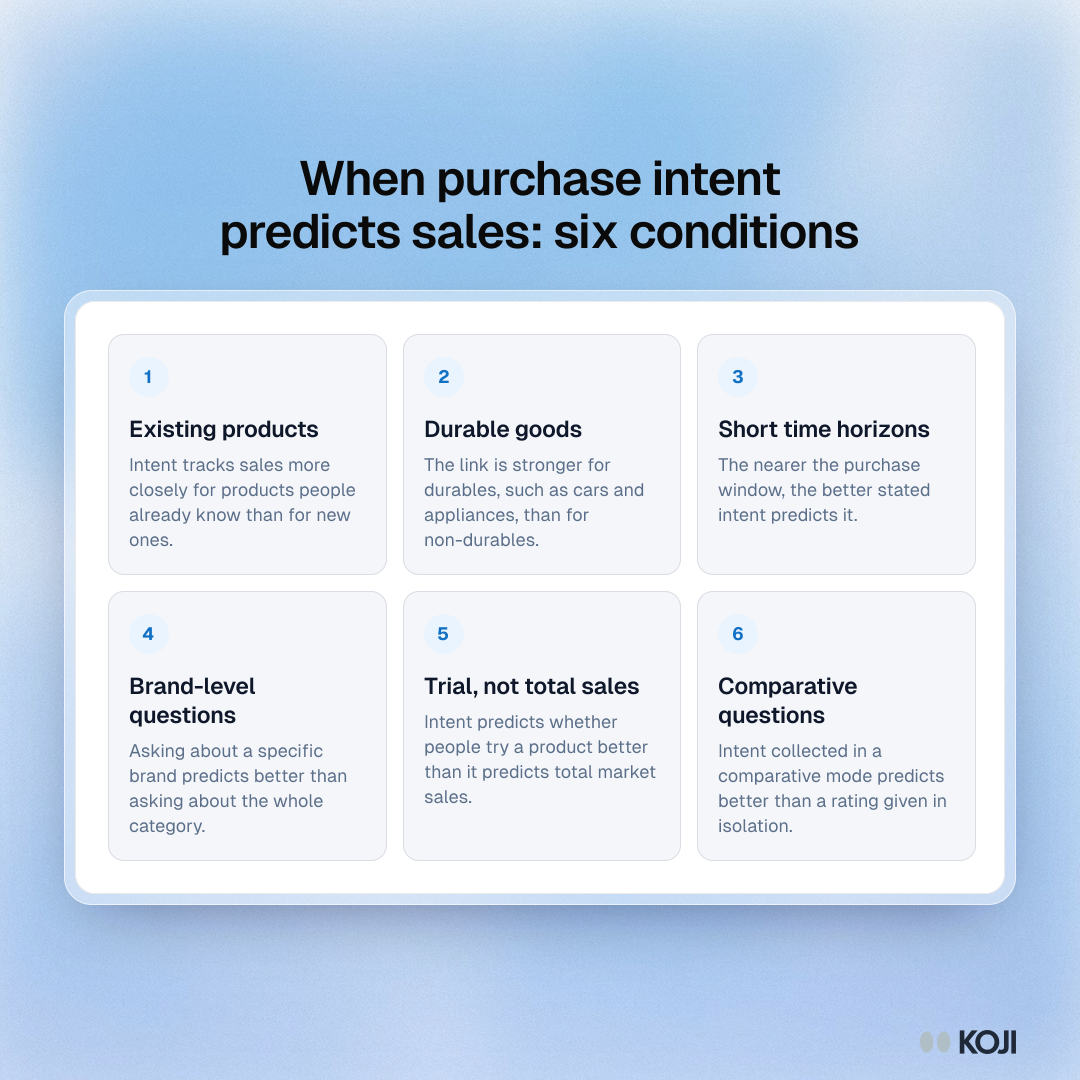
Framework of six conditions under which stated purchase intentions predict real sales best, from Morwitz, Steckel and Gupta's meta-analysis

Framework

When purchase intent predicts sales: six conditions
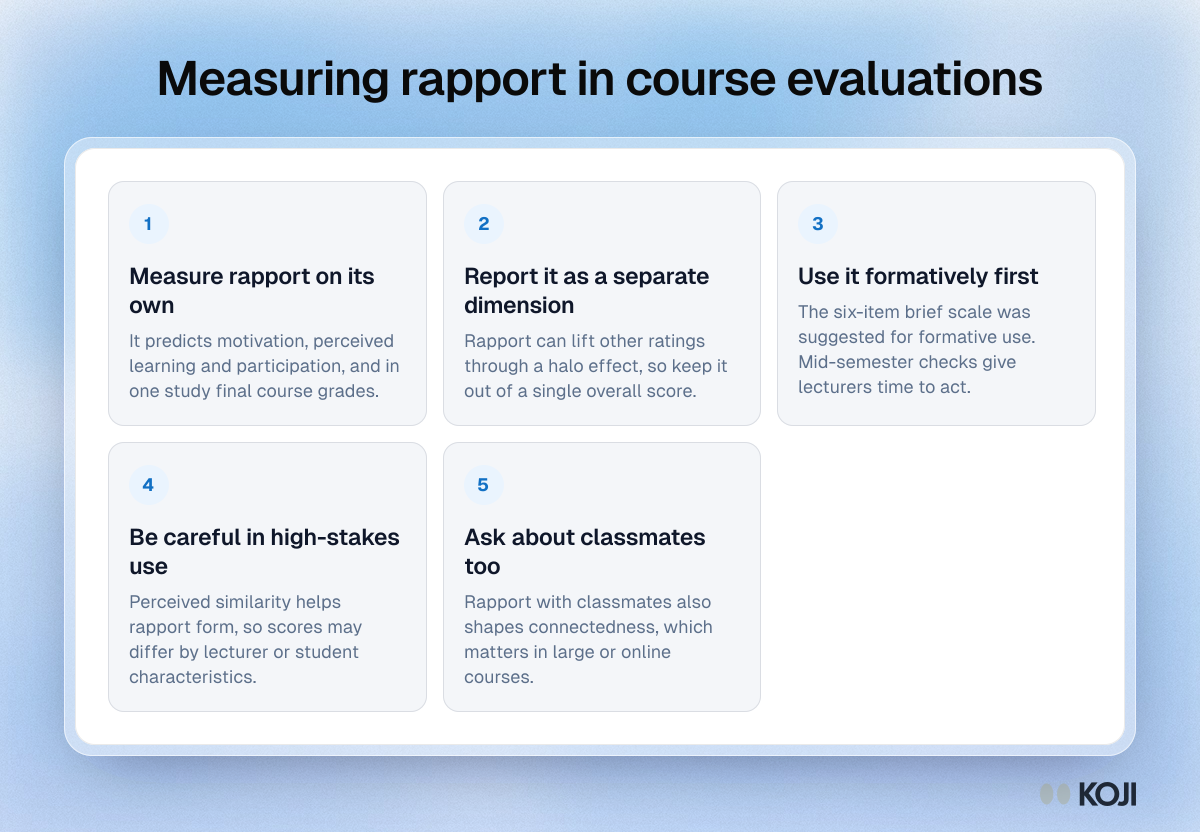
Framework of five rules for rapport in course evaluations, from measuring it on its own to reporting it apart from the overall score.

Framework

Measuring rapport in course evaluations

Table matching four course evaluation goals to a link type, from tracked personal links for coverage to anonymous links for sensitive topics.

Reference table

Personal or anonymous links for course evaluations
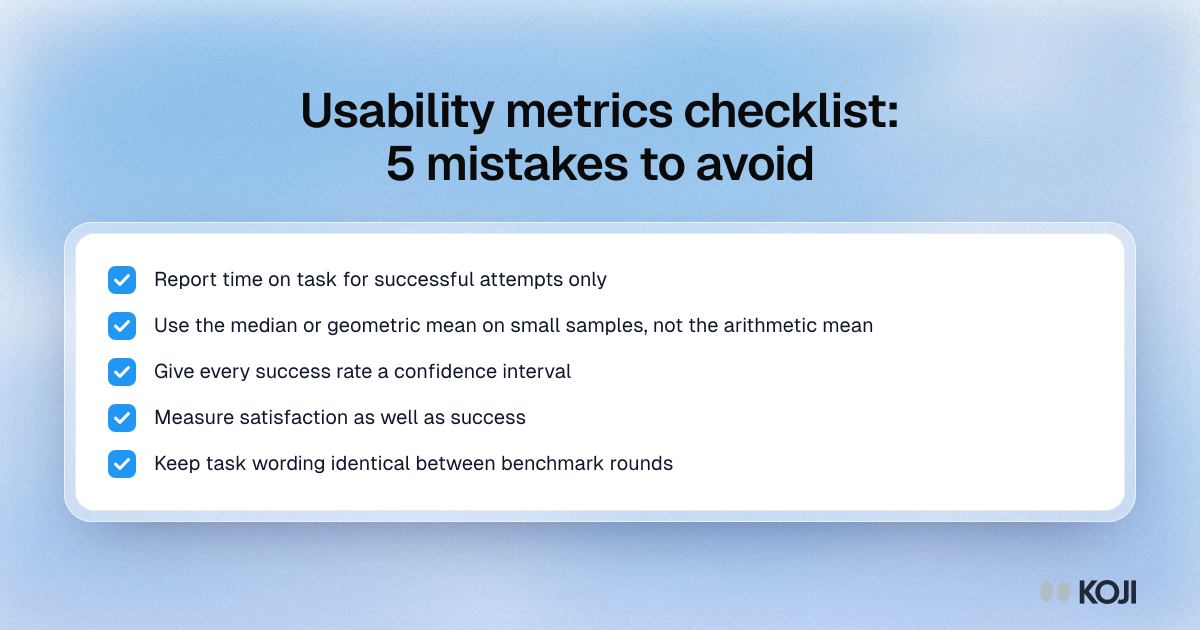
Checklist of five usability metrics mistakes to avoid, from timing failed attempts to changing task wording between benchmark rounds.

Checklist

Usability metrics checklist: 5 mistakes to avoid
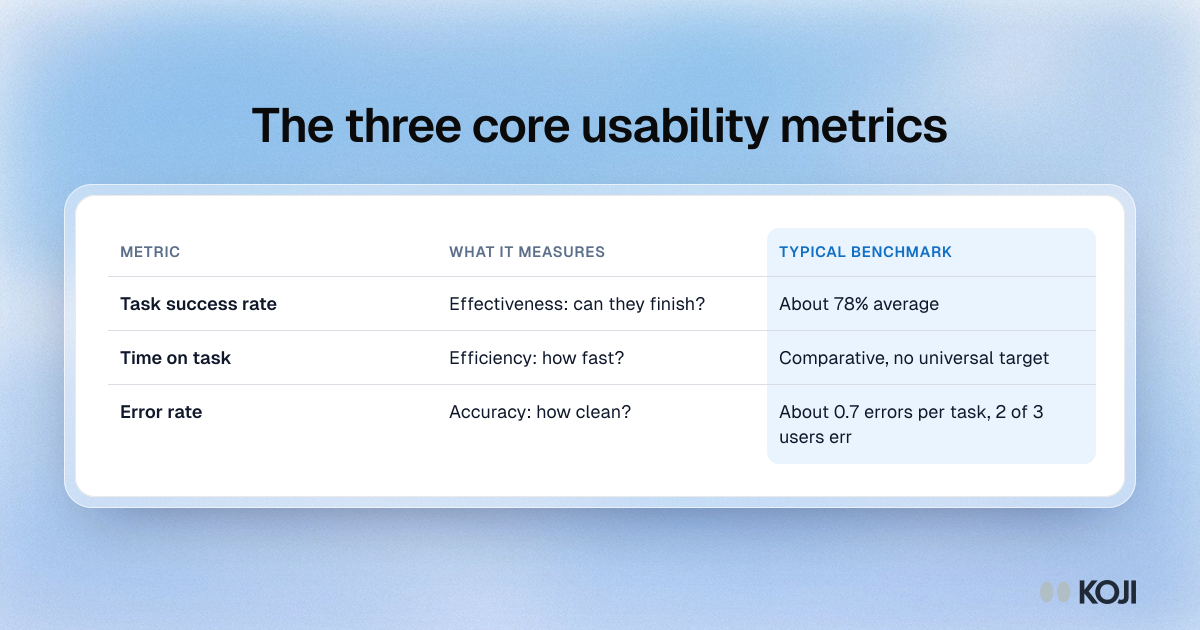
Table of the three core usability metrics with benchmarks: task success rate, about 78%; time on task, comparative; error rate, about 0.7 per task.

Reference table

The three core usability metrics
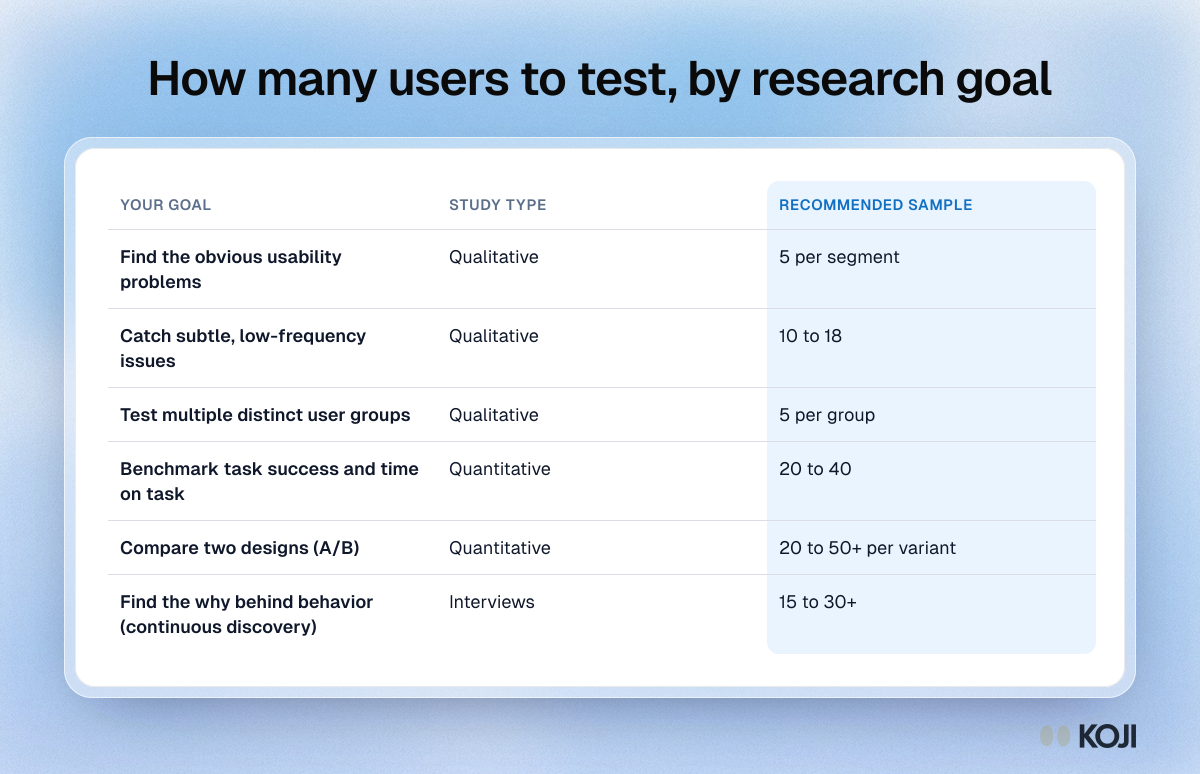
Table of usability test sample sizes by research goal, from 5 users per segment for obvious problems to 20 to 50 plus per variant for design comparisons.

Reference table

How many users to test, by research goal
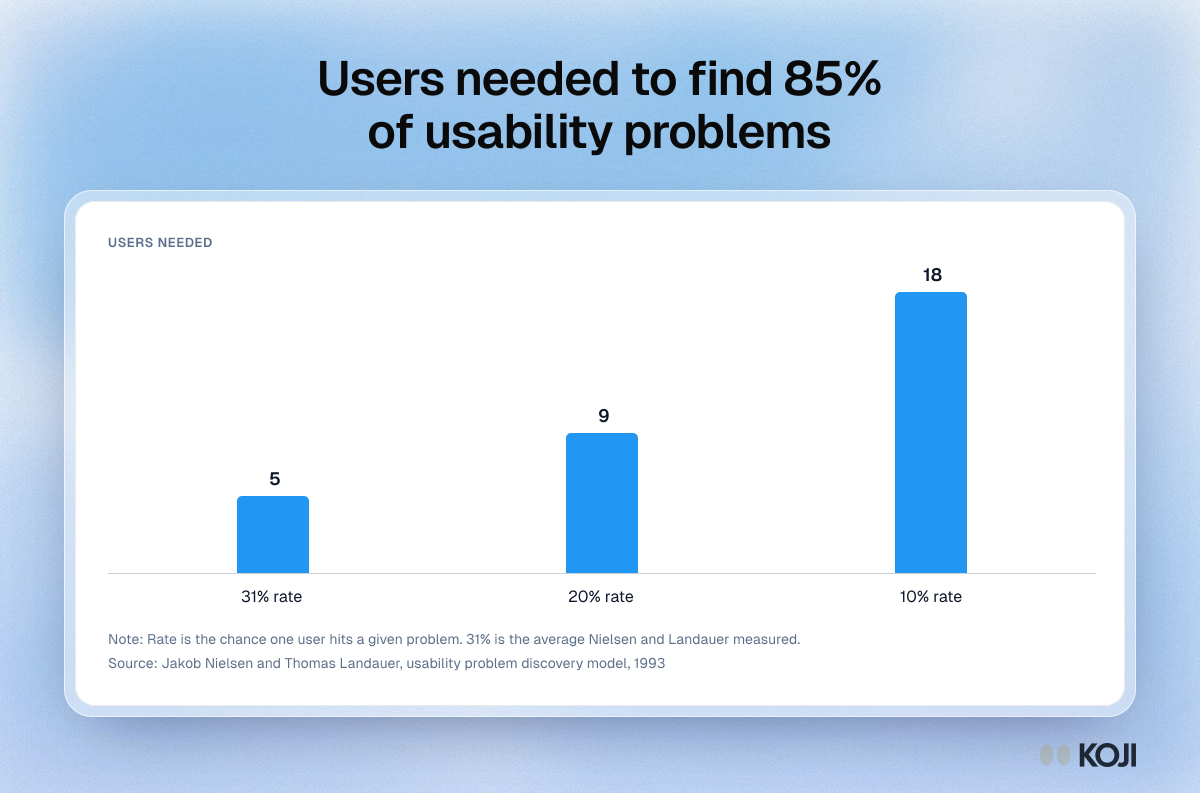
Column chart of the users needed to find 85% of usability problems: 5 users at a 31% discovery rate, 9 at 20% and 18 at 10%.

Column chart

Users needed to find 85% of usability problems
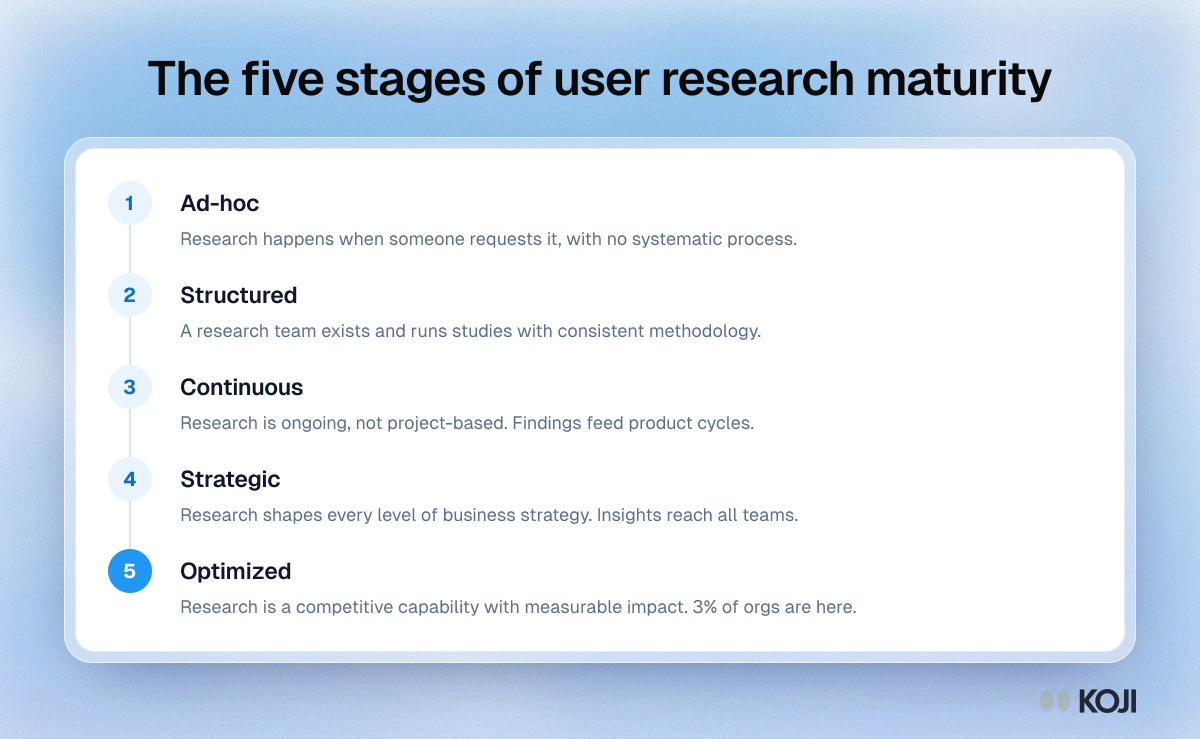
Process showing the five stages of user research maturity: ad-hoc, structured, continuous, strategic and optimized, with 3% of organizations at the top.

Process

The five stages of user research maturity
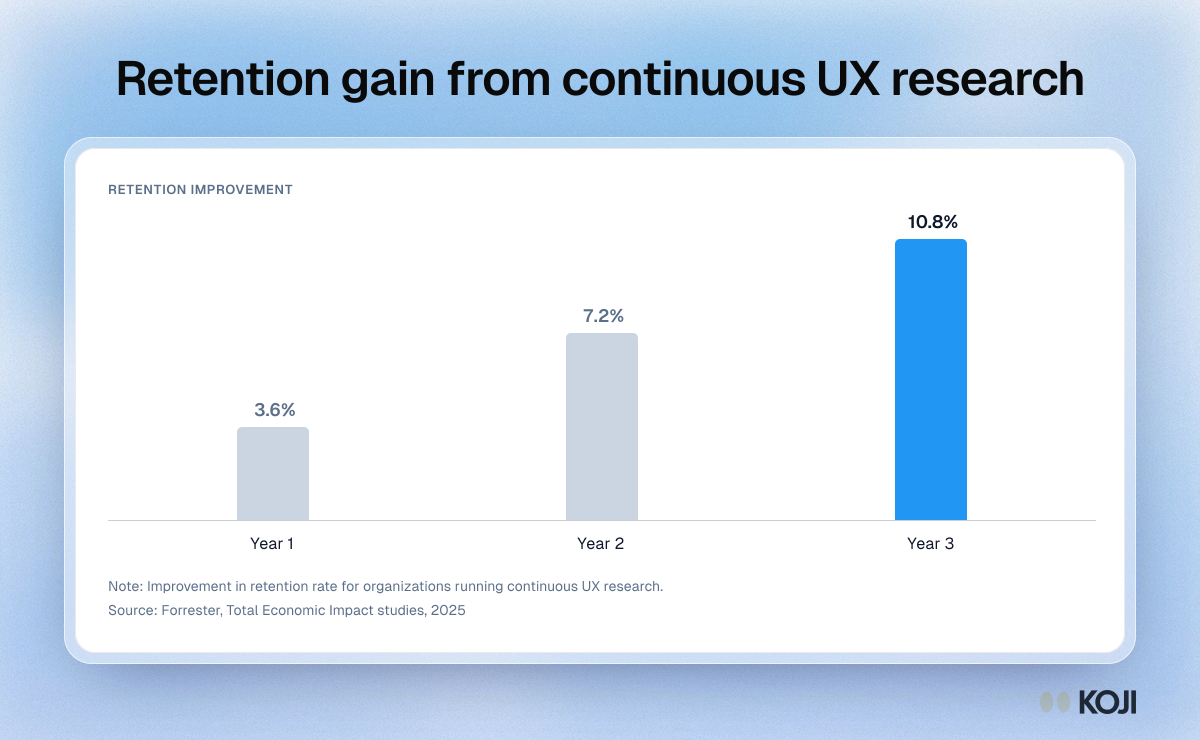
Column chart of retention improvement from continuous UX research: 3.6% in year one, 7.2% in year two and 10.8% in year three.

Column chart

Retention gain from continuous UX research
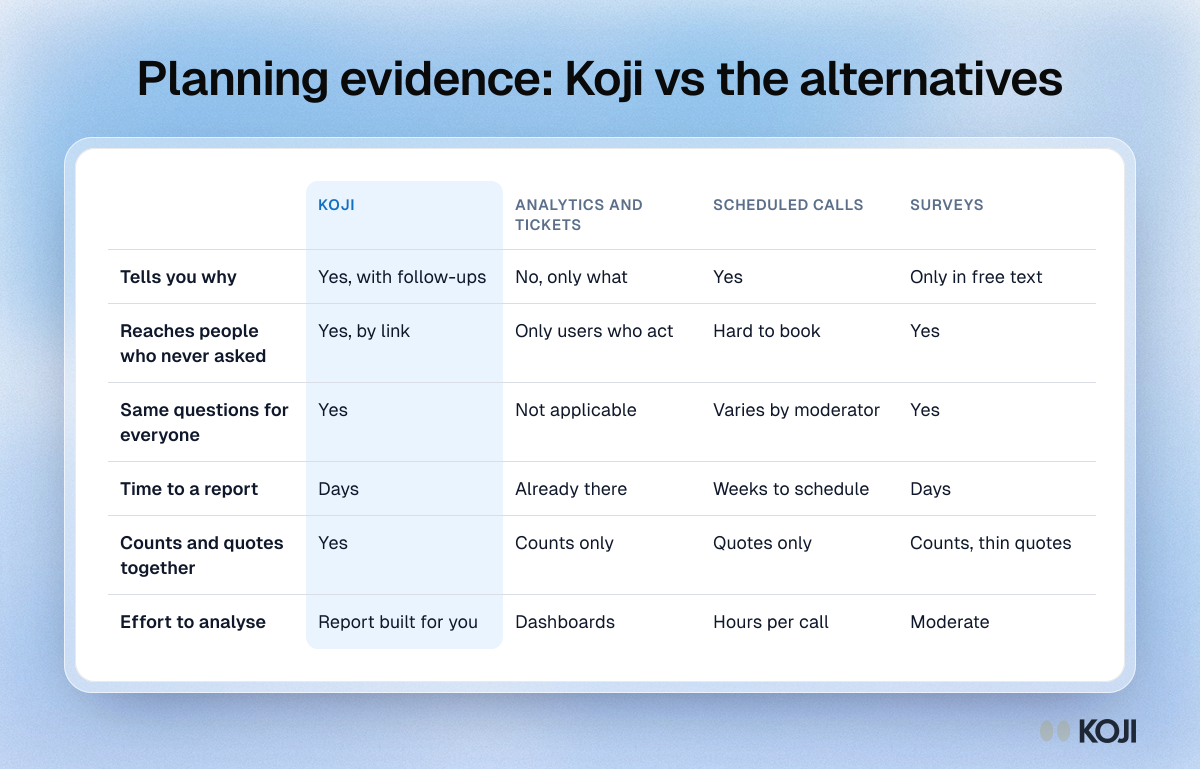
Table comparing Koji, analytics and tickets, scheduled calls and surveys on why, reach, consistency, speed, counts with quotes and analysis effort.

Reference table

Planning evidence: Koji vs the alternatives
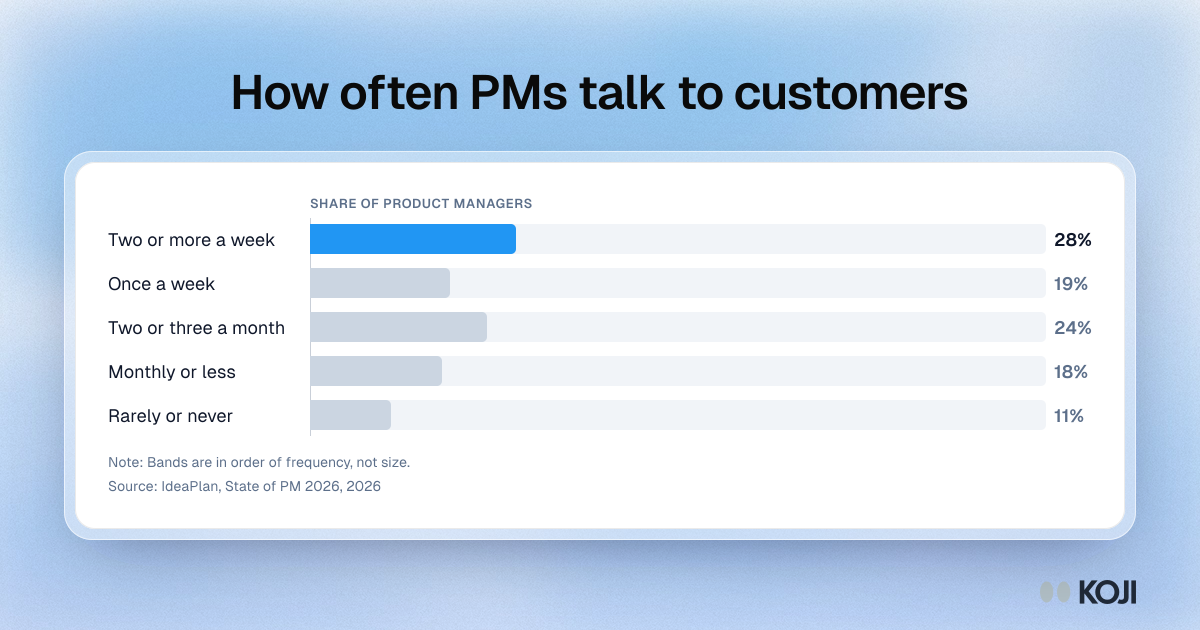
Bar chart of how often PMs talk to customers: 28% twice a week or more, 19% weekly, 24% two or three a month, 18% monthly or less, 11% rarely or never.

Bar chart

How often PMs talk to customers
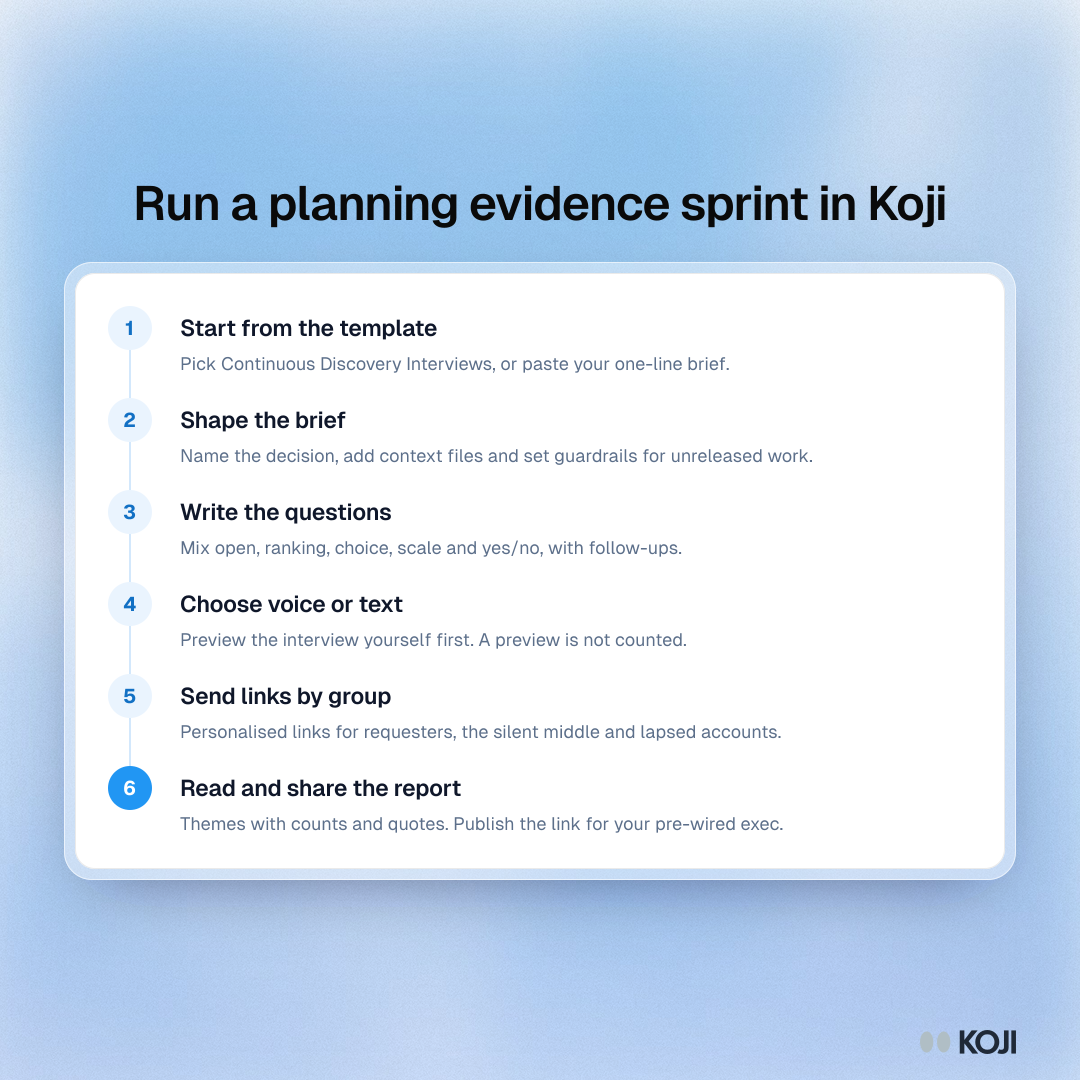
Process of six steps to run a quarterly planning evidence sprint in Koji: template, brief, questions, voice or text, links by group, and the report.

Process

Run a planning evidence sprint in Koji
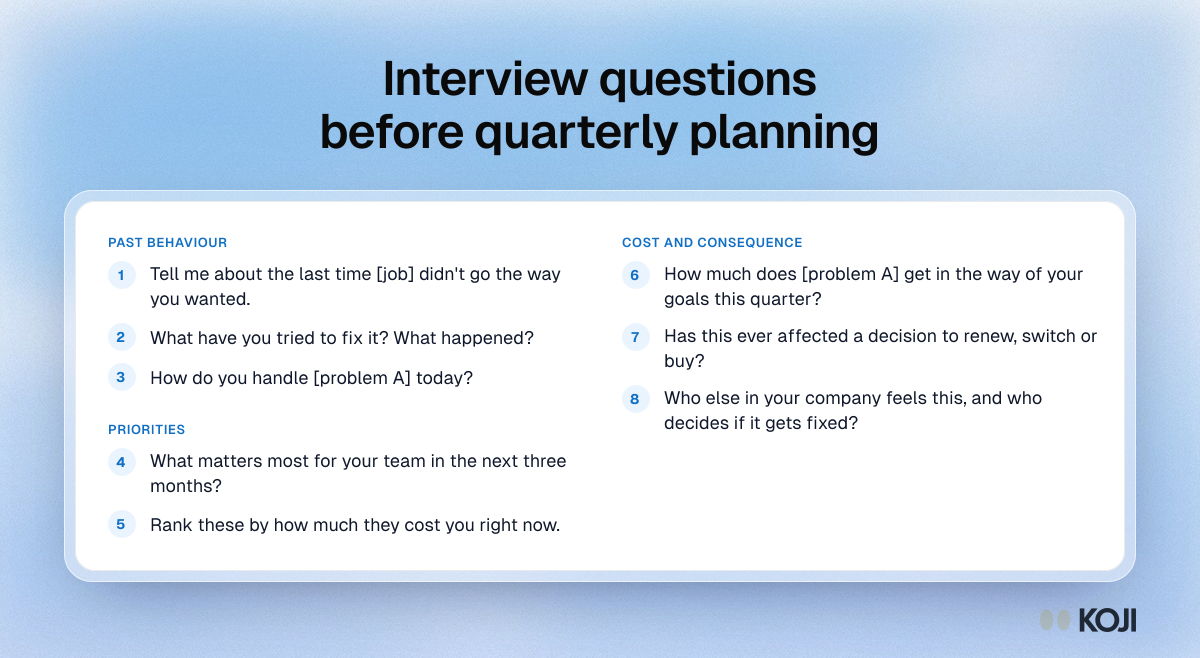
Question bank of eight interview questions for a quarterly planning evidence sprint, grouped into past behaviour, priorities, and cost and consequence.

Question bank

Interview questions before quarterly planning
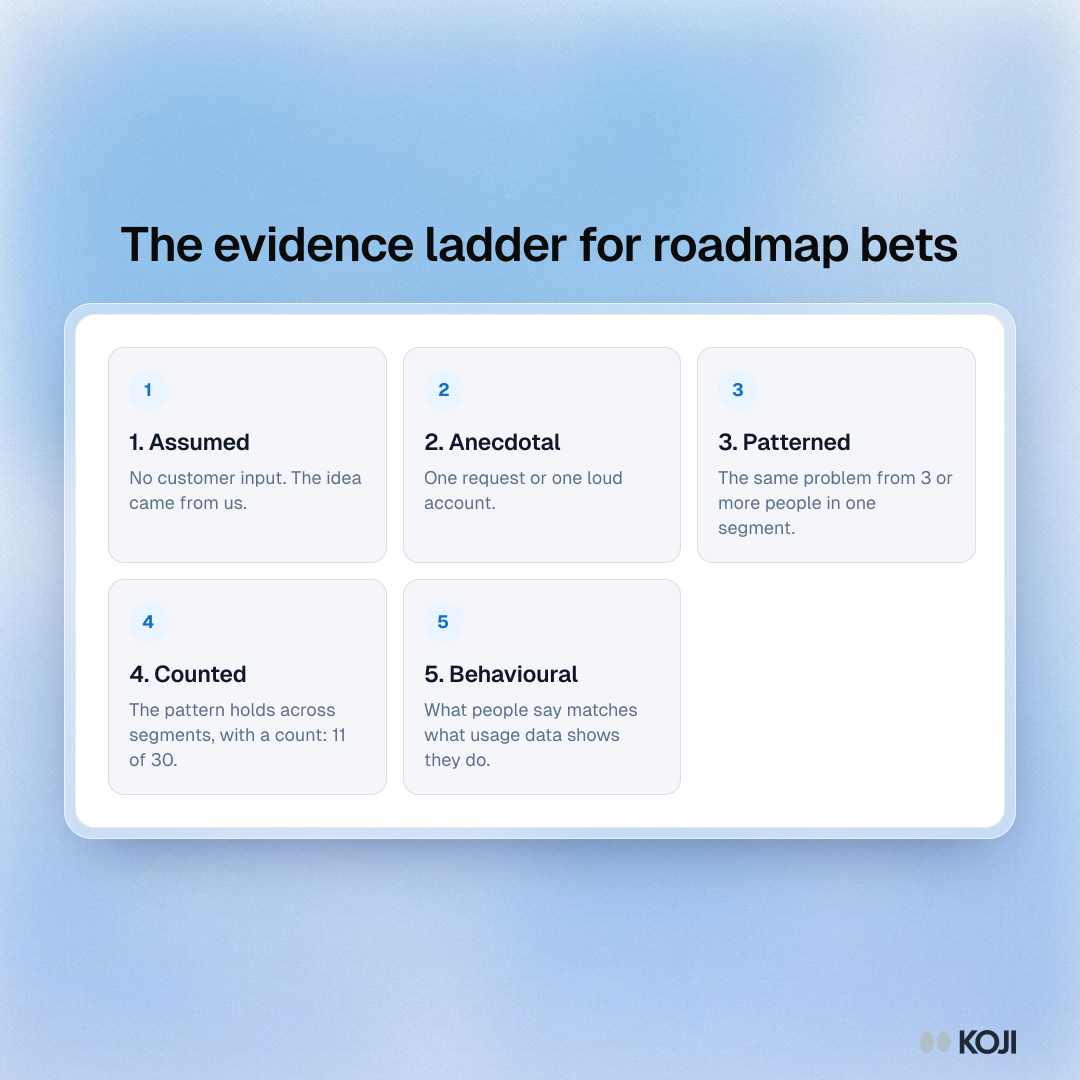
Framework showing five evidence grades for a roadmap bet, from assumed and anecdotal through patterned and counted to behavioural.

Framework

The evidence ladder for roadmap bets
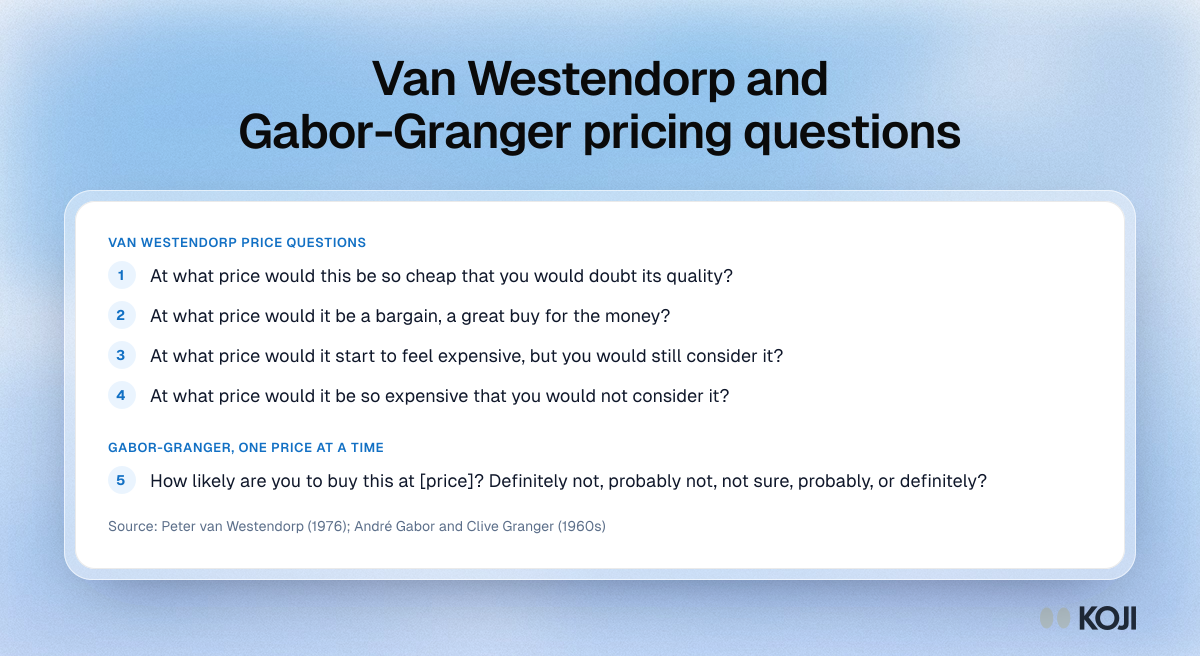
Question bank with the four Van Westendorp price questions and the Gabor-Granger purchase intent question with its five-point scale

Question bank

Van Westendorp and Gabor-Granger pricing questions
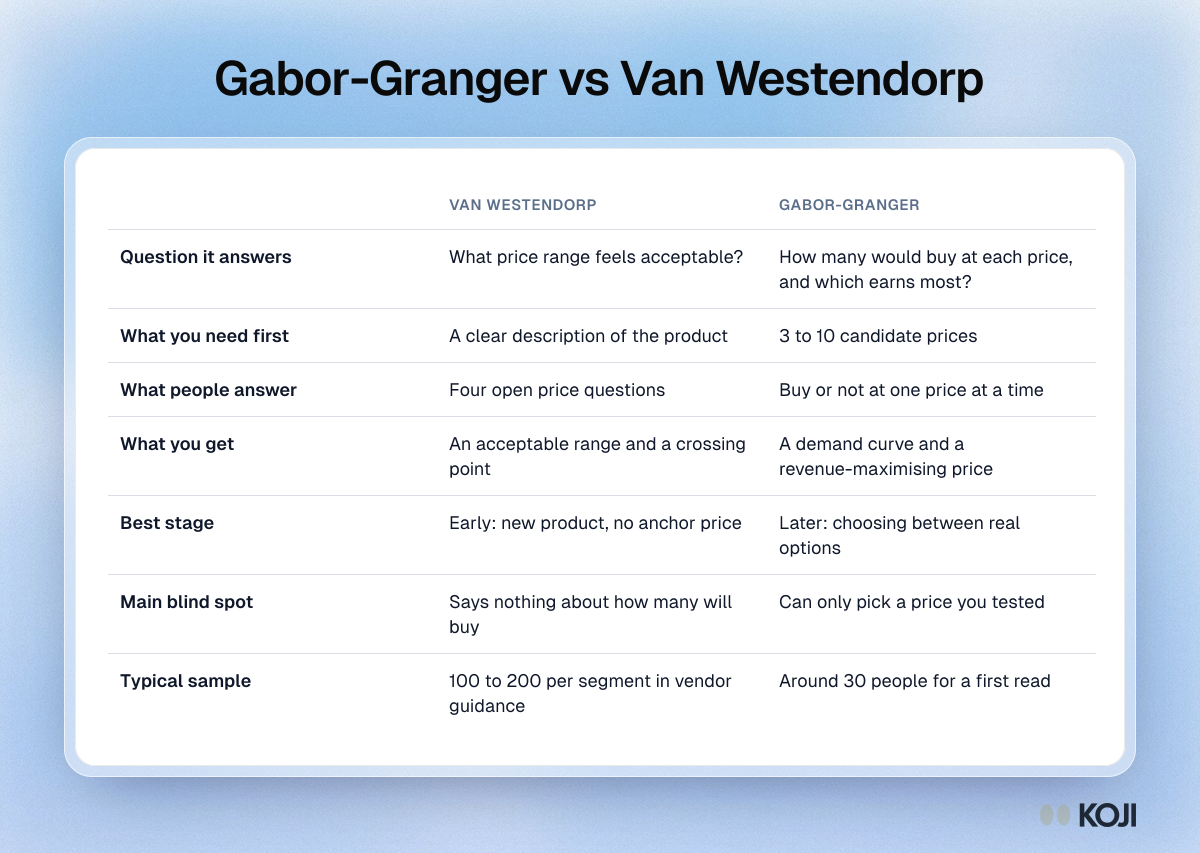
Table comparing Van Westendorp and Gabor-Granger on the question each answers, inputs, outputs, best stage, blind spot and sample size

Reference table

Gabor-Granger vs Van Westendorp
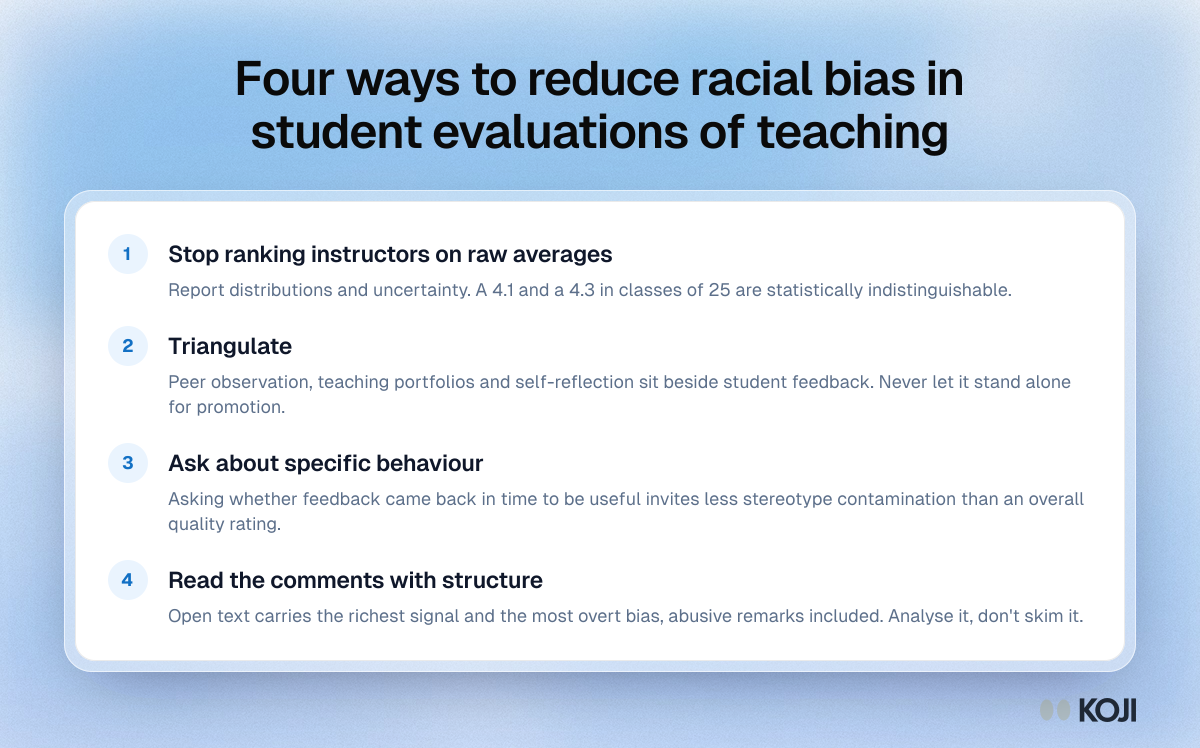
List of four changes that reduce racial bias in student evaluations of teaching: no average rankings, triangulation, specific items, structured reading.

Guide

Four ways to reduce racial bias in student evaluations of teaching
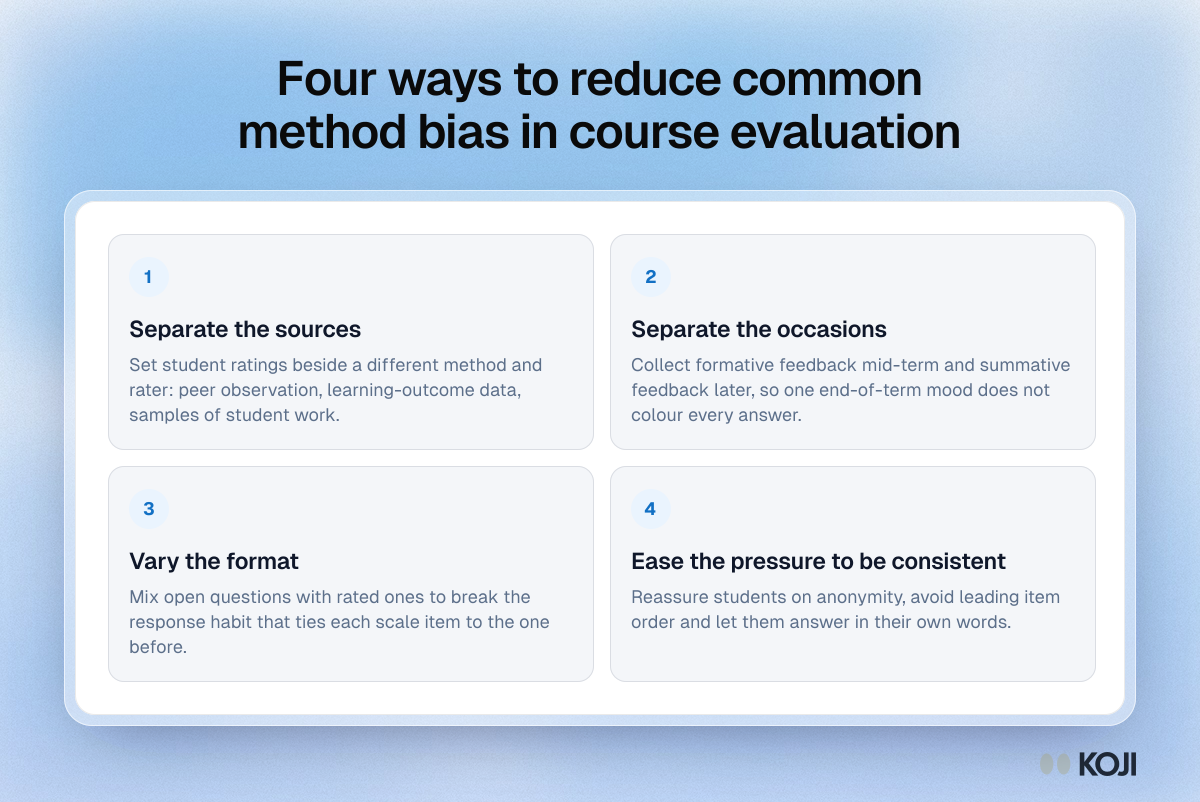
Framework of four ways to reduce common method variance in course evaluation: separate sources and occasions, vary the format, ease consistency pressure.

Framework

Four ways to reduce common method bias in course evaluation
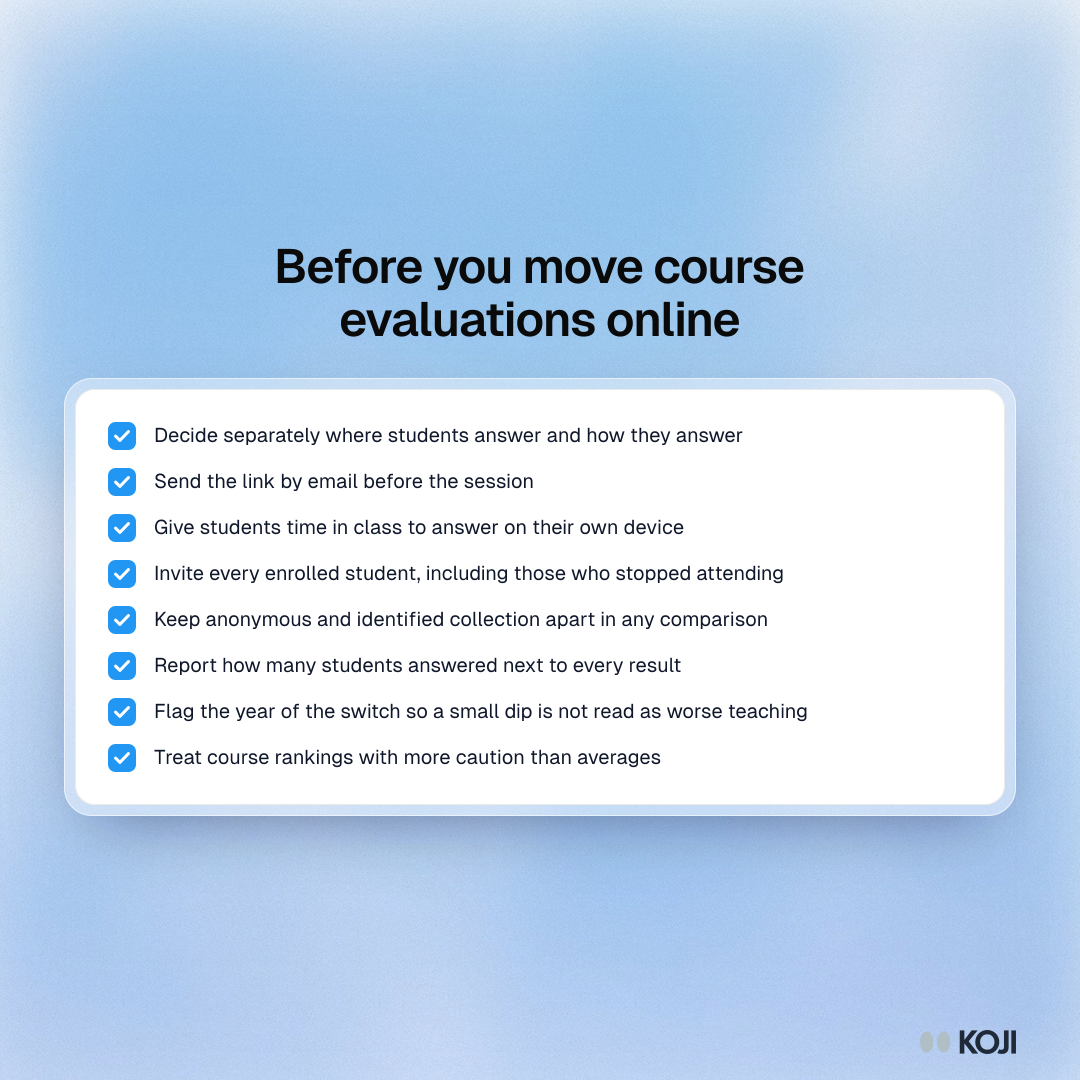
Checklist of eight steps for moving course evaluations online: separate setting from method, give class time, email first, reach absent students, report counts

Checklist

Before you move course evaluations online
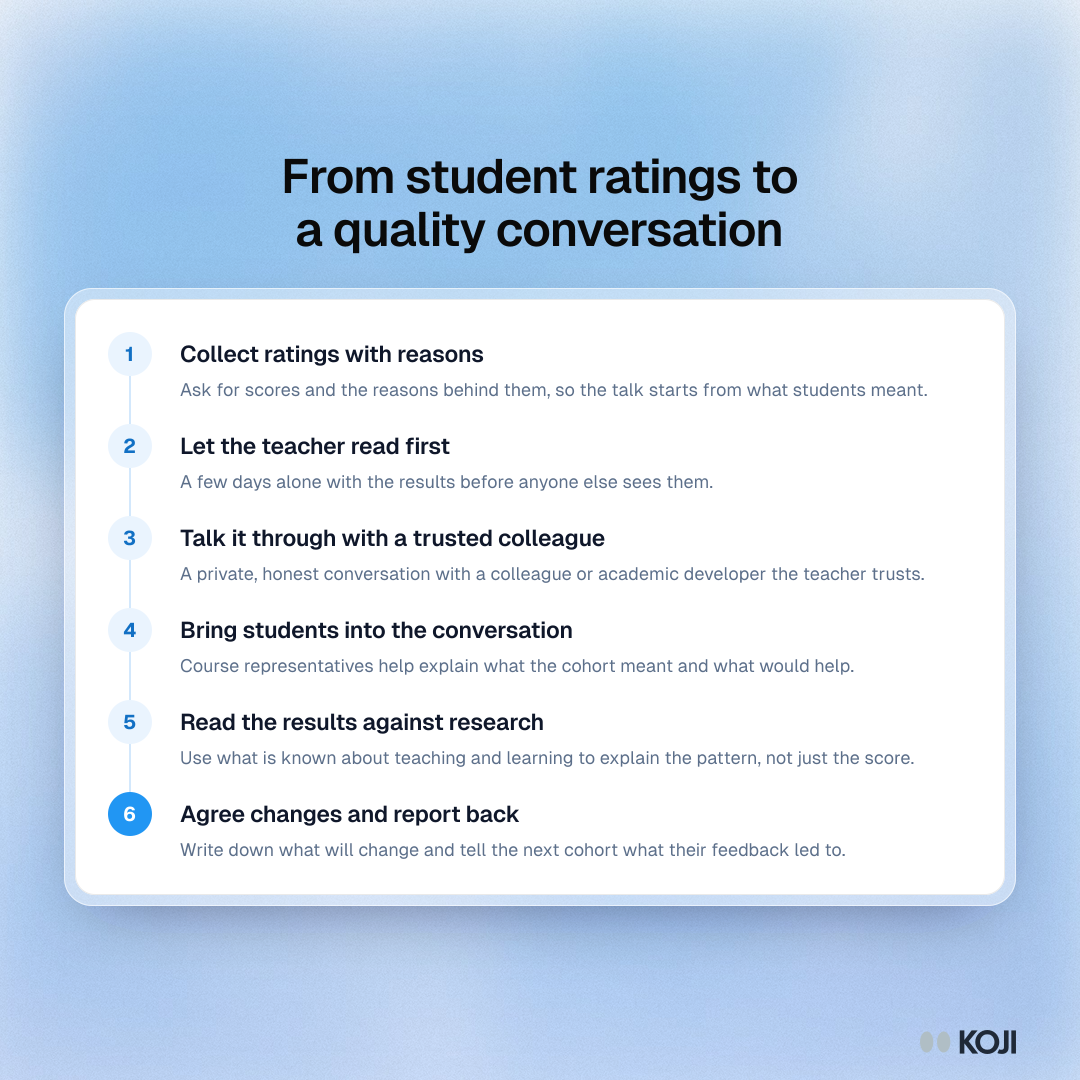
Six-step process from student ratings to a quality conversation: collect, read first, talk with a colleague, involve students, use research, report back

Process

From student ratings to a quality conversation
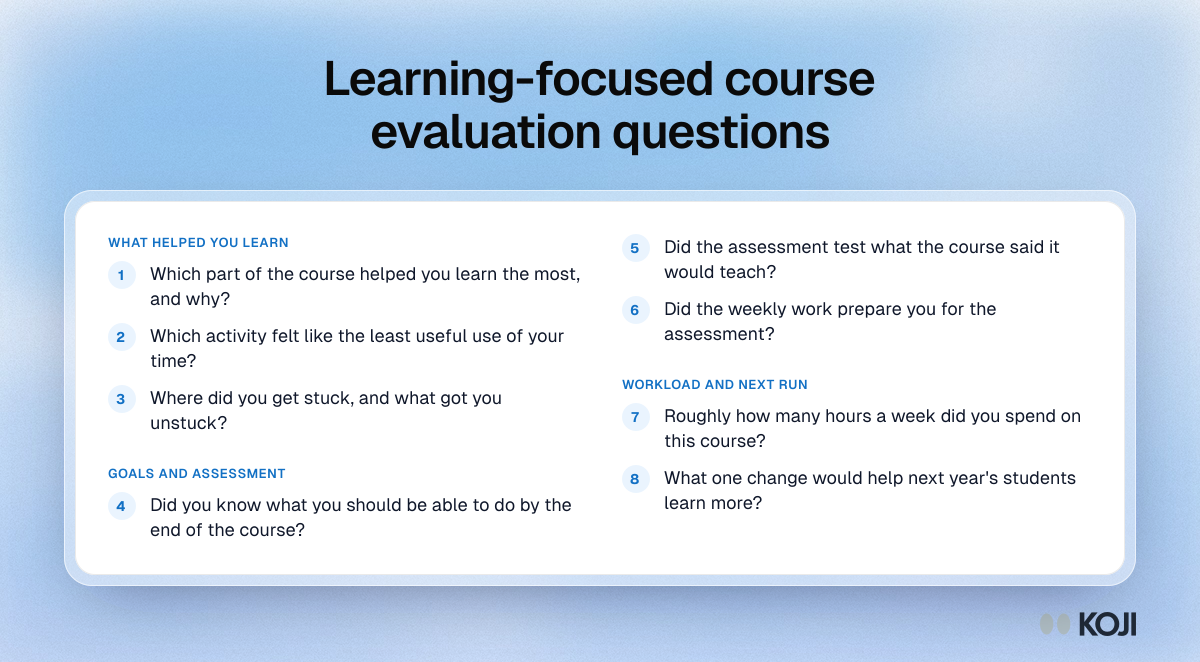
Question bank of eight learning-focused course evaluation questions in three themes: what helped you learn, goals and assessment, and workload
Question bank

Learning-focused course evaluation questions

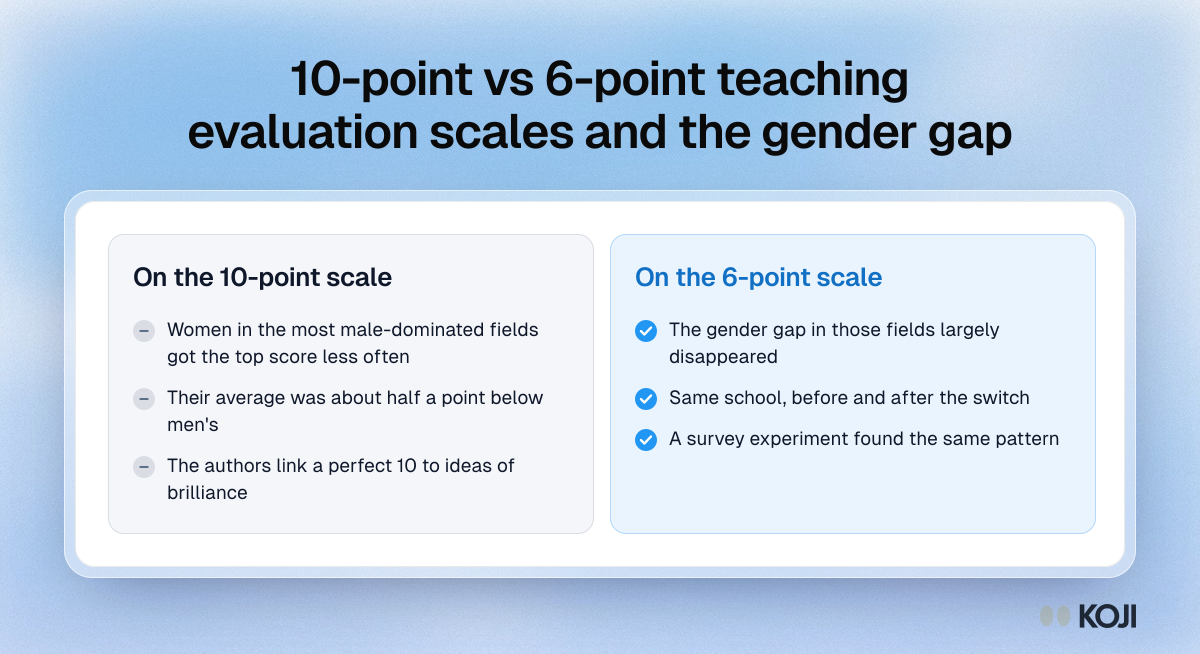
Comparison of 10-point and 6-point teaching scales: women in male-dominated fields scored lower on 10 points, a gap that largely disappeared on 6

Comparison

10-point vs 6-point teaching evaluation scales and the gender gap
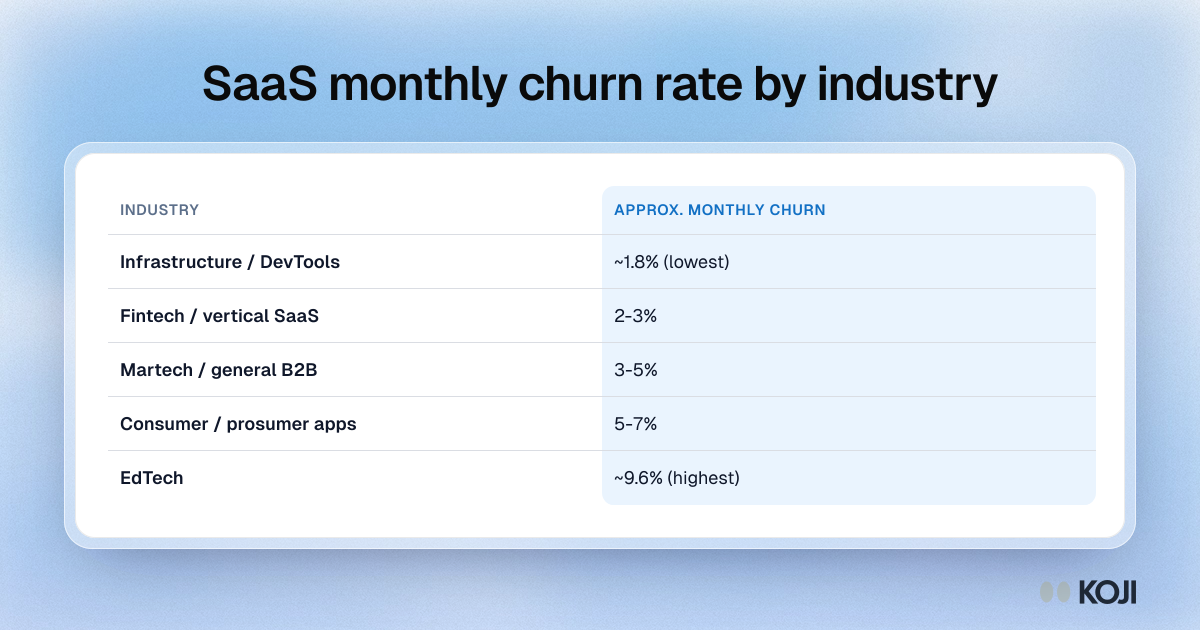
Table of approximate SaaS monthly churn by industry, from about 1.8% for infrastructure and DevTools to about 9.6% for EdTech.

Reference table

SaaS monthly churn rate by industry
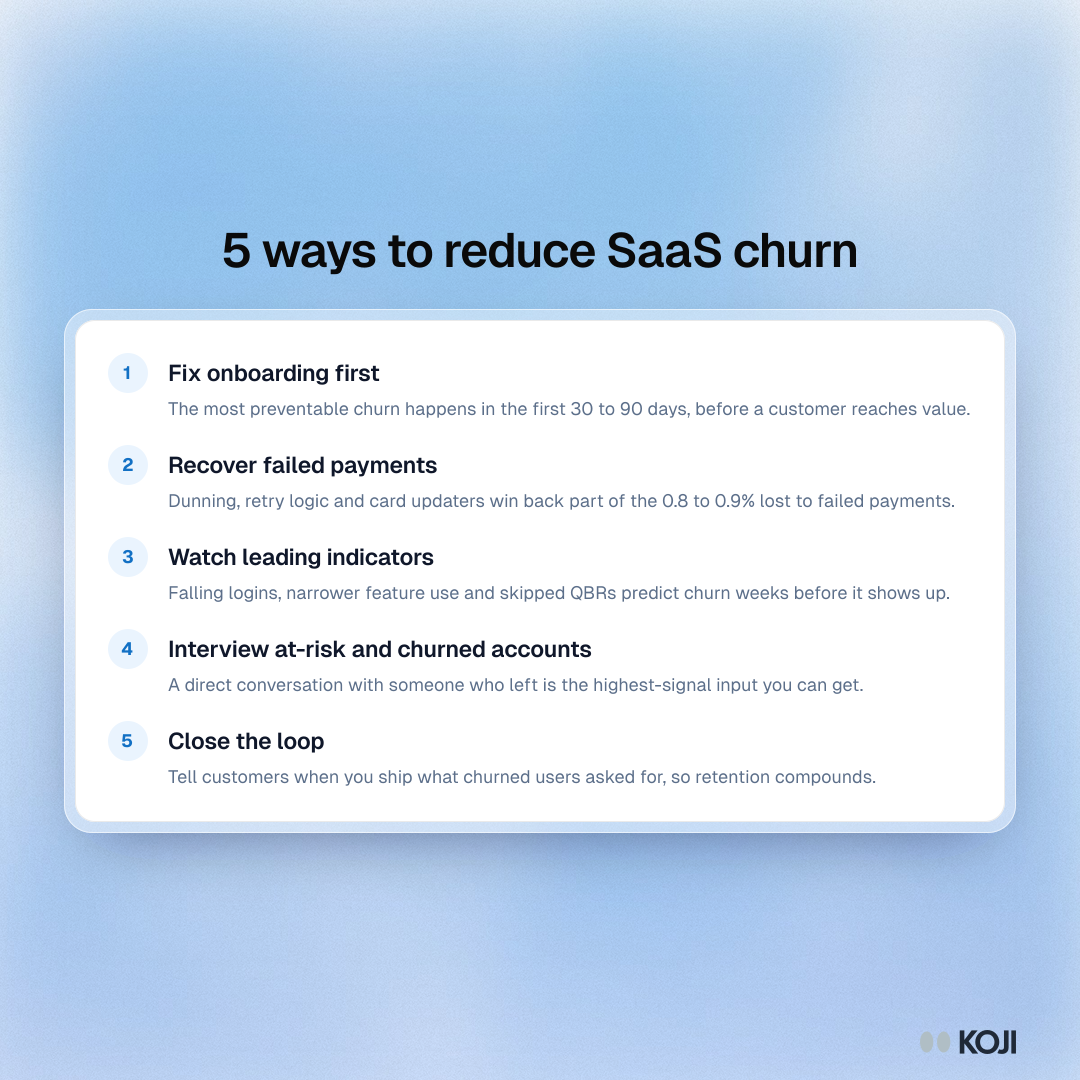
Listicle of five ways to reduce SaaS churn: fix onboarding, recover failed payments, watch leading indicators, interview churned accounts and close the loop.

Guide

5 ways to reduce SaaS churn

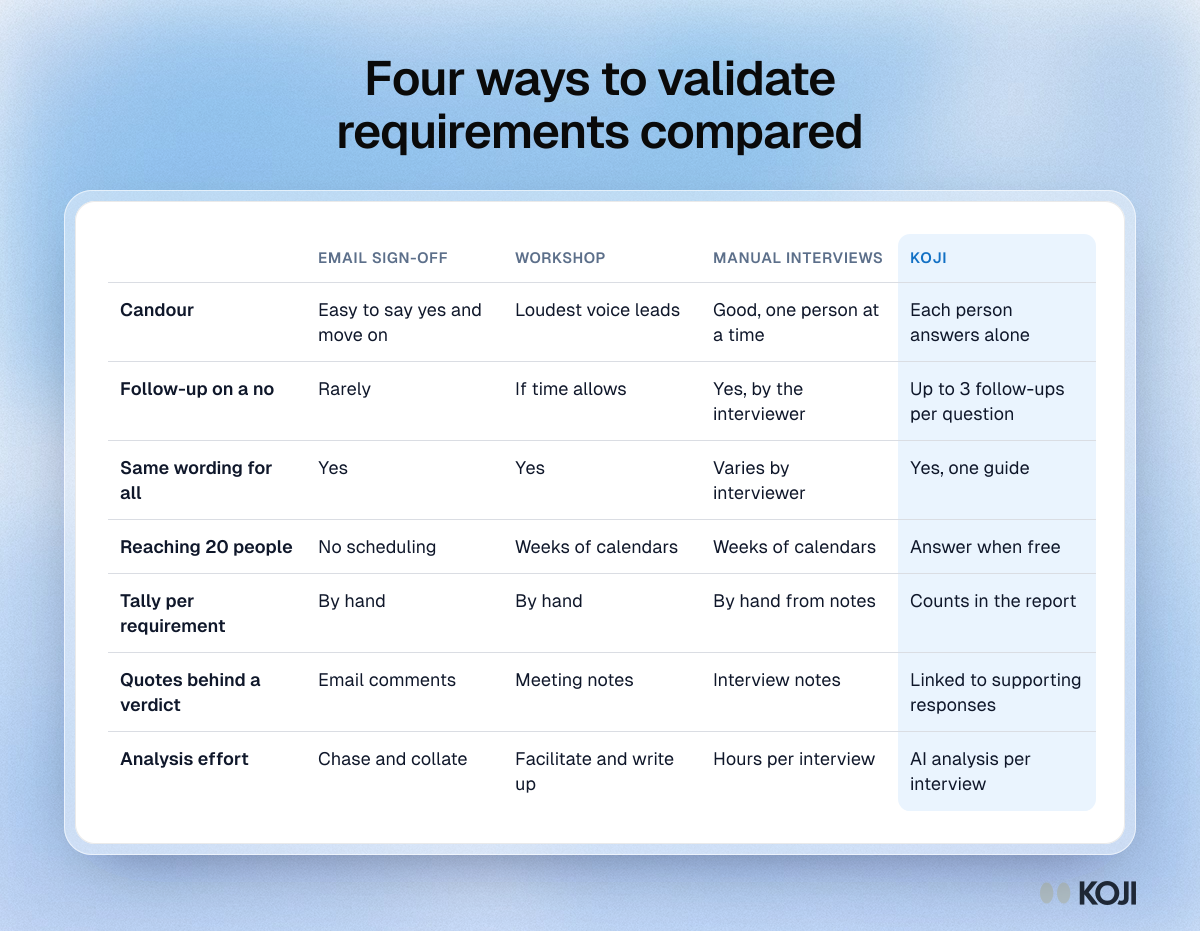
Table comparing email sign-off, workshops, manual interviews and Koji for validating requirements on candour, follow-up, reach and analysis effort.

Reference table

Four ways to validate requirements compared
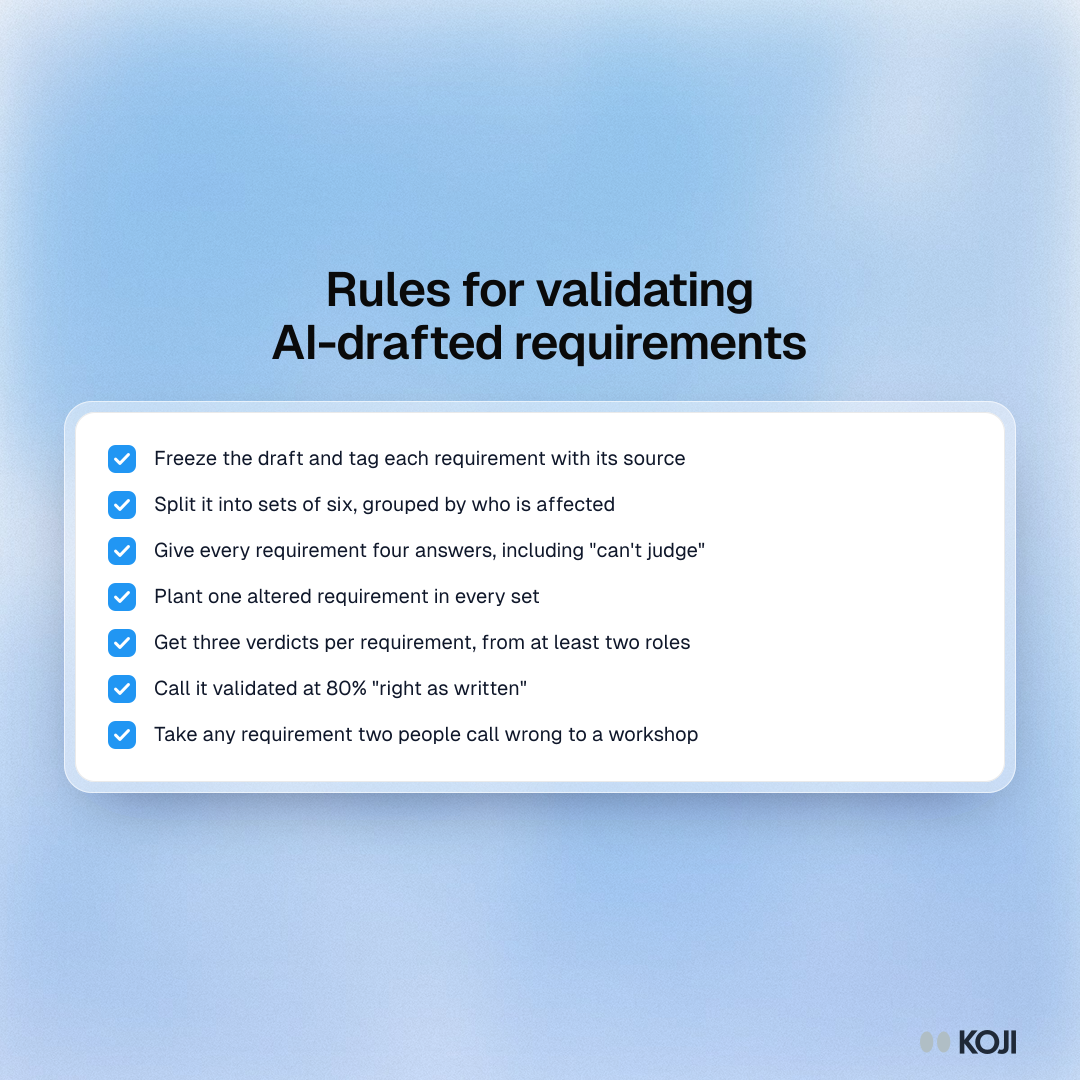
Checklist of seven rules for validating AI-drafted requirements with stakeholders, from sets of six to a workshop for disputes.
Checklist

Rules for validating AI-drafted requirements

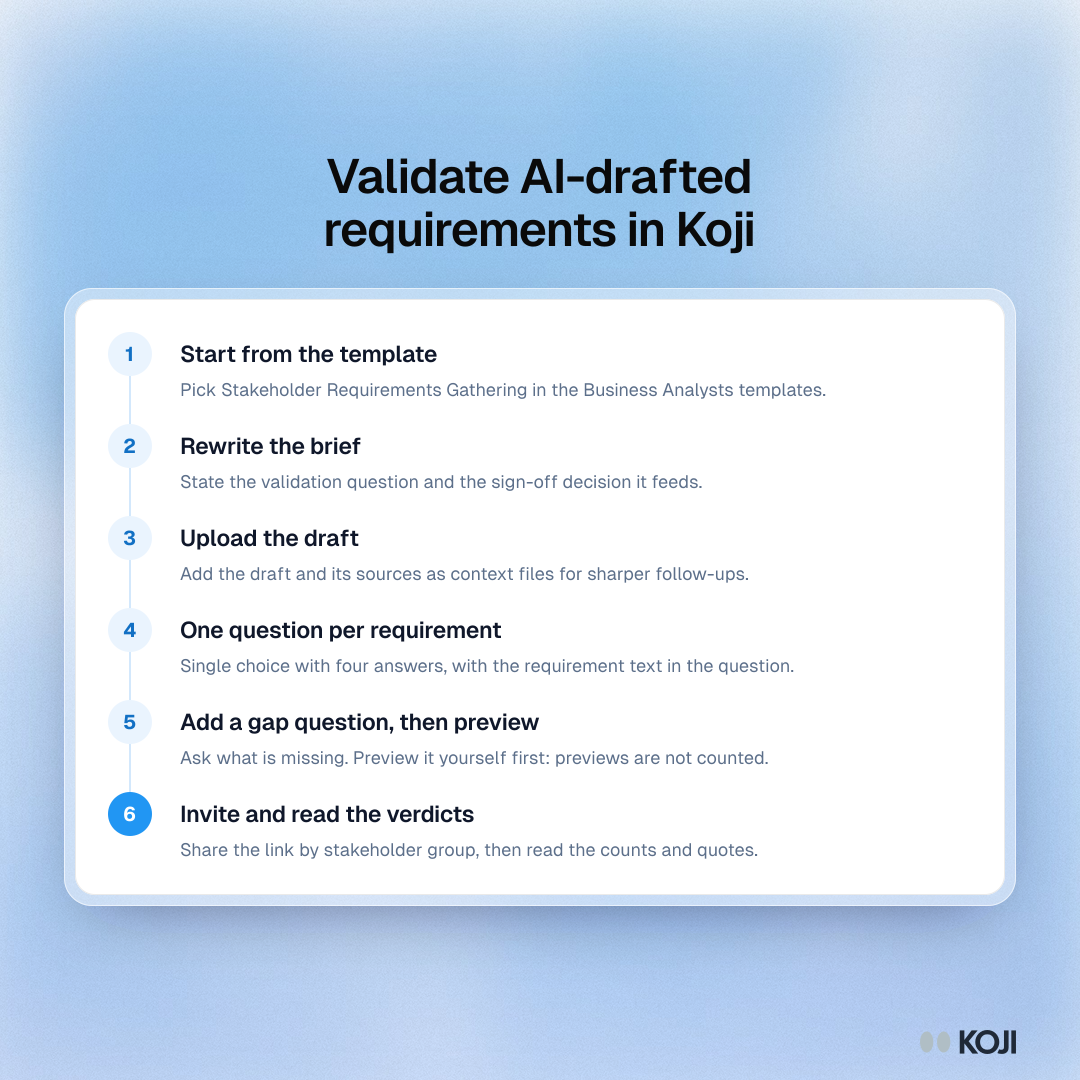
Process showing six steps to run read-back validation of AI-drafted requirements in Koji, from the template to the verdict table.

Process

Validate AI-drafted requirements in Koji
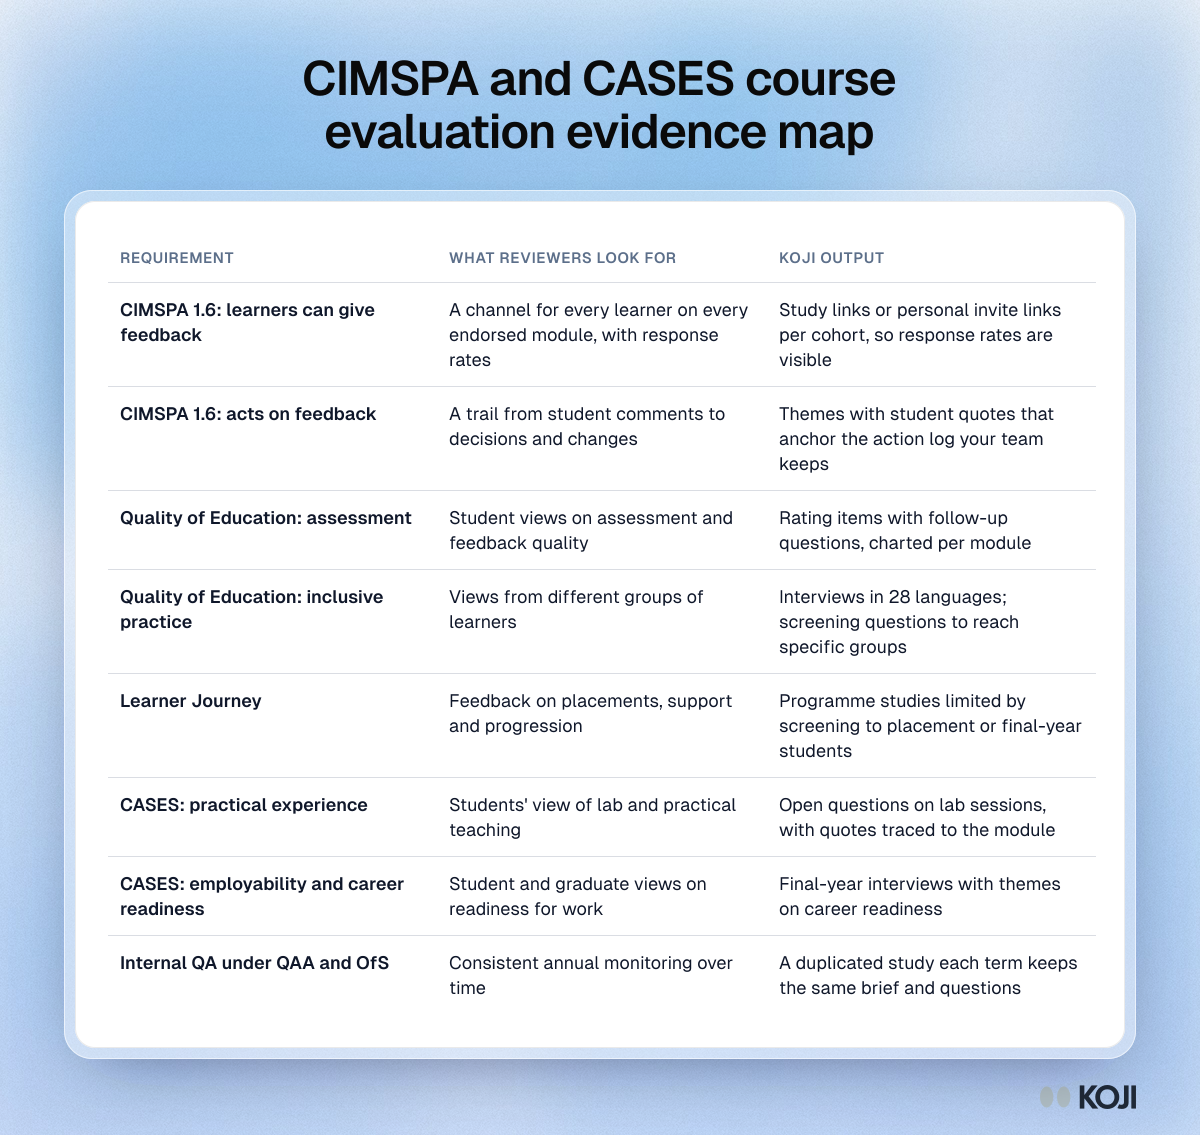
Table mapping CIMSPA and CASES requirements to the evidence reviewers look for and the matching Koji outputs for sport degree courses

Reference table

CIMSPA and CASES course evaluation evidence map
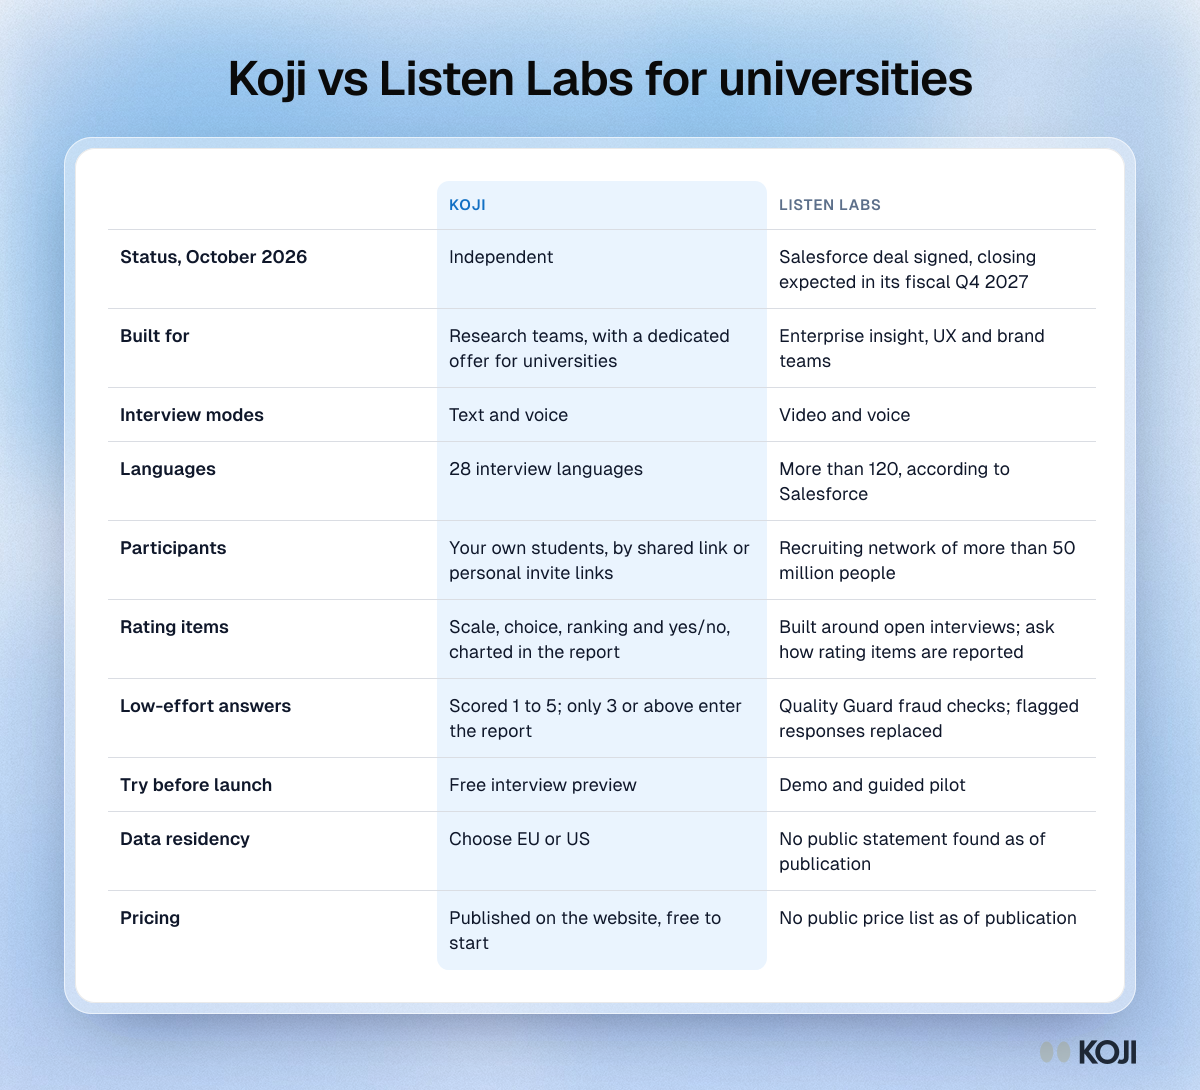
Table comparing Koji and Listen Labs for university feedback on status, interview modes, languages, participants, quality checks, data residency and pricing

Reference table

Koji vs Listen Labs for universities
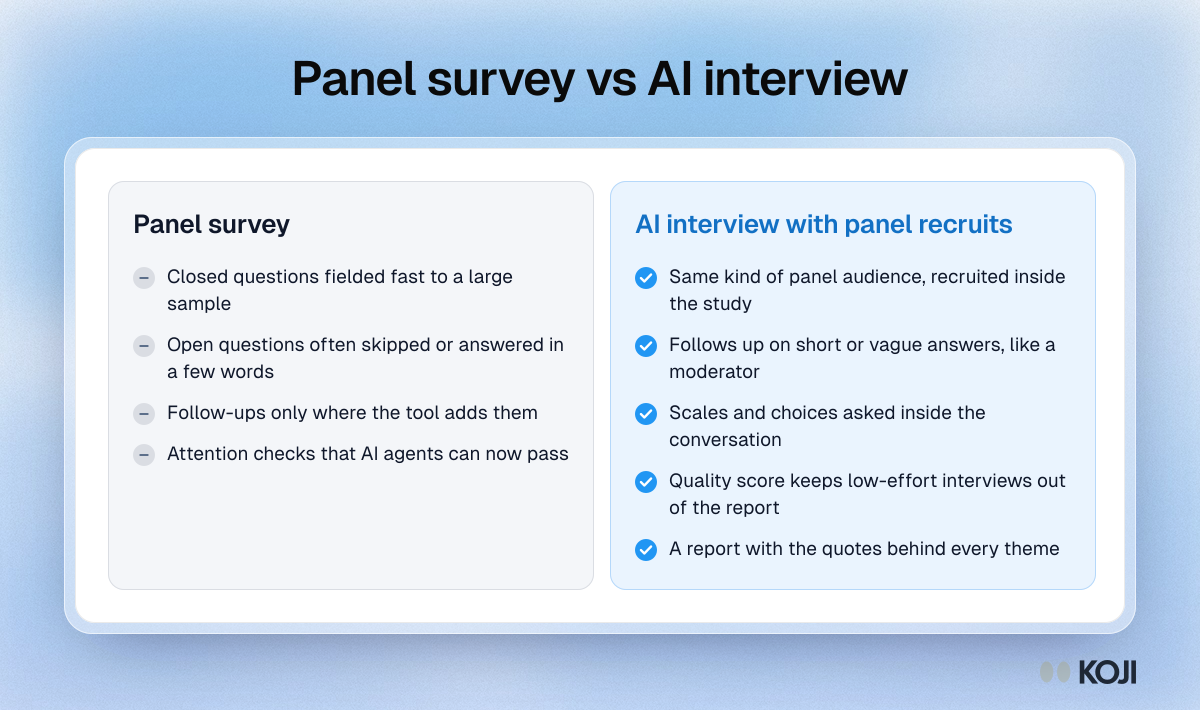
Comparison of a panel survey and an AI interview with panel recruits, showing how each handles open answers, follow-ups and analysis

Comparison

Panel survey vs AI interview
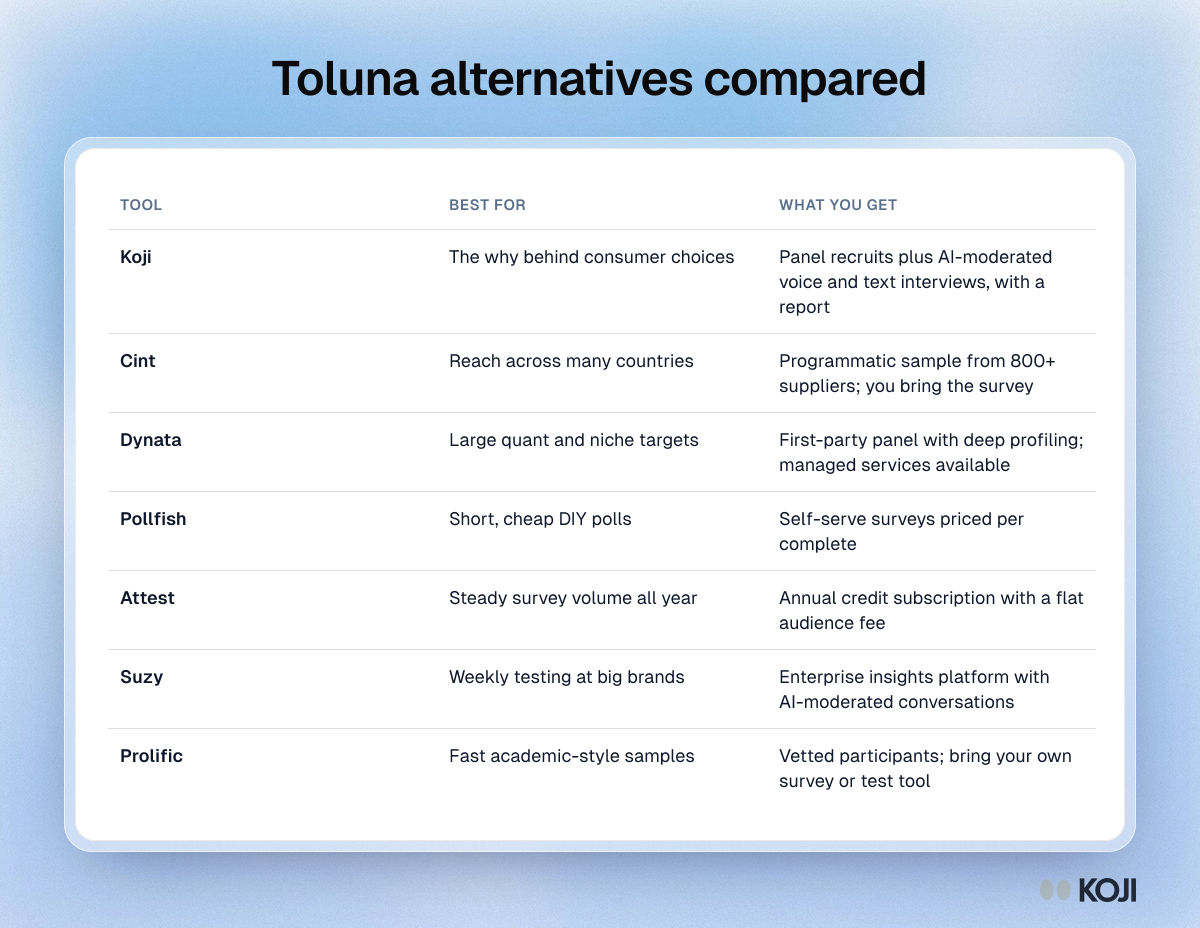
Table comparing seven Toluna alternatives, Koji, Cint, Dynata, Pollfish, Attest, Suzy and Prolific, by what each is best for and what you get

Reference table

Toluna alternatives compared
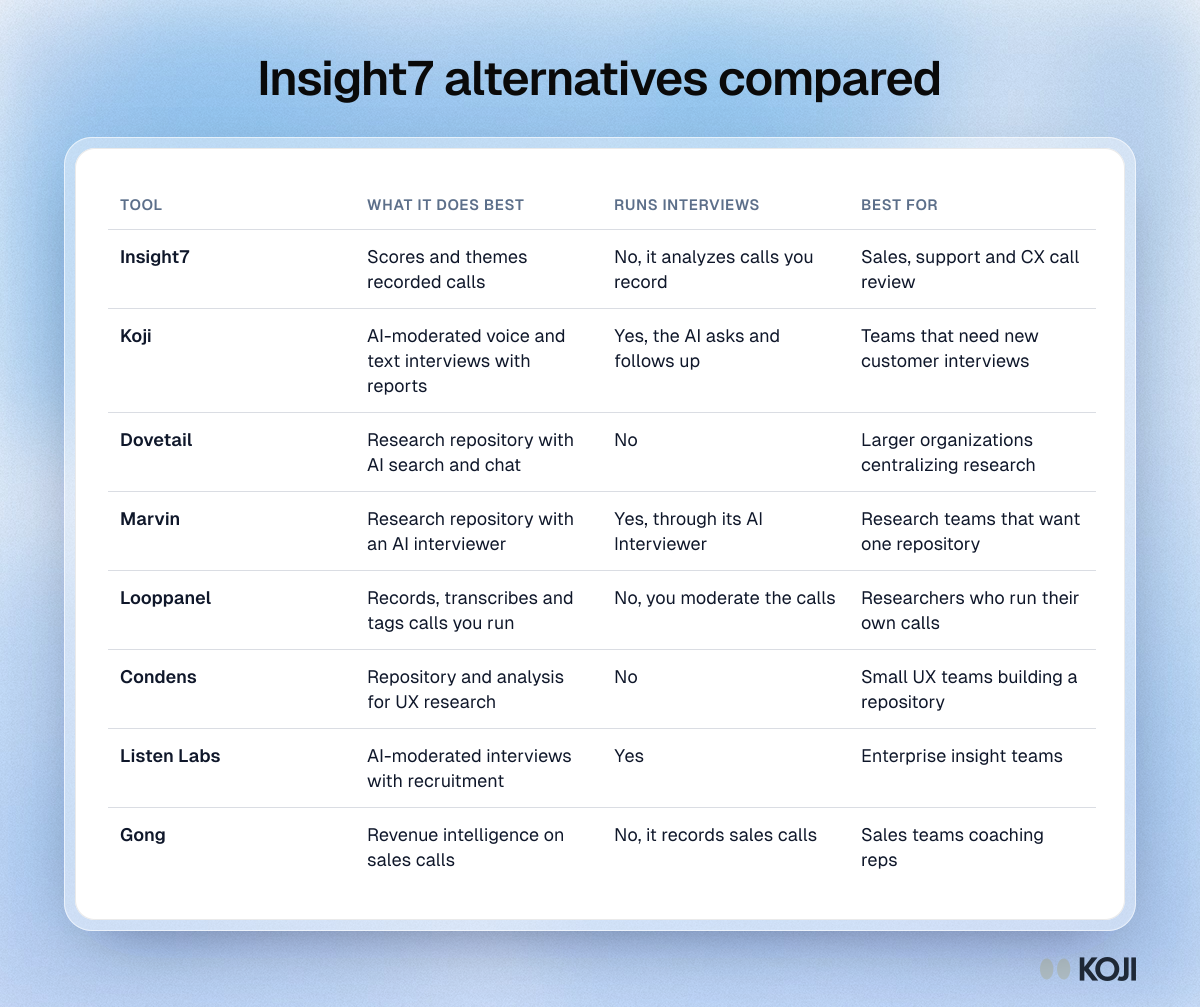
Table comparing Insight7 with seven alternatives by what each does best, whether it runs interviews and who it suits

Reference table

Insight7 alternatives compared
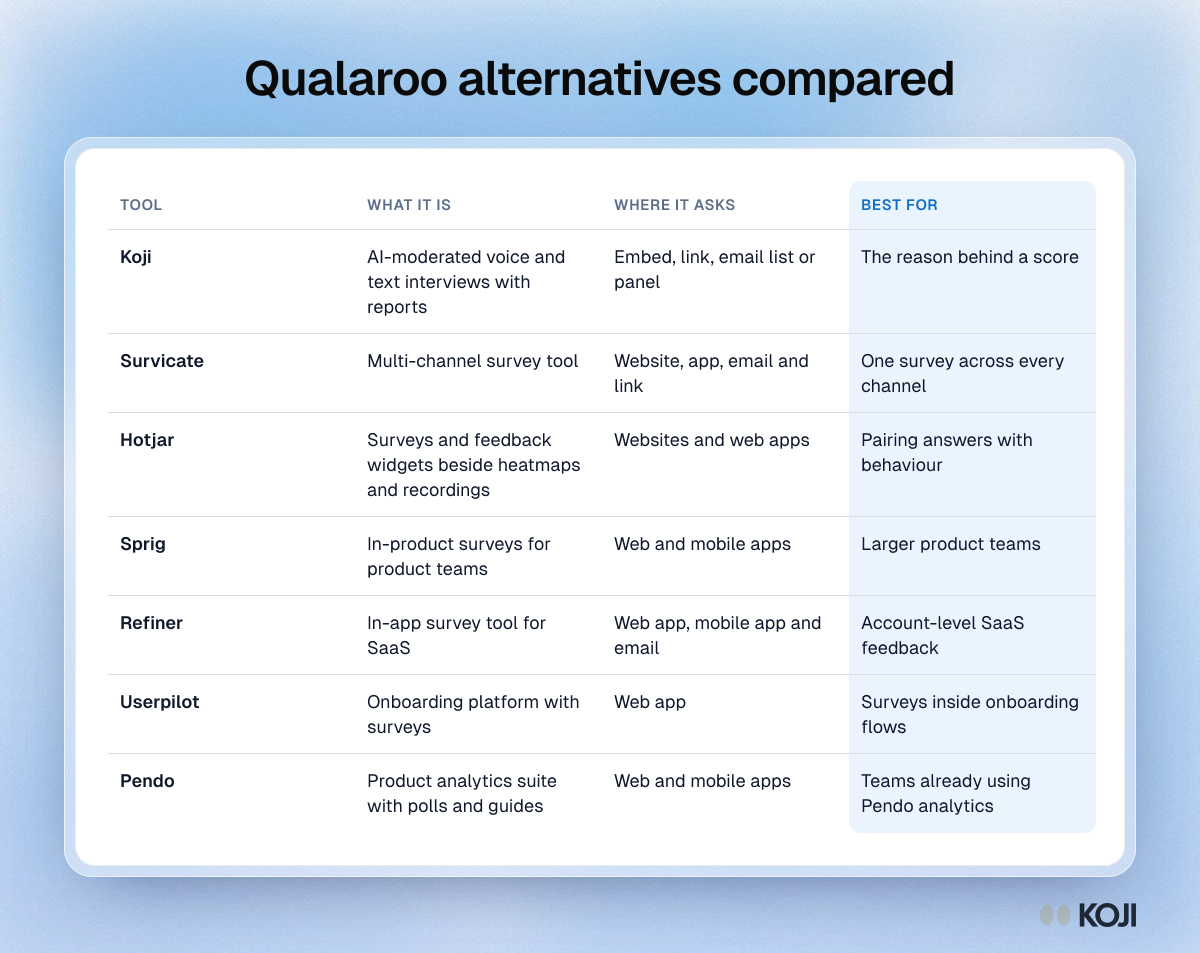
Table comparing Qualaroo alternatives Koji, Survicate, Hotjar, Sprig, Refiner, Userpilot and Pendo by what they are, where they ask and best use

Reference table

Qualaroo alternatives compared
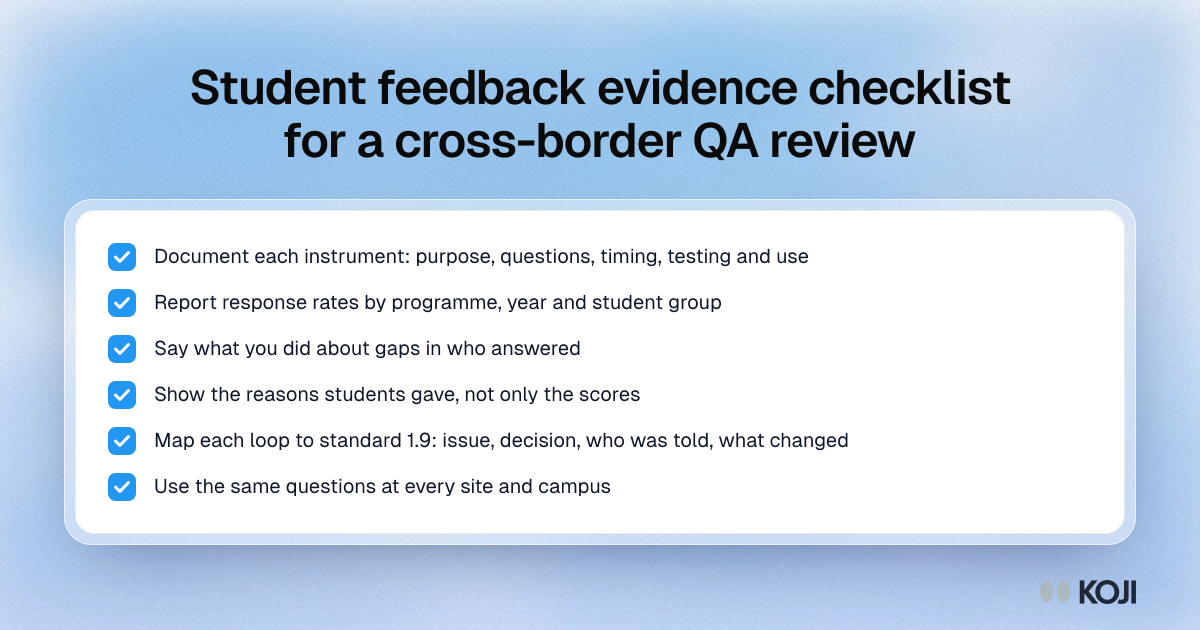
Checklist of six steps to prepare student feedback evidence for a quality review by a foreign agency, from documenting instruments to closing the loop.

Checklist

Student feedback evidence checklist for a cross-border QA review
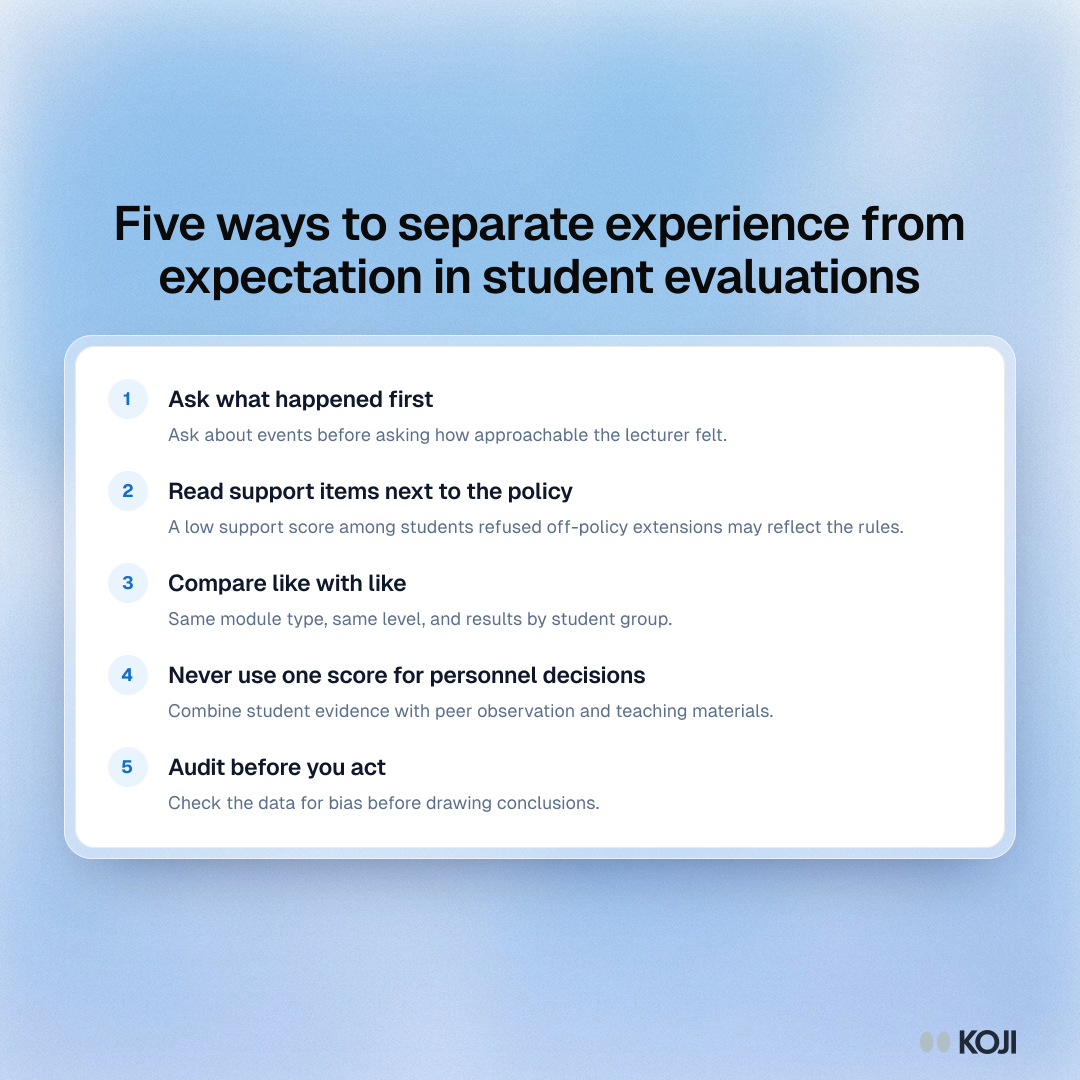
List of five ways to collect student evaluations that separate what happened from gendered expectations, from asking about events to auditing for bias.

Guide

5 ways to separate experience from expectation in student evaluations
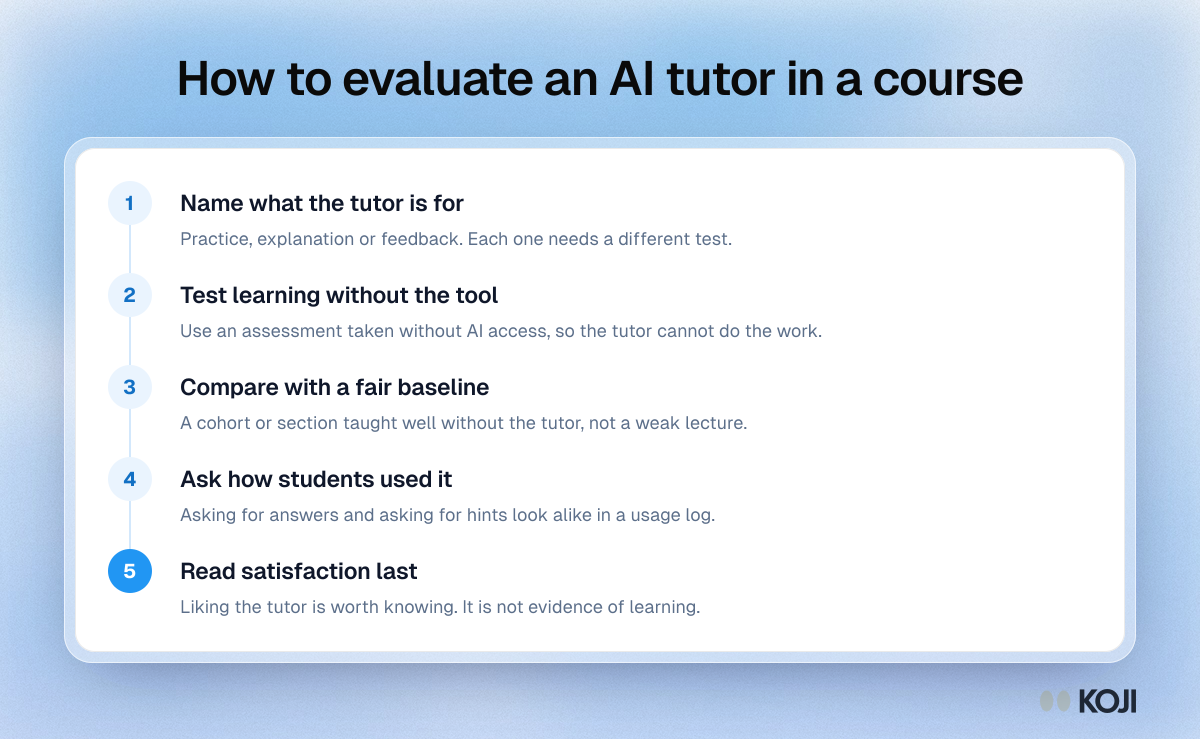
Process diagram with five steps for evaluating an AI tutor in a university course, from defining its purpose to testing learning without the tool.

Process

How to evaluate an AI tutor in a course
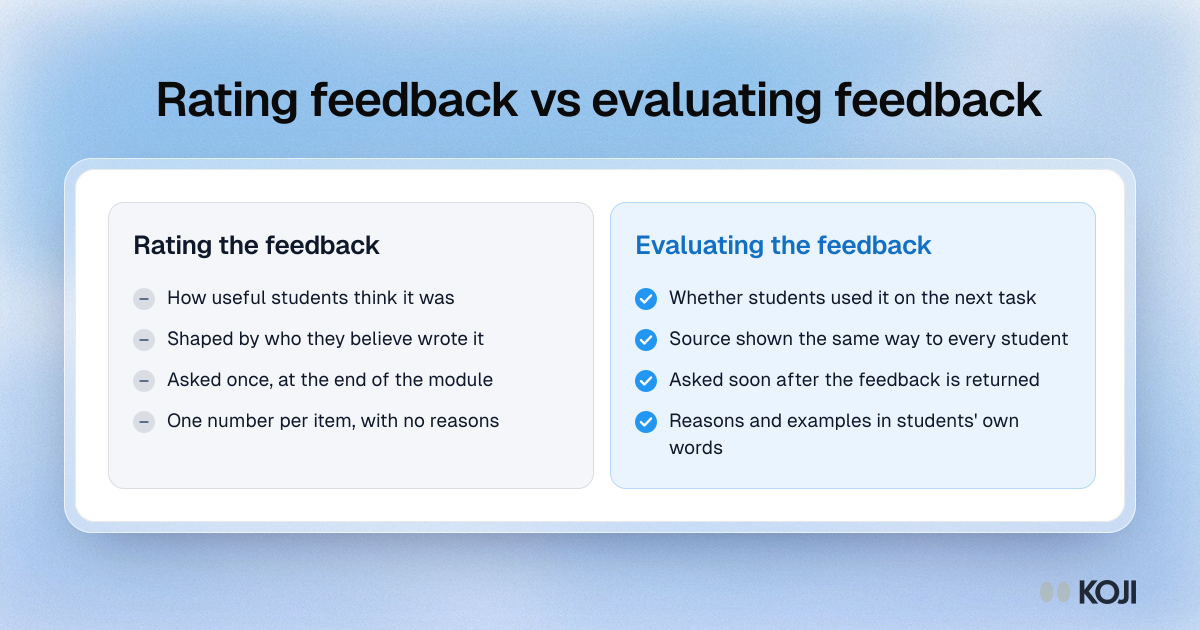
Comparison of rating assessment feedback with a satisfaction item versus evaluating it by use, timing, consistent source labels and students' reasons.

Comparison

Rating feedback vs evaluating feedback
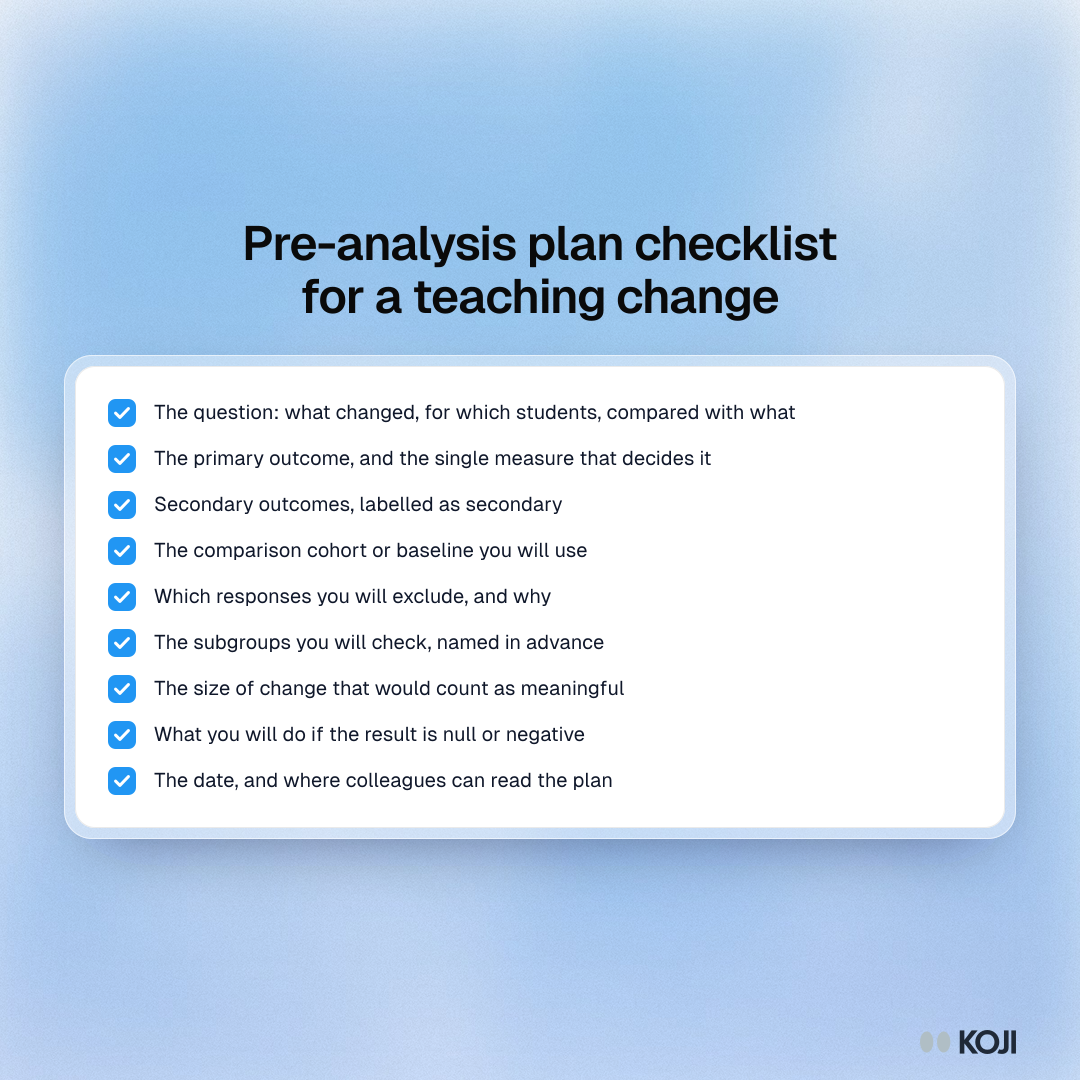
Checklist of nine things to write down before you look at course evaluation data for a teaching change, from the primary outcome to exclusion rules.

Checklist

Pre-analysis plan checklist for a teaching change
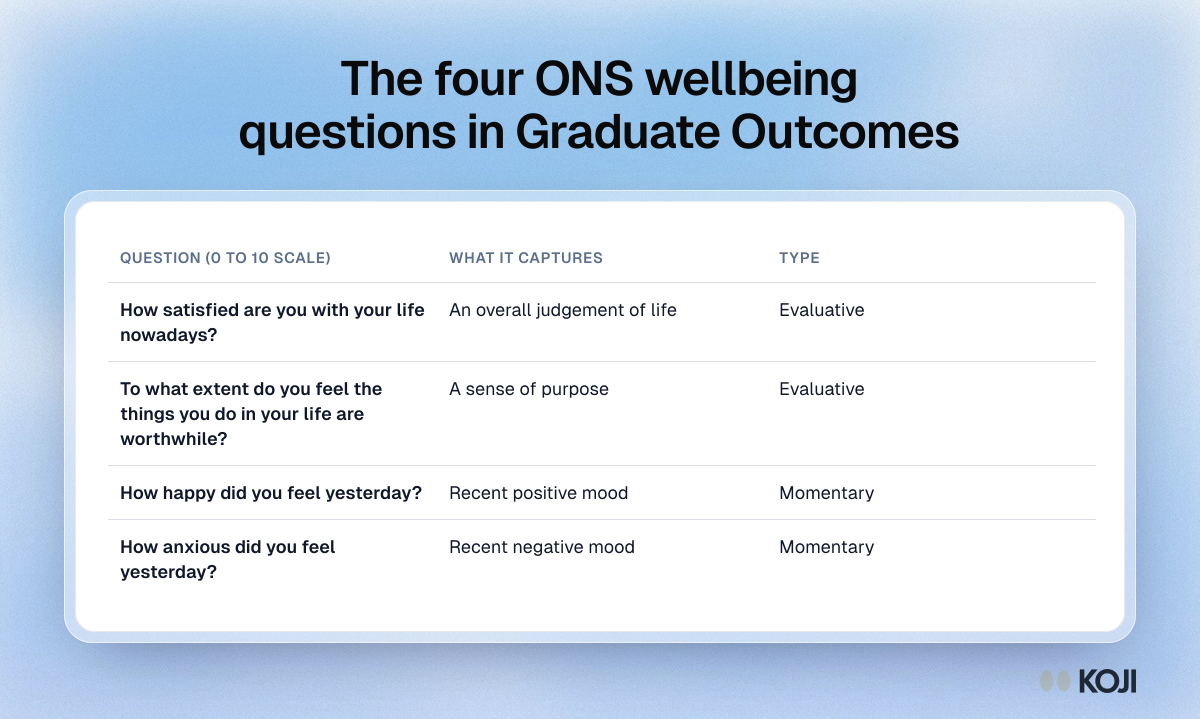
Table of the four ONS personal wellbeing questions asked in the UK Graduate Outcomes survey, split into evaluative and momentary measures.

Reference table

The four ONS wellbeing questions in Graduate Outcomes